Edge-texture 2D image quality metrics suitable for
evaluation of image interpolation algorithms
Sanja Maksimović-Moićević1, Željko Lukač2 , and Miodrag Temerinac3
1 Faculty of Technical Sciences, Trg Dositeja Obradovića 6,
21000 Novi Sad, Serbia [email protected]
2 Faculty of Technical Sciences, Trg Dositeja Obradovića 6, 21000 Novi Sad, Serbia
3 Faculty of Technical Sciences, Trg Dositeja Obradovića 6, 21000 Novi Sad, Serbia
Abstract. A new objective, full-reference metrics of image quality is proposed in this paper. It should match perceptual (subjective) image quality assessment in a better way. The proposed method consists of two quality measures which separately indicate image quality on edges and in texture areas which are calculated in a three-step algorithm. The “soft mask” is initially found for separation in edge and texture areas. Then, two MSEs (mean square error) with corresponding two PSNRs (peak signal-to-noise ratio) for edge and texture are calculated using soft mask as the weighting factor. Finally, the obtained two PSNRs are re-calculated into the two quality indices for edges and texture. Additionally, the separation factor, defined as percentage of edge areas in image, is considered, describing the influence of the image content on perceptual assessment. The proposed 2D metrics is especially suited for evaluations of different interpolation and compression algorithms.
Keywords: image processing, image quality, image texture analysis, image edge detection, image quality metrics.
1.
Introduction
measurement) will be used for this method in this paper. Also the methods based on structural similarity[7] and feature similarity[18] are going to be broadly used in evaluations. The acronym for the first method SSIM (structural similarity image measurement) and the acronym for the second method FSIM (feature similarity image measurement) will be used in this paper.
The existing image quality metrics can be categorized into three classes: full-reference (FR), reduce-full-reference (RR) and no-full-reference (NR). In this paper, the focus is on full-reference methods [4, 17], assuming availability of the reference (original) image. The attention is focused on image quality assessment in the case of image interpolation. In these instances, typical distortions are blurring, blocking and checkerboard patterns [5]. According to the human visual perception model, the eye is very sensitive to blurring around the edges and to blocking in texture areas. Therefore, an image quality metrics should incorporate both aspects.
Background and the related work are given in the second section. A new objective, full-reference method for image quality assessment, which is proposed in this paper, should indicate important aspects for a better match with MOS. The proposed method does not have any adjustable parameters. The main scientific contributions are: the new 2D measures based on a soft mask separation between the edges and texture areas and separation factor related to the content. They are explained in the third section. The proof of the concept is given in the fourth section through two case studies: quality assessment for blurred images with known blurring kernel and comparison of four interpolation algorithms. Results are benchmarked with two previous assessment methods for objective image quality measure: the VQM method [3] and the FSIM method [18]. Finally, conclusions and outlook are given in the fifth section.
2.
Related work
shown that quality assessment is primarily based on the quality measure on edges. The established VQM method following such approach [3] is incorporated in ITU standards due to the high correlation with the subjective image assessment. Two image quality assessment methods, VQM and FSIM, are used as benchmark for the newly proposed 2D quality metrics, eIQM and tIQM. We selected these methods due to the fact that VQM is incorporated in ITU standard and FSIM is a new proposed method.
In previous approaches, the urge to sublimate measures into a single quality index, highly correlated with MOS, is common for almost all quality assessment methods. The two benchmarked methods in many cases show a high correlation with subjective (perceptual) assessments, but there are still some critical cases when these unified quality indices significantly deviate from subjective assessments.
3.
New proposed method: Edge-Texture 2D image quality metrics
The hypothesis, considered in this paper, is that the two measures are needed for more reliable assessment: the quality index for edges and the quality index for textures. Additionally, influence of image content on quality assessment, can be considered using the separation factor - the percentage of pixels belonging to edges in the image. Then, each subjective MOS can be assigned to a segment in the 2D plane, whose axes are edge and texture quality indices. This 2D assigning also depends on the separation factor for a better match with perceptual assessment.
The method for image quality measurement, proposed in this paper, is based on measures of differences between a reference image and its distorted version. The main novelty in the proposed approach is a separate consideration of differences in edge areas and texture areas of the image. For this purpose, a separation factor between edge and texture areas is defined. The proposed measurement algorithm consists of three steps: 1.) edge detection with soft-mask separation; 2.) calculation of two PSNRs based on weighted MSEs; and 3.) calculation of two image quality measure indices eIQM (for edge) and tIQM (for texture). Generally, the proposed method follows the established approach given in [3] with two significant modifications: separation of pixels (soft instead of binary mask) and introducing two quality measures (for edges and texture) instead of only one (edge oriented).
A reference image
Ir(v,h,c);v1,...,Vh1,...,Hc1,...,C
is defined by its size V x H(vertical and horizontal pixels) and the number of color components C. For gray images C=1 and for color images C=3. The image values are normalized to the range between 0 (dark) and 1 (bright). Application of some image processing (like interpolation, compression etc.) results in a distorted image Id(v,h,c) having the same size as the reference image.
( , , ) ( , , ) ( , , ) max ) , ( ,.., 1 1 , 0 , 1 1 , 0 , 1 c h v I c x h y v I c x h y v d h v
D r r
C c x
y
(1)
The soft-mask w(v,h) indicates the significance of a pixel for the edge or texture region, having the range between 0 (texture) and 1 (edge). The values are normalized to the maximum value. Due to the variations of brightness in an image, a segment-based normalization has been proposed by the segment size 8x8:
( 8 , 8 )
..max ) , ( 8 ,..., 1 8 ,..., 1 ,... 1 , 0 ,... 1 , 0 ) , ( ) 8 , 8 ( ) 8 , 8 ( 8 ,..., 1 8 ,...,
1 Dvs vhs h
hs vs Ds h v hs vs hs vs Ds h hs v vs D h hs v vs w h
v
(2)
To exclude a strong influence of segments with small gradient variations, the local normalization factor Ds is replaced by the global maximum difference Dm=max{D} for
Ds<0.1Dm.
Differences between the distorted image Id and the reference image Ir are as follows:
) , , ( ) , , ( ) , ,
(vhc I v hc I vhc
e d r (3)
Differences are used in the standard definition of the mean square error:
V v H h C cc
h
v
e
C
H
V
MSE
1 1 1
2
)
,
,
(
1
(4)The proposed decomposition in two weighted MSEs (for edge and texture regions) have been defined as:
V v H h V v H h C c V v H h V v H h C c h v w C c h v e h v w tMSE h v w C c h v e h v w eMSE 1 1 1 1 12 1 1
1 1 1
2 ) , ( 1 ) , , ( ) , ( 1 ) , ( ) , , ( ) , (
(5)
The separation factor, as an indicator for the content type, is defined as follows:
V v H hh
v
w
H
V
S
1 1)
,
(
1
(6)
V v H h C c V v H h C c c h v e h v w S C H V tMSE c h v e h v w S C H V eMSE1 1 1
2 1 1 1
2 ) , , ( ) , ( 1 1 1 ) , , ( ) , ( 1
(7)
Now, using equations (4)-(7), a decomposition of the standard MSE into two proposed weighted MSEs can be found:
tMSE S eMSE S
MSE (1 ) (8)
According to the standard PSNR (logarithmic in dB):
) ( log
10 10 MSE
PSNR (9)
two new PSNRs (for edge and texture) are proposed:
) ( log 10 ) ( log 10 10 10 tMSE tPSNR eMSE ePSNR
(10)
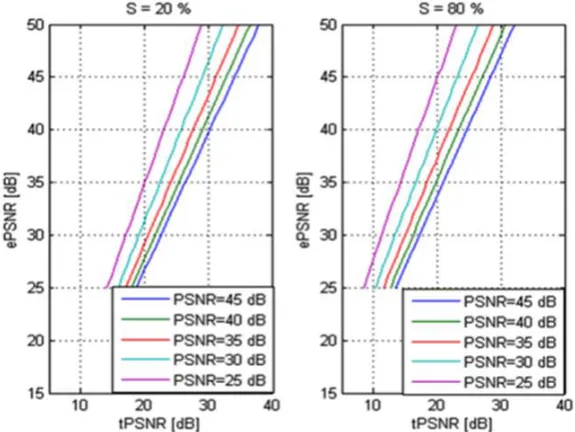
Using (8), a decomposition of the standard PSNR into two proposed PSNRs, is given by:
10 10
10 (1 ) 10 10
log 10 tPSNR ePSNR S S tPSNR ePSNR
PSNR (11)
The visualization of this decomposition in Fig.1. also shows a strong influence of the separation factor S, indicating the assessment dependency on the image content.
Finally, the same adjustment of the two proposed PSNRs is defined due to the de-emphasis of high PSNR, as it is done in [3]. The proposed notations xIQM and xPSNR have been defined for edge and texture areas (x=e and x=t):
xPSNR xPSNR xPSNR xPSNR xPSNR xPSNR xPSNR R xPSN 625 . 65 60 625 . 65 40 ) 40 ( 8 . 0 5 . 39 40 35 ) 35 ( 9 . 0 35 35
(12)
The two adjusted PSNRs are mapped in two image quality indices, having the range between 0 (fully distorted) and 1 (no distortion):
' 0125 .
0 xPSNR
xIQM (13)
4.
New measure evaluation
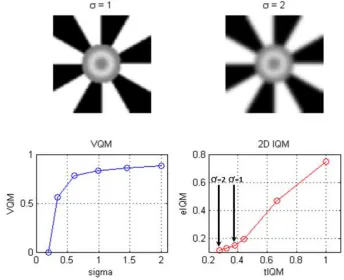
Evaluation of the newly-proposed assessment for image quality 2D IQM (image quality measure) with two measures (eIQM, tIQM) is done through a benchmark with the assessment methods (VQM and FSIM) given in [3] and [18]. The VQM method produces a quality index VQM in the range from 0 (no distortions) to 1 (fully distorted image), whereas the FSIM and the 2D IQM methods produce quality indices in the range from 0 (fully distorted image) to 1 (no distortions). Two types of experiments will be considered in order to demonstrate the strength of the proposed method: quality assessment for known blurring and comparison of interpolation algorithms.
4.1. Quality assessment for known blurring
A simple distortion model shown in Fig. 2. is used for evaluation. It includes blurring of a reference image Ir by a Gaussian filter, which results in a distorted image Id. The vertical and horizontal variances of the filter (σv and σh) are given in pixels. For comparing reference and distorted images, the VQM measure from [3] and the newly-proposed 2D measures (eIQM and tIQM) are calculated.
Fig. 2. A Simple distortion model using Gaussian filter for comparison of the standard quality measure VQM and the newly-proposed 2D IQM
Fig. 3. Binary and soft masks for edge area classification
component tIQM clearly shows these differences. This example shows a better consistency of the proposed 2D IQM method with subjective assessment.
Fig. 4. Comparison of VQM and IQM measures for increasing blurring
The third experiment illustrates advantages of the newly- proposed 2D measure in specific cases. The used reference image only contains horizontal edges. Taking into consideration asymmetrical point-spread-functions (PSF) of the Gaussian filter, two cases are analyzed: larger blurring in the horizontal direction (h: σv=1 and σh=2.5), and larger blurring in the vertical direction (v: σv=2.5 and σh=1).
Fig. 5. Asymmetrically blurred images: horizontally (red) and vertically (blue)
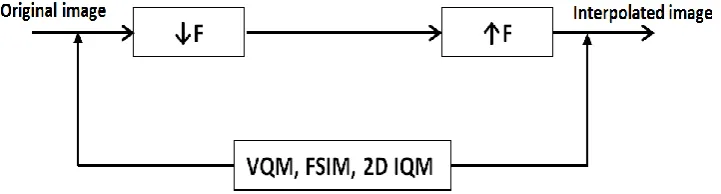
4.2. Interpolation algorithms comparison
scaling factors. The applied comparison framework is shown in Fig. 6. In [19] the authors compare picture quality results for different downscaling techniques. We tested these solutions and could not identify relevant differences in comparison results. Therefore, we selected the simplest SH algorithm. All tested interpolation algorithms (TIA) are tested with different interpolation factors F, the same in vertical and horizontal directions. The same input image Ir has been applied. It is downsized (DS) by the interpolation factor 1/F, using the simplest SH algorithm, and then, using different interpolation methods, to magnified low resolution image (upscaling). Afterwards, the compared assessment methods, VQM, 2D IQM and FSIM are applied to the image pair Ir and Id. This approach is applicable for any factor F (decimation and interpolation). However, in considered experiments only interpolation (F>1) is used.
Fig. 6. Model for comparison of different interpolation algorithms using VQM, FSIM and 2D IQM quality assessments
Five images are used from the LIVE [7,23,24], CSIQ[17] and standard test set of images in this paper. For the test images "Family", “Cameraman“, “Lena”, “Elk” and “Bikes” with different separation factor, the obtained results are shown in Fig. 7., Fig.8., Fig.9., Fig.10. and Fig.11. The separation factor is related to the image content, i. e. higher separation factor means more edges, which corresponds to more details in the image. As it is shown in the five images, the “Bikes” has the most details and the “Family” has the least.
The obtained results for “Family” image are shown in Fig.7. According to the VQM measure, BL algorithm shows the best quality for all scaling factors. In the case of F=3, SH and KI have the same quality. In the case of F=1.5, F=2.5 and F=4, SH and LAI have the same quality. In the case of F=3.5, three algorithms, SH, BL and LAI show the same quality. According to the 2D IQM metrics the BL algorithm achieves the best quality for all scaling factors for the both components (eIQM and tIQM). In the case when it comes to F=3 BL has the best quality, followed by LAI,KI and SH. In the case of F=4 BL has the best quality followed by LAI, SH and KI. For the F=1.5 and F=2.5, the BL has the best quality, followed by LAI and SH. The FSIM measure shows differences for all scaling factors, indicating that the BL algorithm has the best quality, followed by LAI, KI and SH algorithms for almost all scaling factors.
F=1.5, F=2, F=2.5 and F=3, SH and LAI show the same quality. According to 2D IQM metrics, the BL has the best quality for all scaling factors, followed by LAI, KI and SH algorithms for almost all scaling factors. The FSIM measure does not show differences for three algorithms, SH, BL and LAI, in the cases when F=2.5,F=3 and F=3,5. In other cases, the BL shows the best quality, followed by LAI, KI and SH algorithms.
The obtained results for “Lena” image are shown in Fig.9. According to the VQM measure, BL algorithm achieves the best quality for almost all scaling factors. In the case of F=3.5, three algorithms, SH, BL and LAI, have the same quality. In the cases of F=1.5, F=2.5 and F=4, two algorithms, SH and LAI show the same quality. The FSIM measure shows differences, indicating that the BL algorithm has the best quality, followed by LAI,SH and KI algorithms for almost all scaling factors. According to the 2D IQM metrics the BL algorithm achieves the best quality for all scaling factors, followed by LAI, SH and KI for almost all scaling factors. The FSIM measure does not show differences for three algorithm, SH,BL and LAI, in the case when F=3.
The obtained results for “Elk” image are shown in Fig.10. According to VQM measure, BL algorithm achieves the best quality for almost all scaling factors. For F=3, three algorithms SH, BL and LAI, show the same quality. According to 2D IQM metric BL show the best quality for all scaling factors, followed by LAI, KI and SH for almost all scaling factors. The FSIM measure does not show differences for three algorithms, SH,BL and LAI, in the cases when F=3 and F=3.5.
The obtained results for “Bikes” image are shown in Fig.11. According to the VQM, the BL algorithm achieves the best quality for almost all scaling factors. In the case of F=3, the VQM measure does not show differences for three algorithms (SH, BL and LAI). However, the VQM measure shows a slightly better quality for the KI algorithm. In the case of F=3.5, two algorithms, SH and LAI show the same quality. The FSIM measure does not show differences for three algorithm, SH, LAI and BL, for scaling factors F=2.5 and F=3. According to the FSIM, the BL algorithm has the best quality, followed by LAI, SH and KI algorithms for almost all scaling factors. According to the 2D IQM metric, the BL algorithm achieves the best quality for all scaling factors, followed by LAI, KI and SH for almost all scaling factors.
Fig. 11. Comparison of VQM, FSIM and IQM measures for “Bikes” image (S=51.97%)
the BL algorithm has the best quality, followed by the LAI, SH and KI algorithms. Looking at the corresponding images, a subjective quality assessment shows the same gradation of the observed interpolation algorithms.
Fig. 12. Interpolated “Lena” images and three metrics for the scaling factor F=3 and S=28,16%
by the LAI,SH and KI algorithms. It also corresponds to the subjective assessment in a better way.
5.
Conclusion
The newly-proposed 2D measure separately treats the quality in edge and texture areas. To compare different interpolation algorithms, both measures have to be considered: the edge-oriented index eIQM and the texture-oriented index tIQM. In comparison to the standard quality assessments (VQM and FSIM), the proposed assessment method (2D IQM) shows a better match with the subjective assessment, especially better differentiating of quality assessment for different interpolation algorithms.
Further research of the proposed 2D IQM assessment will be directed to finding “image quality segments” in the 2D plane (eIQM and tIQM). Additionally, the segmentation will be separately done for different segmentation factors (S), considering the influence of image content. For that purpose, classification and segmentation will be applied to the proposed 2D measure using the standard set of test images with the known mean opinion scores (MOS).
Acknowledgements. This work was partially supported by the Ministry of Education, Science and Technological Development of the Republic of Serbia under Grant III-4409, year 2014.
References
1. Amanatiadis,А.,Andreadis,I.:Performance evaluation techniques for image scaling algorithms. In Proceedings of the IEEE International Workshop on Imaging Systems and Techniques – IST 2008, Crete, Greece, 114-118(2008)
2. ITU.-R. Recommendation BT.500-13: Methodology for the subjective assessment of the quality of television pictures, (2012)
3. Ahn,W.,Cho,S.,Choe,J. , Jeong,T. ,Lee,C. , Lee,E.: Objective video quality assessment. Optical Engineering Journal, Vol. 22, No.1, 017004.1-11.(2006)
4. Junyao, L., Huijing, W.: Image Quality Assessment Based on Structure and Edge Similarity. In Proceedings of the 2011 Fourth International Conference on Intelligent Computation Technology and Automation (ICICTA 11), 1105-1108.(2011)
5. Amanatiadis, A., Andreadis, I.: A survey on evaluation methods for image interpolation. Measurement Science and Technology, Vol. 20, No.10, 1-10(2009)
6. Bovik ,A.C. , Wang, Z.: Mean squared error: love it or leave it?, IEEE Signal Processing Magazine, Vol.26, No.1, 98-117(2009)
7. Bovik,A.C., Simoncelli,E.P., Sheikh, H.R.,Wang, Z.:Image quality assessment: from error visibility to structural similarity. IEEE Transactions on Image Processing, Vol. 13, No.4, 600-612(2004)
8. Bondžulić,B. , Petrović,V.:Edge/based objective evaluation of image quality. In Proceedings of the 2011 18th IEEE International Conference of Image Processing (ICIP), 3305-3308.(2011)
9. Chikkerur,S., Karam,L.J.,Reisslein,M., Sundaram,V: Objective Video Quality Assessment Methods: A Classification, Review and Performance Comparison. IEEE Transactions on Broadcasting, Vol. 57, No.2, 165-182.(2011)
10. de Villiers, J.P.:A comparison of image sharpness metrics and real-time sharpening methods with GPU implementations. In Proceedings of the 7th International Conference on Computer Graphics, South Africa,53-62.(2010)
Advances in Computing, Control, and Telecommunication Technologies (ICACCTT), India, 859–863.(2009)
12. Jain, A. K.: Fundamentals of digital image processing. Prentice Hall, Upper Saddle River, New Jersey,USA.(1989)
13. Tai Lai, Y., Tzeng, C. F., Wu,H. C.: Adaptive Image Scaling based on local Edge directions. In Proceedings of the International Conference- Intelligent and Advanced Systems (ICIAS), 1-4(2010)
14. Beliakov,G., Bustince,M.,Jurio, A., Mesiar, H.,Pagola, R.: Image Magnification Using Interval Information. IEEE Transactions on Image Processing, Vol.20, No.11,3112-3123(2011)
15. Winkler, S.:Video quality measurement standards-Current status and trends. In Proceeding of the7th ICICS, IEEE Press, Piscataway, NJ, USA, 848-852(2009)
16. Mohandas, P., Winkler, S.:The evolution of video quality measurement: from PSNR to hybrid metrics, IEEE Transactions on Broadcasting, Vol. 54,No.3, 660-668(2008)
17. Chandler, D.M., Larson, E.C: Most apparent distortion: Full-reference image quality assessment and the role of strategy, Journal of Electronic Imaging, vol. 19, 011 006:1-21.(2010)
18. Zhang, L., Zhang, L., Mou, X., Zhang, D.: FSIM:A Feature Similirity Index for Image Quality Assessment. IEEE Transactions on Image Processing, Vol. 20, No.8, 2378-2386(2011)
19. Dumic,E., Grgic,Sonja, Grgic,M.: Hidden Influences on Image Quality when Comparing Interpolation Methods. In Proceedings of the 15th International Conference on Systems, Signals and Image Processing, IWSSIP 2008, 367-372(2008)
20. Chen, S.,Guan, Q., Wang, X.: Image Quality Assessment Based on Structural Saliency. In Proceedings of the 19th International Conference on Digital Signal Processing, 492-496.(2014)
21. ITU-R. Draft New Recommendation: Objective perceptual video quality measurement techniques for digital broadcast television in the presence of a full reference, (2003)
22. ITU-T. Draft Revised Recommendation J.144: Objective perceptual video quality techniques for digital cable television in the presence of a full reference, (2004)
23. Bovik, A.C., Cormack, L., Sheikh, H.R., Wang, Z.: LIVE Image Quality Assessment Database Release 2, Available: http://live.ece.utexas.edu/research/quality.
24. Bovik, A.C., Sabir, M.F., Sheikh, H.R.: A statistical evaluation of recent full reference image quality assessment algorithms, IEEE Transactions on Image Processing, Vol. 15, No. 11, 3440-3451.(2006)
Željko N. Lukač received Diploma and M.Sc. degrees in electrical and computer engineering from the University of Novi Sad, Serbia, were he is currently working towards Ph.D. degree. He is with RT-RK Institute for Computer Based Systems and also a teaching assistant at Computer Engineering and Computer Communications at the Faculty of Technical Sciences in Novi Sad, Serbia. His research interests include image processing, focusing on image interpolation and quality evaluation.
Miodrag Temerinac received the Ph.D. degree in electrical and computer engineering from University of Belgrade, Serbia, in 1983. From 1976 – 1992 he was with the Faculty of technical sciences of the University of Novi Sad, Serbia, as the full professor heading the chair of communications and as the vice faculty dean for research. He is Alexander-von Humboldt fellow (1988-1990) doing research in fields of audio and video compression at the University of Hannover in Germany. In 1992 he changed to industry joining the semiconductor company Micronas GmbH in Freiburg, Germany, where he worked on the IC development for consumer electronics and later as the manager for R&D external relations. In 2005-2006 he founded Micronas R&D Center in Shanghai spending two years as the director of system development. Also, he founded and headed the Micronas development center for TV software in Novi Sad from 2007 to 2009. In last five years he is again with the University of Novi Sad heading the Group for computer engineering and communication. He was the cofounder of the RT-RK company. His fields of interest are DSP algorithms and architectures, audio and video signal processing, video quality assessment, hw/sw co-design of complex systems on chip, product development in consumer electronics, knowledge management and management of internal and external development networks. Hi is the senior IEEE member and the VDE/ITG member.