P
EDIATRICS
威
Oct 2004VOL. 114 NO. 4 䡠䡠䡠 䡠䡠䡠 䡠䡠䡠 䡠䡠䡠 䡠䡠
Newborn Screening for Lysosomal Storage Disorders:
Clinical Evaluation of a Two-Tier Strategy
Peter J. Meikle, PhD*‡; Enzo Ranieri, BScHons*‡; Henrik Simonsen, MD, PhD§; Tina Rozaklis, BscHons*; Steve L. Ramsay, PhD*; Phillip D. Whitfield, PhD*; Maria Fuller, PhD*‡; Ernst Christensen, MscEng㛳;
Flemming Skovby, MD㛳; and John J. Hopwood, PhD*‡
ABSTRACT. Objective. To evaluate the use of protein markers using immune-quantification assays and of me-tabolite markers using tandem mass spectrometry for the identification, at birth, of individuals who have a lyso-somal storage disorder.
Methods. A retrospective analysis was conducted of Guthrie cards that were collected from newborns in Den-mark during the period 1982–1997. Patients whose lyso-somal storage disorder (LSD; 47 representing 12 disor-ders) was diagnosed in Denmark during the period 1982– 1997 were selected, and their Guthrie cards were retrieved from storage. Control cards (227) were retrieved from the same period. Additional control cards (273) were collected from the South Australian Screening Centre (Australia).
Results. From 2 protein and 94 metabolite markers, 15 were selected and evaluated for their use in the identifi-cation of LSDs. Glycosphingolipid and oligosaccharide markers showed 100% sensitivity and specificity for the identification of Fabry disease, ␣-mannosidosis, muco-polysaccharidosis (MPS) IVA, MPS IIIA, Tay-Sachs dis-ease, and I-cell disease. Lower sensitivities were ob-served for Gaucher disease and sialidosis. No useful markers were identified for Krabbe disease, MPS II, Pompe disease, and Sandhoff disease. The protein mark-ers LAMP-1 and saposin C were not able to differentiate individuals who had an LSD from the control popula-tion.
Conclusions. Newborn screening for selected LSDs is possible with current technology. However, additional development is required to provide a broad coverage of disorders in a single, viable program.Pediatrics2004;114: 909–916;genetic disease, mass spectrometry, oligosaccha-ride, glycolipid, protein marker.
ABBREVIATIONS. LSD, lysosomal storage disorder; MPS, muco-polysaccharidosis; GC, glucosylceramide; LC, lactosylceramide; CTH, ceramide trihexoside; CV, coefficient of variation.
L
ysosomal storage disorders (LSDs) represent a group of ⬎45 distinct genetic diseases, each one resulting from a deficiency of a particular lysosomal protein or, in a few cases, from nonlyso-somal proteins that are involved in lysononlyso-somal bio-genesis. Most LSDs are inherited in an autosomal recessive manner, with the exceptions of Fabry dis-ease, Danon disdis-ease, and mucopolysaccharidosis (MPS) type II, which display X-linked recessive in-heritance. Some LSDs have been classified into clin-ical subtypes (eg, the Hurler/Scheie definition of MPS I, the infantile/juvenile/adult-onset forms of Pompe disease), but it is clear that most LSDs have a broad continuum of clinical severity and age of pre-sentation. With the advent of molecular biology/ genetics and the characterization of many of the LSD genes, it is now recognized that the range of severity may in part be ascribed to different mutations within the same gene. However, genotype/phenotype cor-relations are imprecise, and other factors, including genetic background and environmental factors, pre-sumably play a role in disease progression.Although each LSD results from mutations in a different gene and consequent deficiency of enzyme activity or protein function, all LSDs share one com-mon biochemical characteristic, in that the disorder results in an accumulation of substrates that are nor-mally degraded within lysosomes. The particular
From the *Lysosomal Diseases Research Unit, Department of Genetic Med-icine, Women’s and Children’s Hospital, North Adelaide, South Australia, Australia; ‡Department of Paediatrics, University of Adelaide, Adelaide, South Australia, Australia; §Department of Clinical Biochemistry, Statens Serum Institut, Copenhagen, Denmark; and㛳Department of Clinical Genet-ics, National University Hospital, Copenhagen, Denmark.
Accepted for publication Mar 22, 2004. doi:10.1542/peds.2004-0583
Reprint requests to (P.J.M.) Lysosomal Diseases Research Unit, Department of Chemical Pathology, Women’s and Children’s Hospital, 72 King William Rd, North Adelaide, 5006, SA, Australia. E-mail: peter.meikle@adelaide. edu.au
substrates stored and the site(s) of storage vary with disease type. The nature of the substrate is used to group the LSD into broad categories, including MPS, lipidoses, glycogenoses, and oligosaccharidoses.1
These categories show many clinical similarities within groups as well as significant similarities be-tween groups. Common features of many LSDs in-clude bone abnormalities, organomegaly, central nervous system dysfunction, and coarse hair and facies.
Treatment of some LSDs is possible. Cystinosis is treated with cysteamine,2 and a number of LSDs,
including MPS I, MPS VI,3–5and Wolman disease,6
have been responsive to bone marrow transplanta-tion. Furthermore, patients who have metachromatic leukodystrophy and Krabbe disease and receive a transplant before clinical signs are evident have been reported to develop less central nervous system pa-thology than patients who do not receive a trans-plant or patients who receive a transtrans-plant after clin-ical signs are present.7Enzyme replacement therapy
has been used to treat nonneuropathic Gaucher dis-ease for⬎10 years with considerable success. More recently, enzyme replacement therapy for Fabry dis-ease and MPS I has become available,8,9and clinical
trials of this type of therapy for MPS II, MPS VI, and Pompe disease are in progress. Enzyme replacement therapy is likely to be limited to those LSD types that do not develop central nervous system pathology. However, when the procedure is applied early, bone marrow and more recently cord blood stem cell transplantation have been reported to benefit a num-ber of LSD types that have been shown to develop central nervous system pathology.4–7,10It is probable
that within the next few years, therapies will be available for many of the LSDs.
The effectiveness of these therapies, particularly for those LSDs that involve central nervous system and bone pathologies, will rely heavily on the early diagnosis and treatment of the disorder, before the onset of irreversible pathology. An additional consideration, critical to bone marrow transplant therapy, is that early diagnosis of LSDs will allow clinicians to take advantage of the window of oppor-tunity presented by the naturally immature immune system in the neonate to maximize the chance of successful engraftment. Early detection of these dis-orders has the added advantage of permitting ge-netic counseling for the parents, with the option of prenatal diagnosis in subsequent pregnancies. In the absence of a family history, the only practical way to identify affected individuals presymptomatically is through a newborn screening program.
LSDs are rare disorders with prevalence values ranging from⬃1:50 000 births to⬍1:4 000 000 births.11
However, when considered as a group, the com-bined prevalence is substantially higher. We have previously estimated the prevalence of LSD in Aus-tralia to be 1:7700 births, excluding the neuronal ceroid lipofuscinoses. The prevalence of this latter group of LSD has been reported to be as high as 1 per 12 500 births in the United States.12In Finland,
prev-alence values of 1 per 13 000 births for infantile and 1 per 21 000 births for juvenile forms have been
reported.13Clearly, the neuronal ceroid
lipofuscino-ses will contribute significantly to the overall preva-lence of LSD. It is equally certain that additional LSDs will be identified as our understanding of ly-sosomal biology and the clinical manifestations re-sulting from lysosomal dysfunction improve. A con-servative estimate of the prevalence of LSDs in the Australian population would be 1 in 5000 births. The cost of screening for LSDs individually would, in most cases, be prohibitive as a result of the low prevalence. However, screening for multiple disor-ders as a group with a total prevalence rate of ⬃1:5000 births could be economically justified.
We have previously identified a number of poten-tially useful protein markers of LSDs14–16 that may
enable the identification of the majority of individu-als with LSDs into a high-risk group. More recently, we have developed tandem mass spectrometry– based methods for the determination of many of the stored oligosaccharide and glycosphingolipid sub-strates in LSDs.17,18Here we report on the evaluation
of these markers using retrospective newborn Guth-rie cards.
METHODS Patient Samples
Statens Serum Institut, Denmark, has established a biological specimen bank of Guthrie cards collected from newborns since 1981.19These cards have been stored at⫺20°C since they were
used for screening. Guthrie cards were retrieved from LSD pa-tients (n ⫽ 47) who were born during the period 1982–1997. Control cards (n⫽227, matched for age of the cards) were re-trieved from the same period. Additional control, newborn Guth-rie cards (n ⫽ 273) were obtained from the South Australian Newborn Screening Centre during 2001. The dried blood spots from Denmark were collected on S&S 2992 paper, and the samples from Australia were on S&S 903. A correction factor (0.79), deter-mined using radiolabeled tracer in whole blood, was used to correct for the lower blood volume of the Denmark samples. All cards were deidentified. The use of the cards was approved by the Women’s and Children’s Hospital Ethics Committee and the Copenhagen-Frederiksberg Scientific Ethics Committee.
Production and Labeling of Antibodies
The anti–LAMP-1 monoclonal antibody (BB6) has been re-ported previously.20 The anti-saposin C monoclonal antibody
(7B2) was generated by the method of Zola and Brooks21after
immunizing mice with recombinant saposin C22using a standard
complete/incomplete Freunds adjuvant protocol.23Polyclonal
an-tibodies were produced in rabbits against both recombinant LAMP-124and saposin C22using standard complete/incomplete
Freunds adjuvant protocols.23 Affinity-purified polyclonal
anti-bodies against LAMP-1 and saposin C were labeled with eu-ropium and samarium, respectively, using DELFIA labeling kits (Wallac, Melbourne, Australia).
Determination of LAMP-1 and Saposin C in Dried Blood Spots
The protein markers LAMP-1 and saposin C were determined by immune quantification in a dual assay using time-resolved fluorescence. The individual assays have been described previous-ly.14,16In this study, the assays were combined into a single well
by using both europium and samarium labels. Briefly, microtiter plates were coated (16 hours, 4°C) with a combination of anti– LAMP-1 monoclonal antibody (BB6) and anti–saposin C monoclo-nal antibody (7B2) at 5.0 mg/L in 0.1 mol/L NaHCO3. The plates
anti–LAMP-1 polyclonal antibody (200g/L) and samarium-la-beled anti–saposin C polyclonal antibody (200g/L). The plate was shaken (1 hour, 20°C), incubated (16 hours, 4°C), then washed (⫻6) with DELFIA wash buffer. DELFIA enhancement solution (200L) was added to each well, and the fluorescence was deter-mined on a DELFIA 1234 research spectrophotometer. Protein marker concentrations were calculated by comparison with blood-spot calibration curves prepared for each analyte as previously described.25
Derivatization of Oligosaccharides for Mass Spectrometry
Dried blood spots (3 mm) were punched from the Guthrie cards and derivatized with 1-phenyl-3-methyl-5-pyrazolone.18
N-Acetyl-glucosamine-6-SO4(d3) (200 pmol), synthesized as previously
de-scribed,26and methyllactose (100 pmol) were included with each
blood spot as internal standards.
Extraction of Glycosphingolipids
Dried blood spots (3 mm) were extracted with isopropanol (200
L) that contained 200 pmol each of the stable isotopes of glu-cosylceramide C16:0 (GC) and lactosylceramide C16:0 (LC), GC (d3), and LC (d3), respectively, as internal standards. The blood spots were removed, the isopropanol was evaporated under a stream of nitrogen, and the glycosphingolipids were redissolved in methanol that contained 5 mmol/L NH4COOH (100L).
Mass Spectrometry
Mass spectrometric analysis of oligosaccharides and glyco-sphingolipids was performed using a PE Sciex API 3000 triple-quadruple mass spectrometer with a turbo-ionspray source and LC-Tune/Multiview data system (PE Sciex, Concord, Ontario, Canada). Samples (20 L) were injected into the electrospray source with a Gilson 233 autosampler using a carrying solvent of 50% CH3CN/0.025% HCOOH in water (oligosaccharides) or
methanol (glycosphingolipids) at a flow rate of 100L/min. For all analytes, nitrogen was used as the collision gas at a pressure of 2⫻10⫺5torr. Neutral oligosaccharides and glycosphingolipids
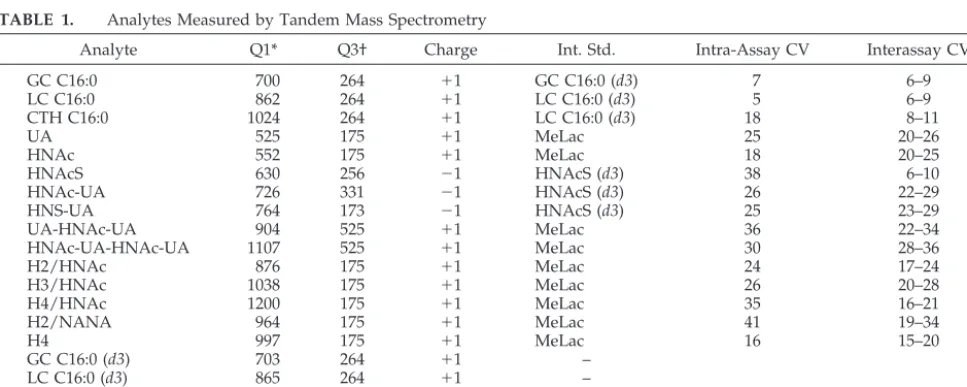
were analyzed in⫹ve ion mode, and sulfated oligosaccharides were analyzed in⫺ve ion mode. Determination of oligosaccha-rides and glycosphingolipids was performed using the multiple-reaction monitoring mode. Fourteen different glycosphingolipid and ceramide species, in addition to 80 species of oligosaccharides, were monitored (data not shown). Many species of oligosaccha-ride were not detectable in blood. The ion pairs for the glycosphin-golipid and oligosaccharide species that gave the greatest sensi-tivity for the detection of each LSD are shown in Table 1. Each ion pair was monitored for 100 ms, and the measurements were repeated and averaged over the injection period. Determination of
oligosaccharides was achieved by relating the peak heights of the PMP-oligosaccharides to the peak height of the PMP-MeLac (⫹ve ion mode) or the PMP-N-acetylglucosamine-6-SO4(d3) (⫺ve ion
mode). Determination of glycosphingolipids was achieved by re-lating the peak height of GC to the peak height of GC (d3) and the peak heights of LC and ceramide trihexoside (CTH) to the peak height of LC (d3).
Quality Control and Statistical Analysis
Intra- and interassay coefficients of variation (CVs) for the protein analytes were determined with low and high blood-spot QC standards prepared as previously reported.25Interassay CVs
for each of the oligosaccharide and glycosphingolipid analytes were determined using 3 separate QC blood spots for 10 repeats over 5 days. Intra-assay CVs were calculated from 9 repeats of a single QC blood spot. The Mann-WhitneyU test was used to measure the difference between control and patient groups for each analyte. Pearson correlation coefficients were used to deter-mine the correlation between analyte concentration and age of the Guthrie card. Discriminant analysis was performed using SPSS for Windows (Chicago, IL).
RESULTS Protein Markers in Dried Blood Spots
Intra-assay CVs for the LAMP-1 and saposin C assays were ⬍12% and 15%, respectively, whereas interassay CVs were ⬍15% and 18%, respectively. Determination of the lysosomal proteins LAMP-1 and saposin C in dried blood spots showed no sig-nificant correlation between the concentration of each protein marker and the age of the blood spots as determined by the Pearson correlation coefficients. There was no significant difference between LAMP-1 concentration in the Denmark control group and the SA control group as determined by the nonparamet-ric analysis, including all data sets (Mann-WhitneyU
test). However, the difference between the saposin C concentrations in these groups, although small (me-dian values: 117g/L and 129g/L, respectively), was significant (P ⬍ .01; Fig 1). Furthermore, only I-cell disease showed a significant elevation in the LAMP-1 protein marker concentration (P⬍.05) and only Fabry disease showed a significant elevation in the saposin C marker concentration (P⬍ .01; Fig 1,
TABLE 1. Analytes Measured by Tandem Mass Spectrometry
Analyte Q1* Q3† Charge Int. Std. Intra-Assay CV Interassay CV
GC C16:0 700 264 ⫹1 GC C16:0 (d3) 7 6–9
LC C16:0 862 264 ⫹1 LC C16:0 (d3) 5 6–9
CTH C16:0 1024 264 ⫹1 LC C16:0 (d3) 18 8–11
UA 525 175 ⫹1 MeLac 25 20–26
HNAc 552 175 ⫹1 MeLac 18 20–25
HNAcS 630 256 ⫺1 HNAcS (d3) 38 6–10
HNAc-UA 726 331 ⫺1 HNAcS (d3) 26 22–29
HNS-UA 764 173 ⫺1 HNAcS (d3) 25 23–29
UA-HNAc-UA 904 525 ⫹1 MeLac 36 22–34
HNAc-UA-HNAc-UA 1107 525 ⫹1 MeLac 30 28–36
H2/HNAc 876 175 ⫹1 MeLac 24 17–24
H3/HNAc 1038 175 ⫹1 MeLac 26 20–28
H4/HNAc 1200 175 ⫹1 MeLac 35 16–21
H2/NANA 964 175 ⫹1 MeLac 41 19–34
H4 997 175 ⫹1 MeLac 16 15–20
GC C16:0 (d3) 703 264 ⫹1 –
LC C16:0 (d3) 865 264 ⫹1 –
MeLac 687 175 ⫹1 –
HNAcS (d3) 633 259 ⫺1 –
S indicates sulphate; HN, hexosamine; UA, uronic acid; H, hexose; NANA, N-acetylneuraminic acid; MeLac, methyllactose. * Ion monitored in quadrapole 1.
Table 2). A significant correlation was observed be-tween LAMP-1 and saposin C in the Denmark and SA control populations with Pearson correlation co-efficients of 0.65 (P⬍.01) and 0.70 (P⬍.01), respec-tively.
Glycosphingolipid Markers in Dried Blood Spots
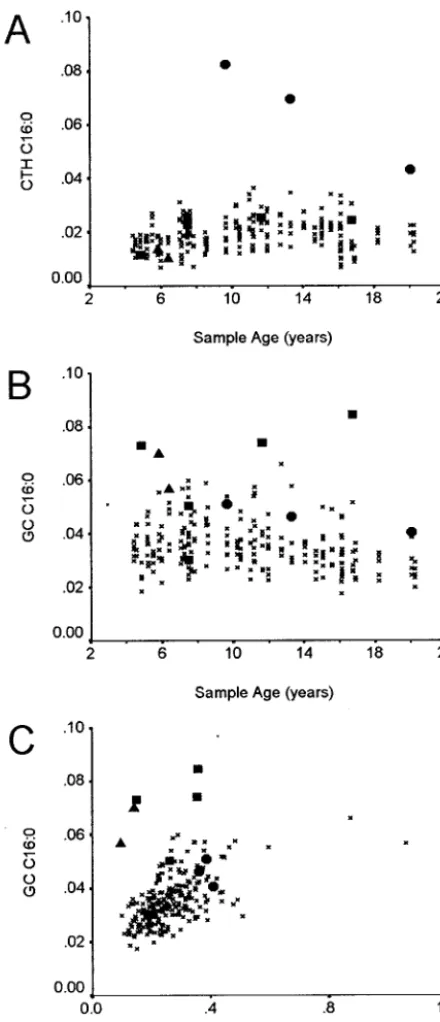
Intra- and interassay CVs for the glycosphingo-lipid markers were within the range of 6% to 18% and are detailed in Table 1. There was no significant correlation between the concentration of the glyco-sphingolipids LC and CTH and the age of the control Guthrie cards. A significant but weak correlation was observed between the concentration of GC and the age of the control Guthrie cards (Pearson correlation coefficient:⫺0.259; P⬍ .01). Linear regression anal-ysis indicates that the loss of GC C16:0 over the period of Guthrie card collection would be in the order of 20%. Six of the LSD groups showed signif-icant differences from the control group in 1 or more of the glycosphingolipid analytes (Table 2). The marker CTH C16:0 clearly resolves all of the Fabry patients from the control group (Fig 2A). GC C16:0
resolves 3 of the 5 Gaucher patients and 1 of the 2 I-cell patients from the control group (Fig 2B). When a combination of the GC C16:0 and LC C16:0 markers was used, it was possible to discriminate both I-cell patients as a result of the low LC C16:0 concentra-tions (Fig 2C). Krabbe disease, MPS IIIA, and sialido-sis patient groups all showed significantly decreased concentrations of 1 or more glycosphingolipid mark-ers. However, only the MPS IIIA–affected patients could be clearly differentiated from the control group (Fig 3).
Oligosaccharide Markers in Dried Blood Spots
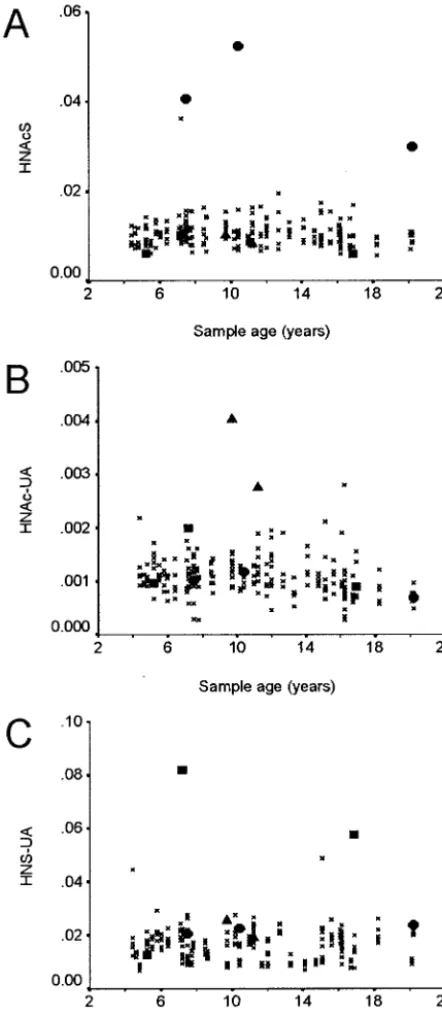
Intra- and interassay CVs for the oligosaccharide markers were within the range of 6% to 41% and are detailed in Table 1. High CVs were observed for those analytes in which the concentration in control blood spots was relatively low. All of the LSD groups, with the exception of Pompe disease, showed significant differences from the control pop-ulation, in the concentration of 1 or more of the oligosaccharide markers (Table 2). Figure 4A shows the discrimination of the MPS IVA patients from the control group using the N-acetylhexosamine-sulfate marker. The Tay-Sachs patients could be resolved from the control group using the N-acetylhex-osamine-uronic acid disaccharide (HNAc-UA) marker (Fig 4B), and 2 of the 3 sialidosis patients could be resolved with the hexosamine sulfate-uronic acid (HNS-UA) marker (Fig 4C). The storage oligosaccharides in␣-mannosidosis are made up of different combinations of hexose (H) and N-acetyl-hexosamine (HNAc) with the following composi-tions: H2/HNAc, H3/HNAc, and H4/HNAc. All of these were significantly elevated in the ␣ -man-nosidosis patient, although there was 1 control sam-ple that had higher levels of these oligosaccharides (data not shown). Although the MPS II, Krabbe, Pompe, and Sandhoff patient groups showed signif-icant increases or decreases in specific oligosaccha-rides, these did not provide clear discrimination of these patient groups from the control group. Dis-criminant analysis was performed on these groups; however, the resulting functions did not substan-tially improve the discrimination of the patient and control populations. The MPS IIIA patients had elevated levels of the trisaccharide UA-HNAc-UA and tetrasaccharide HNAc-UA-HNAc-UA, although these did not provide total discrimination of this group. The resolving power was increased when the glycosphingolipid marker LC C16:0 was also used as the MPS IIIA patients had a low concentration of this marker (Fig 3). Table 2 shows a summary of the sensitivity and specificity of selected markers for the individual LSD groups.
DISCUSSION
We have previously proposed a 2-tier screening strategy for LSDs.14This strategy involved a first-tier
screen to identify a group at increased risk, using the lysosomal protein markers LAMP-1 and saposin C. This was followed by a second-tier screen, in which lysosomal substrates are quantified by tandem mass spectrometry to identify affected individuals.
ous studies on plasma samples from control and LSD-affected patients indicated that the first-tier screen would identify 70% to 90% of patients as high risk.14,16 We have observed similar results when
these studies were repeated on dried blood spots from LSD patients (unpublished observations). In this study, we proposed to evaluate the 2-tier strat-egy using retrospective, newborn Guthrie cards from LSD patients. Retrospective analysis of Guthrie cards for protein markers is limited as a result of the insta-bility of proteins in these cards when stored at room temperature. The Statens Serum Institut in Denmark has stored all Guthrie cards at⫺20°C since 1980. The low temperature seems to stabilize the cards, making retrospective analysis possible. The patient group in this study was limited to newborns who were born in Denmark during the period 1982–1997.
The results from the LAMP-1/saposin C first-tier screen showed almost no difference between the pa-tient groups and the control group. Of the 12 disor-ders included in the study, only I-cell and Fabry disease showed significant differences from the con-trol group (Table 2). Of the 2 I-cell patients, only 1 had a LAMP-1 concentration above the 95 centile of the control group, and only 1 of the 3 Fabry patients had a saposin C concentration above the 95 centile of the control group. The absence of any correlation between age of the blood spots and protein analyte concentration and the similarities between the mean LAMP-1 values of the Denmark controls and the SA controls indicate that the age of the blood spots has minimal effect on the protein concentrations deter-mined for LAMP-1. The small but significant de-crease in the saposin C concentrations in the Den-mark control compared with the SA controls may reflect the lower stability of this protein compared with LAMP-1. It is unclear why there is no apparent increase in LAMP-1 or saposin C protein levels when there are obvious increases in a number of storage substrates in a range of disorders. However, it is noteworthy that both LAMP-1 and saposin C have a broad range in the newborn population with a large number of statistical outliers (Fig 1). This is thought to result from the elevated and variable white cell count in newborns, rather than any lysosomal disor-der in these individuals, and may mask the elevation in the LSD-affected newborns. The significant
corre-lation between LAMP-1 and saposin C in both the Denmark and the SA control groups also indicates a general increase in lysosomes/white cells rather than a storage disorder in the control individuals with high LAMP-1 and saposin C levels. The relationship between the protein markers and the storage sub-strates requires further investigation, particularly in the newborn period.
The glycosphingolipid and oligosaccharide mark-ers determined by mass spectrometry showed clear differentiation between control and affected groups for most of the disorders examined (Table 2). Fabry and Gaucher patients both showed increases in their primary storage substrates CTH and GC, respec-tively. All of the Fabry patients showed an elevation of CTH, whereas only 3 of 5 Gaucher patients showed an elevation in the concentration of GC. All of the Gaucher patients were of the neuropathic type 2 (1 sample 4.8 years old; see Fig 2) or type 3 phe-notypes. It is not clear what other factors may be affecting the glycolipid levels in these newborns. The I-cell patients also showed an increase in GC concen-tration, and these patients were further resolved from the control group by plotting GC values against LC values. We had previously observed that the ratio of GC to LC provides better definition between Gau-cher and control groups17 and believe that this
re-lates to the downregulation of glycosphingolipid production in response to the gross accumulation of GC. That this effect was not observed in the Gaucher patients may reflect the early stage of the disorder and the relatively low level of GC accumulation. MPS IVA–affected individuals were clearly identi-fied by the increase in the concentration of the N-acetylhexosamine-sulfate monosaccharide. This monosaccharide accumulates as a result of the action of -hexosaminidase on the stored keratan sulfate saccharides.27MPS IIIA patients showed an increase
in the concentration of the tetrasaccharide HNAc-UA-HNAc-UA, although this is not a primary stor-age substrate for MPS IIIA as it does not contain the N-sulfated glucosamine residue at the nonreducing terminus. Presumably, the accumulation of this oli-gosaccharide results from the altered turnover of glycosaminoglycan within the affected cells. Use of this marker alone did not provide 100% specificity and sensitivity for the identification of MPS IIIA;
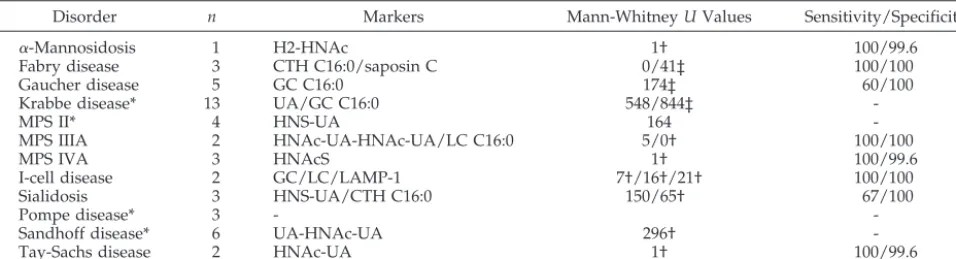
TABLE 2. Sensitivity and Specificity of Selected Markers for the Identification of LSDs
Disorder n Markers Mann-WhitneyUValues Sensitivity/Specificity
␣-Mannosidosis 1 H2-HNAc 1† 100/99.6
Fabry disease 3 CTH C16:0/saposin C 0/41‡ 100/100
Gaucher disease 5 GC C16:0 174‡ 60/100
Krabbe disease* 13 UA/GC C16:0 548/844‡
-MPS II* 4 HNS-UA 164
-MPS IIIA 2 HNAc-UA-HNAc-UA/LC C16:0 5/0† 100/100
MPS IVA 3 HNAcS 1† 100/99.6
I-cell disease 2 GC/LC/LAMP-1 7†/16†/21† 100/100
Sialidosis 3 HNS-UA/CTH C16:0 150/65† 67/100
Pompe disease* 3 -
-Sandhoff disease* 6 UA-HNAc-UA 296†
-Tay-Sachs disease 2 HNAc-UA 1† 100/99.6
* No suitable marker identified. †P⬍0.05.
however, when combined with the LC marker, we were able to differentiate the MPS IIIA individuals from the control group (Fig 3). In Tay-Sachs disease, we observed the accumulation of the HNAc-UA dis-accharide as a result of the -hexosaminidase defi-ciency, and the␣-mannosidosis–affected individual also showed elevated levels of the primary storage substrates. In 2 of 3 sialidosis patients, we observed an increase in the HNS-UA disaccharide but not in the N-acetylneuraminic acid– containing
tetrasaccha-ride. The explanation for this is unclear at this stage but may relate to the rate of clearance of different oligosaccharides from circulation. We have observed that oligosaccharides resulting from lysosomal stor-age are present in urine at many times the concen-tration of plasma, so the kidneys seem to be very efficient at removing these oligosaccharides from cir-culation. This also relates to the inability to identify the Pompe disease–affected individuals from the ac-cumulation of the H4 tetrasaccharide that is elevated in the urine of these patients18and results from the
limited digestion of glycogen in circulation.28 MPS
II–, Krabbe-, and Sandhoff-affected individuals all showed significant differences in some analytes but were unable to be resolved from the control popula-tion. This may be related to the phenotype of these patients or to the particular storage substrates present. Additional work will be required to identify suitable markers for these disorders.
This study has identified the limitations of the 2-tier strategy for newborn screening for LSD; addi-tional primary markers will be required for complete success. We have reported that in Pompe disease, the determination of the␣-glucosidase protein or activ-ity can be performed on a dried blood spot using antibody capture techniques and is diagnostic for this disorder.25,29 Chamoles et al30,31 performed
en-zyme analysis for a number of disorders from dried blood spots and can differentiate affected from con-trol populations. Thus, the use of deficient proteins/ enzymes as markers for LSD is feasible. However, the challenge lies in the ability to multiplex these assays to enable the screening for multiple LSDs in a single procedure. The low prevalence of these disor-ders makes it unlikely that screening programs for individual disorders will be widely adopted, and performing multiple assays to cover a range of dis-orders will not be cost-effective.
An alternate approach is to use the mass spectro-metric analysis of glycosphingolipids and oligosac-charides in a single-tier screen. We have demon-strated that this is feasible for a number of LSDs with
Fig 2. Glycosphingolipids levels in selected LSD groups. Glyco-sphingolipids were determined from 3-mm blood spots as de-scribed in Methods. CTH (A) and GC (B) were plotted against age of the blood spots. GC was also plotted against LC (C). x, control;
F, Fabry;■, Gaucher;Œ, I-cell.
the current markers, although additional markers would be required to provide coverage of LSDs for which therapy is currently available. One limitation to this approach is the labor-intensive derivatization process for the determination of oligosaccharides. Although it is possible for 1 person to process 100 to 200 samples per day, this process would need to be automated for large-scale screening programs. A sec-ond limitation of this approach is the relatively low concentration of many of the oligosaccharides in
cir-culation. We have identified many oligosaccharides that are elevated many-fold in the urine of LSD pa-tients but only slightly elevated or not elevated in blood (unpublished data). If this approach is to achieve optimal results, then consideration should be given to the use of urine in a newborn screen. This has been achieved in some limited population stud-ies such as the preclinical detection of neuroblastoma in Japan and Canada.32,33 However, collection of an
additional sample from all newborns would substan-tially increase the cost of screening for LSDs and would limit the implementation of such a program. Additional work to identify suitable markers and evaluate strategies will be required before newborn screening for LSDs is to be widely accepted.
ACKNOWLEDGMENTS
This study was supported by Pharming BV (The Netherlands), TLH Research (United States), The Wellcome Trust (United King-dom), and the National Health and Medical Research Council of Australia (Canberra, Australia).
We are grateful to Bent Nørgaard-Pedersen for giving access to the Guthrie cards and to Alison Whittle and the staff of the South Australian Newborn Screening Center for the determination of protein markers.
REFERENCES
1. Hopwood JJ, Brooks DA. An introduction to the basic science and biology of the lysosome and storage diseases. In: Applegarth DA, Dimmick JE, Hall JG, eds.Organelle Diseases. London, UK: Chapman and Hall Medical; 1997:7–36
2. Gahl WA, Reed GF, Thoene JG, et al. Cysteamine therapy for children with nephropathic cystinosis.N Engl J Med.1987;316:971–977 3. Hopwood JJ, Vellodi A, Scott HS, et al. Long-term clinical progress in
bone marrow transplanted mucopolysaccharidosis type I patients with a defined genotype.J Inherit Metab Dis.1993;16:1024 –1033
4. Hoogerbrugge PM, Brouwer OF, Bordigoni P, et al. Allogeneic bone marrow transplantation for lysosomal storage diseases. The European Group for Bone Marrow Transplantation.Lancet.1995;345:1398 –1402 5. Hoogerbrugge PM, Valerio D. Bone marrow transplantation and gene
therapy for lysosomal storage diseases.Bone Marrow Transplant.1998; 21(suppl 2):S34 –S36
6. Krivit W, Peters C, Dusenbery K, et al. Wolman disease successfully treated by bone marrow transplantation.Bone Marrow Transplant.2000; 26:567–570
7. Krivit W, Aubourg P, Shapiro E, Peters C. Bone marrow transplantation for globoid cell leukodystrophy, adrenoleukodystrophy, metachromatic leukodystrophy, and Hurler syndrome.Curr Opin Hematol.1999;6:377–382 8. Beck M. Agalsidase alfa—a preparation for enzyme replacement ther-apy in Anderson-Fabry disease.Expert Opin Investig Drugs.2002;11: 851– 858
9. Laronidase.BioDrugs.2002;16:316 –318
10. Krivit W. Stem cell bone marrow transplantation in patients with met-abolic storage diseases.Adv Pediatr.2002;49:359 –378
11. Meikle PJ, Hopwood JJ, Clague AE, Carey WF. Prevalence of lysosomal storage disorders.JAMA.1999;281:249 –254
12. Rider JA, Rider DL. Thirty years of Batten disease research: present status and future goals.Mol Genet Metab.1999;66:231–233
13. Santavuori P. Neuronal ceroid-lipofuscinoses in childhood.Brain Dev.
1988;10:80 – 83
14. Chang MH, Bindloss CA, Grabowski GA, et al. Saposins A, B, C, and D in plasma of patients with lysosomal storage disorders. Clin Chem.
2000;46:167–174
15. Hua CT, Hopwood JJ, Carlsson SR, Harris RJ, Meikle PJ. Evaluation of the lysosome-associated membrane protein LAMP-2 as a marker for lysosomal storage disorders.Clin Chem.1998;44:2094 –2102
16. Meikle PJ, Brooks DA, Ravenscroft EM, et al. Diagnosis of lysosomal storage disorders: evaluation of lysosome-associated membrane protein LAMP-1 as a diagnostic marker.Clin Chem.1997;43(suppl):1325–1335 17. Whitfield PD, Nelson P, Sharp PC, et al. Correlation among genotype,
phenotype, and biochemical markers in Gaucher disease: implications for the prediction of disease severity.Mol Genet Metab.2002;75:46 –55
18. Rozaklis T, Ramsay SL, Whitfield PD, Ranieri E, Hopwood JJ, Meikle PJ. Determination of oligosaccharides in Pompe disease by electrospray ionization tandem mass spectrometry.Clin Chem.2002;48:131–139 19. Norgaard-Pedersen B, Simonsen H. Biological specimen banks in
neo-natal screening.Acta Paediatr Suppl.1999;88:106 –109
20. Carlsson SR, Fukuda M. Structure of human lysosomal membrane glycoprotein 1. Assignment of disulfide bonds and visualization of its domain arrangement.J Biol Chem.1989;264:20526 –20531
21. Zola H, Brooks DA. Techniques for the production and characterisation of monoclonal hybridoma antibodies. In: Hurrell JGR, ed.Monoclonal Hybridoma Antibodies: Techniques and Applications. Boca Raton, FL: CRC Press; 1982:1–58
22. Qi X, Leonova T, Grabowski GA. Functional human saposins expressed in Escherichia coli. Evidence for binding and activation properties of saposins C with acid beta-glucosidase. J Biol Chem. 1994;269: 16746 –16753
23. Harlow E, Lane D.Antibodies A Laboratory Manual. Cold Spring Harbor, NY: Cold Spring Harbor Laboratory; 1988:53–138
24. Meikle PJ, Yan M, Ravenscroft EM, Isaac EL, Hopwood JJ, Brooks DA. Altered trafficking and turnover of LAMP-1 in Pompe disease-affected cells.Mol Genet Metab.1999;66:179 –188
25. Umapathysivam K, Whittle AM, Ranieri E, et al. Determination of acid alpha-glucosidase protein: evaluation as a screening marker for Pompe disease and other lysosomal storage disorders. Clin Chem.2000;46: 1318 –1325
26. Ramsay SL, Meikle PJ, Hopwood JJ. Determination of monosaccharides
and disaccharides in mucopolysaccharidoses patients by electrospray ionisation mass spectrometry.Mol Genet Metab.2003;78:193–204 27. Hopwood JJ, Elliott H. Urinary excretion of sulphated
N-acetylhex-osamines in patients with various mucopolysaccharidoses.Biochem J.
1985;229:579 –586
28. Hallgren P, Hansson G, Henriksson KG, Hager A, Lundblad A, Svens-son S. Increased excretion of a glucose-containing tetrasaccharide in the urine of a patient with glycogen storage disease type II (Pompe’s disease).Eur J Clin Invest.1974;4:429 – 433
29. Umapathysivam K, Hopwood JJ, Meikle PJ. Determination of acid alpha-glucosidase activity in blood spots as a diagnostic test for Pompe disease.Clin Chem.2001;47:1378 –1383
30. Chamoles NA, Blanco M, Gaggioli D, Casentini C. Tay-Sachs and Sand-hoff diseases: enzymatic diagnosis in dried blood spots on filter paper: retrospective diagnoses in newborn-screening cards.Clin Chim Acta.
2002;318:133–137
31. Chamoles NA, Blanco M, Gaggioli D, Casentini C. Gaucher and Nie-mann-Pick diseases— enzymatic diagnosis in dried blood spots on filter paper: retrospective diagnoses in newborn-screening cards.Clin Chim Acta.2002;317:191–197
32. Suita S, Stephen L. Gans overseas lecture. Mass screening for neuro-blastoma in Japan: lessons learned and future directions.J Pediatr Surg.
2002;37:949 –954
33. Brodeur GM, Look AT, Shimada H, et al. Biological aspects of neuro-blastomas identified by mass screening in Quebec.Med Pediatr Oncol.
DOI: 10.1542/peds.2004-0583
2004;114;909
Pediatrics
Hopwood
Phillip D. Whitfield, Maria Fuller, Ernst Christensen, Flemming Skovby and John J.
Peter J. Meikle, Enzo Ranieri, Henrik Simonsen, Tina Rozaklis, Steve L. Ramsay,
Two-Tier Strategy
Newborn Screening for Lysosomal Storage Disorders: Clinical Evaluation of a
Services
Updated Information &
http://pediatrics.aappublications.org/content/114/4/909
including high resolution figures, can be found at:
References
http://pediatrics.aappublications.org/content/114/4/909#BIBL
This article cites 30 articles, 8 of which you can access for free at:
Subspecialty Collections
http://www.aappublications.org/cgi/collection/genetics_sub Genetics
sub
http://www.aappublications.org/cgi/collection/fetus:newborn_infant_ Fetus/Newborn Infant
following collection(s):
This article, along with others on similar topics, appears in the
Permissions & Licensing
http://www.aappublications.org/site/misc/Permissions.xhtml
in its entirety can be found online at:
Information about reproducing this article in parts (figures, tables) or
Reprints
http://www.aappublications.org/site/misc/reprints.xhtml
DOI: 10.1542/peds.2004-0583
2004;114;909
Pediatrics
Hopwood
Phillip D. Whitfield, Maria Fuller, Ernst Christensen, Flemming Skovby and John J.
Peter J. Meikle, Enzo Ranieri, Henrik Simonsen, Tina Rozaklis, Steve L. Ramsay,
Two-Tier Strategy
Newborn Screening for Lysosomal Storage Disorders: Clinical Evaluation of a
http://pediatrics.aappublications.org/content/114/4/909
located on the World Wide Web at:
The online version of this article, along with updated information and services, is
by the American Academy of Pediatrics. All rights reserved. Print ISSN: 1073-0397.