In silico screening of ligand databases: Methods and applications
8
0
0
Full text
(2) www.ijpsonline.com. docking or by pharmacophore search method, is the availability of a database (DB) of ligand molecules. A corporate database or one available from commercial vendors such as Available Chemicals Directory (ACD)9 or Cambridge Structural Database (CSD) 10 can be employed for this purpose. Additionally, a database of known reagents and compounds which are readily synthesizable can be used for VS after primary filtration for ‘drug-like’ properties2 such as variation of Lipinski’s rule-of-five11, number of rotatable bonds or the polar surface area. A database could also be filtered to remove compounds with specific substructures associated with poor chemical stability or toxicity. Also, physically relevant ionization and tautomeric states should be assigned to compounds in the DB. It is prudent to use all the relevant tautomers because there is no way of knowing a priori which tautomer is most likely to bind to the receptor.. theoretical method such as comparative modelling). The 3D structure of the receptor is corrected and transformed into an appropriate format depending on the requirements of the docking program. The docking method then samples the conformational space of the binding site and scores each possible ligand pose, which is then taken as the predicted binding mode of that ligand. The ligand and receptor flexibility is an important aspect in VS because the conformations of the ligand, as well as the receptor binding site residues, might be different from their conformation in the bound state. The aspects of ligand and receptor flexibility are tackled to some extent in some of the docking programs (flexible search) or by pre-computing a DB of several conformers of each compound to be screened, as mentioned in the previous section. A majority of the docking programs explore ligand flexibility through a variety of algorithms. One way to explore the ligand’s conformational space is to use Monte Carlo or simulated annealing methods13,14, but these are often time consuming and not suitable for large-scale VS. The Genetic Optimization of Ligand Docking (GOLD15, Cambridge Crystallographic Data Center, UK; http://www.ccdc.cam.ac.uk) and the most recent version of AutoDock16 (Scripps Research Institute, USA) use genetic algorithm-based approaches to generate and select the best conformations of a ligand. Flex-X 17 (Tripos Inc., USA) has a fragment-based approach and uses a set of low energy torsion angles derived from the CSD for each single bond. GOLD also enables the customization of torsional energy contributions via a statistical analysis of torsion angle distributions observed in CSD. The program Glide (Schrödinger Inc., USA; http://www.schrödinger.com) treats ligand flexibility by an exhaustive enumeration of the rotamer states for each rotatable bond coupled to a heuristic screen that rapidly eliminates conformations deemed unsuitable for binding to a receptor.. m rf o d ns a lo tio n a w c i o bl For the generation of the 3D structure of a molecule d during compilation of a database, one can use programs e Pu ). such as Corina (Molecular Networks GmbH, http:// e www.mol-net.com), Concord and Confort (Tripos Inc., fr w om o USA) or Converter (Accelrys Inc., USA). Sometimes it isor f kn .c necessary to assign partial charges to compounds in the le ed ow database depending on the requirement of the 3D search b method. la M dkn i a flexibility. y e Another issue in VS is the handling of ligand v b a in dVS either.m Conformational flexibility can be introduced s ethe search through the database or the query,ior during t w s process. Handling conformationalF flexibility in the database w D ho of each involves storage of multiple conformations w ligand ( P in the DB. However, this is a practically intractable te s ofsconformations i i solution because the number a ligand h ain the number ofofrotatable increases with anT increase bonds. A small drug-like molecule with four rotatable 12. bonds, if scanned at a resolution of 120° for each dihedral angle, yields [360/120]4 = 81 conformations, and there is no firm basis for the ones to be included in the DB. A better solution is the hybrid approach. The combination of multi-conformer database and flexible searching provides an efficient and effective route. This hybrid approach is employed in the Catalyst BEST search method (Accelrys Inc., USA).. VS USING DOCKING The docking process involves the simulation of molecular recognition events using the 3D structure of the receptor (obtained by X-ray crystallography or NMR or a 690. Majority of the docking methods treat the receptor as a rigid entity, which is an inaccurate but necessary approximation in order to limit the complexity and consequently the computational cost required to accurately sample the flexibility of the binding site. Researchers have used an ensemble of protein structures to incorporate protein flexibility. This ensemble of protein structures can be obtained by simulated annealing of the binding site or by use of several high resolution structures of the same target bound to different ligands or in apo form, or by use of an ensemble of NMR structures, or by use of multiple homology models. The programs AutoDock16 and Flex-E18 (Tripos Inc., USA). Indian Journal of Pharmaceutical Sciences. November - December 2006.
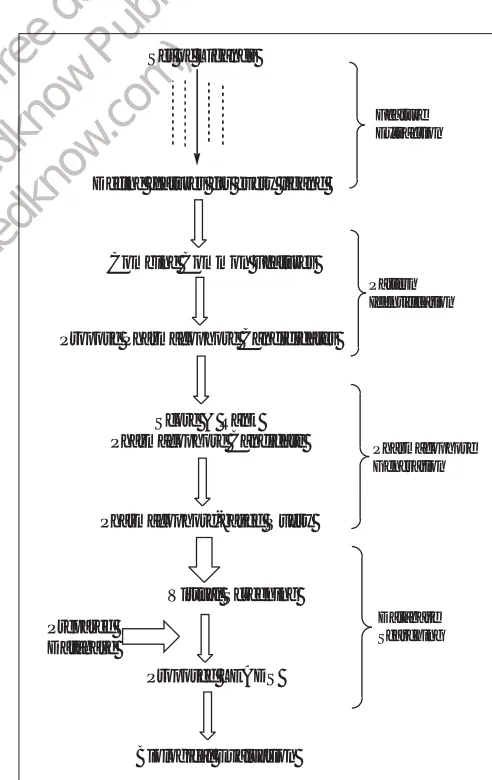
(3) www.ijpsonline.com. incorporate protein mobility through rotamer libraries for flexible side chains and by use of an ensemble of protein structures to generate Boltzman-weighted grids with which the docking function is generated19. The next important step that determines the success of the docking process is ranking the quality of different poses of the same molecule and then with respect to other molecules in the DB (Scoring). There are several scoring functions20 available to achieve this task. Force field-based scoring functions such as AMBER 21 , CHARMm22 and CVFF23 are based on atomic force fields in which single-point intermolecular interaction energy between the ligand and the receptor is used as a score for the given pose. Empirical scoring functions are based on an additive approximation of physicochemical properties such as H-bonding, hydrophobic interactions, entropic changes and metal-ion interactions, if present. Experimental binding energies of known ligand-receptor complexes are used to derive the coefficients of each term explaining a binding event. Therefore, the efficiency of these scoring functions depends on the variety and number of ligand-receptor complexes used to derive the scoring function and its validation on a large set of ligand-receptor complexes in the PDB. GOLD24, FlexX17, SCORE25, VALIDATE26, ChemScore27, Ludi28 (Accelrys Inc., USA) and PLP29 use an empirical scoring function to rank different poses. The GOLD scoring function has been validated on a large data set30 and uses a genetic algorithm to rank the poses, and it is considered to be a reliable docking and scoring algorithm for VS. Another class of scoring functions, knowledgebased, is derived from the structures of ligand-receptor complexes using statistical mechanics. In contrast to empirical scoring functions, they do not require binding affinity data of ligand-receptor complexes and so are free to use information in ligand-receptor complexes deposited in the public or proprietary databases. Further, such scoring functions are expected to be less biased and more readily transferable to systems not included in the development of the scoring function. PMF31, Bleep32, SMOG33 and DrugScore34 (Cambridge Crystallographic Data Center, CCDC, UK) are some examples of knowledge-based scoring functions. A flow chart of the steps involved in VS by docking method is depicted in fig. 1.. Ligands with known binding pose & affinities. Receptor 3D-structure. Docking Reproduced the experimental pose? No. Starting Database. Prepared Database. Validation of Docking Protocol. Yes Docking Database Searching. Filter for 'drug-likeness' Post-Docking Analysis (Consensus scoring). m rf o d ns a lo tio n a such as PLP, ChemScore and w c i of several scoring functions o blor no correlation between predicted and Dock d found little e Pubinding experimental Therefore, it becomes e ). affinities. rf crucialwto use a post-analysis strategy to minimize the false mselection list. In consensus scoring r positives in the o o o f strategy n ., ca docking function is used to generate topk poses then multiple scoring functions are wscore and le edranked o b used to these poses. Then, only the top-ranked n common to each scoring method are chosen la M compounds k i a by eford biological evaluation. It has been observed that almost v all docking methods are able to identify the correct a si ted w.m binding pose but usually cannot rank it as the topranked binding pose for the ligand. Therefore, it is s w F o prudent to use consensus scoring of multiple poses rather than a top-ranked single pose. PD te h (w is si h Based on the above known limitations, it is strongly T a advisable to use a set of ligands with known binding. At the end of the docking process, a set of best compounds is selected. It is not advisable to select the compounds merely on the basis of scoring or ‘best ranking’. A recent study35 that evaluated the performance November - December 2006. Select molecules for biological assay. Fig. 1: Flow chart of the virtual screening process using docking method. 36-38. 39. modes and affinities, and multiple docking and scoring (consensus) algorithms, to calibrate the docking methodology for the target under study before undertaking VS of large databases.. VS USING PHARMACOPHORE METHODS The docking methodologies discussed above help in screening databases only when the 3D structure of the target receptor is available. In the early phase of drug discovery, or in cases where the structure elucidation is beyond the capabilities of present day techniques, the docking technique cannot be used. A pharmacophore-based. Indian Journal of Pharmaceutical Sciences. 691.
(4) www.ijpsonline.com. search of databases can be carried out in absence of the receptor structure with the help of the information available from a set of ligands binding preferentially to the given receptor. The credit for first conceiving the concept of the pharmacophore goes to Paul Ehrlich, who devised a way (in early 1900s) to develop dyes through chromophores (i.e., the part of a molecule responsible for imparting colour)40. A good review of the evolution and history of the pharmacophore concept has been published by Peter Gund41, who is also the author of the modern definition of a pharmacophore - “a set of structural features in a molecule that is recognized at a receptor site and is responsible for that molecule’s biological activity”42,43. The concept could not achieve its full utilization until the development of 3D database searching software in 1990. MOLPAT44 , the first computer program, was developed at Princeton University in 1974 by Gund, Wipke and Langridge to recognize pharmacophore patterns. The demand for 3D searching software reached a critical level with the development of rapid 3D structure generation programs such as CONCORD45, CORINA12,46, AIMB47 and WIZARD48. ALADDIN 49 (developed at Abbott and later commercialized by Daylight) and 3D-Search 50 (developed at Lederle) were developed by pharmaceutical companies, whereas academic and government institutions were responsible for CAST-3D51 (Chemical Abstract Services), DOCK52 (University of California at San Francisco) and CAVEAT53 (University of California at Berkley). The first commercial 3D searching system, MACCS-3D54, was developed by Güner et al. and was released in December of 1989. During the next 4 y, all of the technology that is available today was developed - ChemDBS-3D 55 (Accelrys Inc., USA), UNITY56 (Tripos Inc., USA) and Catalyst57 (Accelrys Inc., USA). The critical demand for the pharmacophore recognition software arose when the above-mentioned 3D searching technologies were made easily available. Though these 3D-search software had inbuilt query-generation tools, specialized pharmacophore generation software were also being developed. Most notable among them are DISCO58 by Martin et al. (Tripos Inc., USA), HipHop59 by Barnum et al. (Accelrys Inc., USA) and GASP60 by Jones and Willett (Tripos Inc., USA). Meanwhile, predictive pharmacophore models such as CoMFA61 by Cramer et al. (Tripos Inc., USA), Apex-3D 62 by Golander and Vorpagel (Accelrys Inc., USA) and HypoGen63 by Teig et al. (Accelrys Inc., USA) were being developed. Detailed usage and validation of all of the pharmacophore development software are covered. elsewhere41. For timely reviews in the field, the reader may follow other references64-68. Pharmacophore modelling provides a useful framework for better understanding of the existing data and can be used as a predictive tool in the design of compounds with improved potency, selectivity and/or pharmacokinetic properties. Pharmacophore models are generated by analyzing structure-activity-relationships and mapping common structural features of active analogues. The pharmacophore can be identified by direct method (using a receptor-ligand complex) or by indirect method (using only a collection of ligands that have experimentally been observed to interact with a given receptor). However, direct methods are becoming extremely important because of the increase in the rate at which protein structures are being determined. A flow chart of steps involved in VS by the pharmacophore method is depicted in fig. 2.. m rf o d ns a lo tio n a w c i do ubl e P ). e fr w m r fo kno .co le ed ow b la M dkn i a by e v a si ted w.m s w F o PD te h (w is si h T a. 692. Set of Ligands. Feature Extraction. Define features for every ligand. Combine Common Features Pattern Identification. Propose Pharmacophore Candididates. Score & Rank Pharmacophore Candidate. Pharmacophore Generation. Pharmacophore-based Query. Virtual Screening Database Searching. Prepared Database Proposed LEADS. Biological Evaluation Fig. 2: Flow chart of the virtual screening process using pharmacophore method. Indian Journal of Pharmaceutical Sciences. November - December 2006.
(5) www.ijpsonline.com. Pharmacophore generation: Pharmacophore generation starts with the selection of a set of ligands for which the pharmacophore model is to be constructed. The type of ligand molecules, the size of the dataset and its diversity have a great impact on the resulting pharmacophore model67. The Carnell-Smith method69, RAPID70 and HipHop59,64,71 assume that ligands have the same activity and thus do not consider activity data. The information of inactive ligands can also be used to indicate structural features that significantly decrease the activity. The programs that use information of inactive ligands are CLEW72 and the current version of DISCO58. Pharmacophore models can also be used to predict the activity of unknown compounds. For deriving such models, HypoGen63 utilizes a large enough set of diverse compounds (about 18-30) with different activity levels (4-5 orders of magnitude). Most of the currently available methods such as HipHop, HypoGen, MPHIL73 and RAPID are designed to handle small (less than 100 ligands) data sets. Other methods use larger data sets as input but convert them into a smaller one by sorting the activities of the ligands, depending on a user-specified cut-off. Lastly, one should remember that though the dataset should be as diverse as possible to get an accurate pharmacophore model, very different ligands may bind at different binding sites, resulting in a misleading pharmacophore model74.. combined to form a representation of the whole structure. The RAPID method represents ligand structures as a set of labelled points in three-dimensional space, where each point is associated with a feature70. Another approach by Takahashi et al.76 represents a ligand structure through a labelled graph, with nodes representing the features and the edges representing the relations. Different methods that use this representation are given in the literature77. In another approach, a ligand structure is considered a set of labelled points, together with the associated interpoint distances77. This type of representation is orientation independent, in contrast to the 3D point-set representation.. m rf o d ns a lo tio n a w c i do ubl e P ). e fr w m r fo kno .co le ed ow b la M dkn i a tobythe e In the next step, the features relevant v pharmacophore model are extractedafrom d the inputm . s e i ligands (feature extraction). Features cant be defined w F depending on topology (phenyl ring s and carbonyl wbase, Algorithms for pattern identification have also been o D group), function (H-bond donor/acceptor, acid, w h and (atom (3D developed. (For a detailed description, see reference 67). P tgroup) aromatic ring and hydrophobic e isits type)si . Both topology-based The Clique detection algorithm has been implemented position of an atom and h and function-basedTfeaturesahave some drawbacks. For in DISCO and MPHIL methods. Clique detection has its example, hydroxyl oxygen can be classified as both an Horigin in graph theory. A clique is a subgraph in which. The features extracted from different ligand molecules are matched and pharmacophore candidates are proposed. This is called pattern identification. A pattern or configuration is a set of relative locations in 3D space, each associated with a feature. A ligand is said to match a pattern if it possesses a set of features and a conformation such that the features can be superimposed with the corresponding locations. The most popular approach to define a pattern is to find the maximal common substructure (MCS). The methods that have adopted this approach are DISCO 58, RAPID 70 , GAMMA78 and GASP60. This approach assumes that a common pharmacophore is responsible for the observed activity. This is an inaccurate assumption in the MCS approach and can be overcome by relaxing the requirements (“Relax MCS” approach) that all input ligands possess all the features. This philosophy is used in the MPHIL74 method.. 67. 79-81. bond donor and acceptor. A simple way to represent a functional group is by its centre. The centre of an acid, base, H-bond donor/acceptor is usually defined as the position of an actual atom. For a hydrophobic region or an aromatic ring, the centre is defined as the centroid of the group. Furthermore, a vector representation is more accurate than a point representation since it imposes an additional constraint on bond directionality between the ligand feature and its complementary feature on the receptor71,75. In addition, a hydrophobic group can be represented by a sphere and an aromatic ring by a plane and its normal. From each ligand structure, the selected features are November - December 2006. every node is connected to every other node. The Clique detection algorithm finds the largest clique in a reference graph which is also present in every other graph in the set. HipHop and SCAMPI use an exhaustive search algorithm in which the search for a pattern starts with small sets of features and extends until no larger common pattern exists. HypoGen uses a similar approach but also incorporates activity information into the pharmacophore derivation process. This is done in three steps: the constructive stage identifies pharmacophore candidates that are common among the set of most active ligands, followed by the subtractive stage in which those pharmacophore candidates identified in the constructive stage and also present in more than half of the least. Indian Journal of Pharmaceutical Sciences. 693.
(6) www.ijpsonline.com. active ligands are removed; and the last step of optimization attempts to improve the score of the pharmacophore candidates that pass the subtractive stage by simulated annealing67. GASP60 and GAMMA78 are based on the genetic algorithm82 and also perform a conformational search as part of the GA run. Thus, molecular flexibility is simulated by generating multiple conformations of the given ligand followed by an exploration of different ways to align the molecules and to identify the pharmacophore pattern. In the last step of pharmacophore generation, candidates are scored and ranked. A lower score indicates a greater possibility that the model is a result of chance correlation. A detailed description of scoring methods implemented in techniques that relax the MCS requirements, and scoring in genetic algorithms like GASP and GAMMA is given in the literature59,67.. performed to find novel scaffolds of DNA gyrase inhibitors83. The ACD database of 350,000 compounds and a portion of the Roche compound inventory (RCI) were screened to obtain 150 weak inhibitors. These novel DNA gyrase inhibitors binding to the ATP-binding site have seven structurally different scaffolds. The optimization of the indazole scaffold provided a DNA gyrase inhibitor which was 10 times more potent than novobiocin. Sterol metabolism: Laggner and colleagues84 have reported pharmacophore models for three protein targets involved in sterol metabolism. Twenty-three structurally diverse molecules with binding affinity data for EBP (emopamil binding protein), ERG2 (fungal counterpart of EBP) and the sigma-1 receptor were used in the study to derive a pharmacophore model with the HypoGen module of Catalyst. These three enzymes of sterol metabolism share high affinity for various structurally diverse compounds. Three pharmacophore models with one positive ionizable group and four hydrophobic features in common but with different spatial arrangements were derived and validated. The study showed that the hydrogen-bonding interactions are not required for high-affinity inhibitor binding. The models were subsequently used to search the database [such as World Drug Index (WDI), Kyoto Encyclopedia of Genes and Genomes (KEGG) and COMPOUND database]. In virtual screening, the drugs that were reported previously to bind to one or several of these proteins were retrieved along with 11 new hits, which were then tested experimentally. Inhibitors with nanomolar binding affinity were discovered.. m rf o d ns a lo tio n a w c i As mentioned in the introductory section, VS by do ubl pharmacophore searching is more efficient when e P ). structural knowledge of the target receptor is available. e The receptor-based approach for pharmacophore fr w om generation involves analyzing features of the active siteor o f kn .c and the spatial relationship among them, and then an w active image of this is used to constructlethe d o b e pharmacophore model. Such an operation givesarise to a l toM dkn i large number of features, and it is necessary aparts bofythe e determine which of these are actually v a a 3Ddstructure.m pharmacophore. The method begins with s e a setwof i tand of the receptor (usually in PDB format) s ligands with known activity. Using F the information wof the o active site residues (from D biochemical or structural w h ( studies), a program such asP Ludi e(Accelrys Inc., USA) t is a complement of CAN ONE PROTECT KNOWLEDGEi generates an interactionismap which s h Thealigands with known activity BASED CONCEPTS? the receptor-bindingTsite. are used to identify the functional features such as H25,28. bond donors/acceptors and lipophilic groups from the interaction map in the active site. Often it is necessary to filter/limit the number of features since queries with multiple features may fail to retrieve any hits from the database. Therefore, 3D queries composed of fewer features are generated by considering all possible combinations. Catalyst57 uses these queries to search the ligand database.. SUCCESSFUL APPLICATION OF VS METHODS DNA gyrase inhibitors: A 3D database search using Ludi and Catalyst was 694. The answer is now YES. Though there are no patents yet of QSAR studies, the pharmacophores are being protected under Intellectual Property Rights. The credit for the first application of patenting such a knowledgebased concept goes to Biogen. In 1998, Biogen applied for a world patent of pharmacophores (WO 98/04913) in which all compounds derived from a 3D database search of the described pharmacophore were included. Peptor Ltd. filed a patent (US 6,343,257) that involves the development of a pharmacophore, its use in VS and use of the hits to design new compounds. Another patent of pharmacophores covers Hepatitis C NS3 protease inhibitors. This patent (WO 98/46630) claims all compounds that fit the pharmacophore model that in turn. Indian Journal of Pharmaceutical Sciences. November - December 2006.
(7) www.ijpsonline.com. represents the structure for inhibitors of Hepatitis C NS3 protease. Another patent filed for pharmacophores is US 2002/0013372 for the identification of CYP2D6 inhibitors.. ACKNOWLEDGEMENTS The support provided by the Department of Science and Technology (DST), New Delhi, through the FIST program (SR/FST/LS1-083/2003) is acknowledged with thanks; and the authors SAK and AKM thank the Council of Scientific and Industrial Research (CSIR), New Delhi, for Research Fellowships.. m rf o d ns a lo tio n a w c i do ubl e P ). e fr w m r fo kno .co le ed ow b la M dkn i a by e v a si ted w.m s w F o PD te h (w is si h T a. REFERENCES 1. 2. 3. 4. 5. 6. 7. 8.. 9. 10. 11. 12. 13. 14. 15. 16. 17. 18. 19. 20. 21.. 22.. 23. 24. 25.. 26. Head, R.D., Smythe, M.L., Oprea, T.I., Waller, C.L., Green, S.M. and Marshall, G.R., J. Am. Chem. Soc., 1996, 118, 3959. 27. Eldridge, M.D., Murray, C. W., Auton, T.R., Paolini, G.V. and Mee, R.P., J. Comput.-Aided Mol. Des., 1997, 11, 425. 28. Bohm, H.J., J. Comput.-Aided Mol. Des., 1992, 6, 61. 29. Gehlhaar, D.K., Verkhivker, G.M., Rejto, P.A., Sherman, C.J., Fogel, D.R., Fogel, L.J. and Freer, S.T., Chem. Biol., 1995, 2, 317. 30. Nissink, J.W.M., Murray, C., Hartshorn, M., Verdonk, M.L., Cole, J.C. and Taylor, R., Proteins, 2002, 49, 457. 31. Muegge, I., Perspect. Drug Des. Discov., 2000, 20, 99. 32. Mitchell, J.B.O., Laskowski, R.A., Alex, A., Forster, M.J. and Thornton, J.M., J. Comp. Chem., 1999, 20, 1177. 33. Ishchenko, A.V. and Shakhnovich, E.I., J. Med. Chem., 2002, 45, 2770. 34. Gohlke, H., Hendlich, M. and Klebe, G., J. Mol. Biol., 2000, 295, 337. 35. Pearlman, D.A. and Charifson, P.S., J. Med. Chem., 2001, 44, 3417. 36. Charifson, P.S., Corkery, J.J., Murcko, M.A. and Walters, W.P., J. Med. Chem., 1999, 42, 5100. 37. Stahl, M. and Rarey, M., J. Med. Chem., 2001, 44, 1035. 38. Wang, R.X. and Wang, S.M., J. Chem. Inf. Comput. Sci., 2001, 41, 1422. 39. Dixon, J.S., Proteins Struct. Funct. Genet., 1997, Suppl. 1, 198. 40. Ehrlich, P., Chem. Ber., 1909, 42, 17. Quoted by Ariens, E.J., Progr. Drug Res. 1966, 10, 429. 41. Gund, P., In; Pharmacophore Perception, Development and Use in Drug Design, Güner, O.F. Eds., International University Line (UIL) Biotechnology Series: La Jolla, 2000, 3. 42. Gund, P., Ann. Reports Med. Chem., 1979, 14, 299. 43. Gund, P., In; Progress in Molecular and Subcellular Biology, vol. 5, Hahn, F.E., Eds., Springer–Verlag, Berlin, 1979, 117. 44. Gund, P., Wipke, W.T. and Langridge, R., In; Proceedings of International Conference on Computers in Chemistry Research and Education, Elsevier, Amsterdam, 1974, 33. 45. Pearlman, R.S., Chem. Des. Aut. News, 1987, 2, 1. 46. Hiller, C. and Gasteiger, J., In; Software-Entwicklung in der Chemie, vol. 1, Gasteiger, J., Ed., Springer, Berlin, 1987, 53. 47. Wipke, W.T. and Hahn, M.A., Tetrahedron Comput. Meth., 1988, 1, 141. 48. Dolata, P.D., Leach, A.R. and Prout, K., J. Comput.-Aided Mol. Des., 1987, 1, 73. 49. Van Drie, J.H., Weininger, D. and Martin, Y.C., J. Comput.-Aided Mol. Des., 1989, 3, 225. 50. Sheridan, R. P., Nilakantan, R., Rusinko, A. III., Bauman, N., Haraki, K.S., Venkataraghavan, R., J. Chem. Inf. Comput. Sci., 1989, 29, 255. 51. Fisanick, W., Cross, K.P., Rusinko, A. III., J. Chem. Inf. Comput. Sci., 1992, 32, 664. 52. Kuntz, I.D., Science, 1992, 257, 1078. 53. Bartlett, P., Shea, G.T., Telfer, S.J. and Waterman, S., In; Roberts, S.M., Ley, S.V., and Campbell, M.M. Eds., Molecular Recognition: Chemical and Biological Problems, Royal Society in Chemistry, Cambridge, 1989, 182. 54. Christie, B.D., Henry, D.R., Güner, O.F. and Moock, T.E., In; Raitt, D.I., Ed., Online Information ’90, 14th International Online Information Meeting Proceedings, Learned Information, Oxford, 1990, 137. 55. Murrall, N.W. and Davies, E.K., J. Chem. Inf. Comput. Sci., 1990, 30, 312. 56. Hurst, T., J. Chem. Inf. Comput. Sci., 1994, 34, 190. 57. Sprague, P.W., In; De Novo Design, Müller, K., Eds., ESCOM Science Publishers, Leiden, 1995, 1. 58. Martin, Y.C., In; Classical and 3D QSAR in Agrochemistry, Hansch C. and Fujita T., Eds., American Chemical Society, Washington D.C., 1995, 318. 59. Barnum, D., Green, J., Smellie, A. and Sprague, P., J. Chem. Inf. Comput. Sci., 1996, 36, 563. 60. Jones, G., Willett, P. and Glen, R.C., J. Comput.-Aided Mol.. Dean, N.M., Curr. Opin. Biotechnol., 2001, 12, 622. Walters, W.P. and Murcko, M.A., Adv. Drug Deliv. Rev., 2002, 54, 255. Carr, R. and Jhoti, H., Drug Discov. Today, 2002, 7, 522. Hertzberg, R.P. and Pope, A.J., Curr. Opin. Chem. Biol., 2000, 4, 445. Walters, W.P., Stahl, M.T. and Murcko, M.A., Drug Discov. Today, 1998, 3, 160. Mestres, J. and Knegtel, R.M.A., Perspect. Drug Des. Discov., 2000, 20, 191. Mason, J.S., Good, A.C. and Martin, E.J., Curr. Pharm. Des., 2001, 7, 567. Srinivasan, J., Castellino, A., Bradley, E.K., Eksterowicz, J.E., Grootenhuis, P.D.J., Putta, S. and Stanton, R.V., J. Med. Chem., 2002, 45, 2494. MDL Information Systems, http://www.mdli.com. Cambridge Structural Database, http://www.ccdc.cam.ac.uk. Lipinski, C.A., Adv. Drug Discov. Res., 1997, 23, 3. Sadowski, J., J. Comput.-Aided Mol. Des., 1997, 11, 53. McMartin, C. and Bohacek, R.S., J. Comput.-Aided Mol. Des., 1997, 11, 333. Liu, M. and Wang, S., J. Comput.-Aided Mol. Des., 1999, 13, 435. Jones, G., Willett, P. and Glen, R.C., J. Mol. Biol., 1995, 245, 43. Morris, G.M., Goodsell, D.S., Halliday, R.S., Huey, R., Hart, W.E., Belew, R.K. and Olson, A.J., J. Comput. Chem., 1998, 19, 1639. Rarey, M., Kramer, B., Lengauer, T. and Klebe, G., J. Mol. Biol., 1996, 261, 470. ClauBen, H., Buning, C., Rarey, M. and Lengauer, T., J. Mol. Biol., 2001, 308, 377. Osterberg, F., Proteins Struct. Funct. Genet., 2002, 46, 34. Ajay, A. and Murcko, M.A., J. Med. Chem., 1995, 38, 4953. Cornell, W.D., Cieplak, P., Bayly, C.I., Gould, I.R., Merz, K.M., Ferguson, D.M., Spellmeyer, D.C., Fox, T., Caldwell, J.W. and Kollman, P.A., J. Am. Chem. Soc., 1995, 117, 5179. MacKerell, A.D., Bashford, D., Bellott, R.L., Dunbrack, R.L., Jr., Evanseck, J.D., Field, M.J., Fischer, S., Gao, J., Guo, H., Ha, S., Joseph-McCarthy, D., Kuchnir, L., Kuczera, K., Lau, F.T.K., Mattos, C., Michnick, S., Ngo, T., Nguyen, D.T., Prodhom, B., Reiher, W.E., III, Roux, B., Schlenkrich, M., Smith, J.C., Stote, R., Straub, J., Watanabe, M., Wiorkiewicz-Kuczera, J., Yin, D. and Karplus, M., J. Phys. Chem. B, 1998, 102, 3586. Dauber-Osguthorpe, P., Roberts, V. A., Osguthorpe, D.J., Wolff, J., Genest, M. and Hagler, A.T., Proteins, 1988, 4, 31. Jones, G., Willett, P., Glen, R.C., Leach, A.R. and Taylor, R., J. Mol. Biol., 1997, 267, 727. Bohm, H.J., J. Comput.-Aided Mol. Des., 1994, 8, 243.. November - December 2006. Indian Journal of Pharmaceutical Sciences. 695.
(8) www.ijpsonline.com. Des., 1995, 9, 532. 61. Cramer, R.D. III., Patterson, D.E. and Bunce, J.D., J. Am. Chem. Soc., 1988, 110, 5959. 62. Golender, V.E. and Vorpagel, E.R., In; Kubinyi, H., Eds., Drug Design: Theory, Methods and Applications, ESCOM, Leiden, 1993. 63. Li, H., Sutter, J. and Hoffmann, R., In; Pharmacophore perception, development, and use in drug design, Güner, O.F., Ed., International University Line (IUL), Biotechnology Series, La Jolla, 2000, 171. 64. Kurogi, Y. and Güner, O.F., Curr. Med. Chem., 2001, 8, 1035. 65. Güner, O.F., Curr. Topics Med. Chem., 2002, 2, 1321. 66. van Drie, J.H., Curr. Pharm. Des., 2003, 9, 1649. 67. Dror, O., Shulman-Peleg, A., Nussinov, R. and Wolfson, H.J., Curr. Med. Chem., 2004, 11, 71. 68. Glennon, R.A., Dukat, M. and Liao, L., Curr. Topics Med. Chem., 2004, 4, 631. 69. Crandell, C. and Smith, D., J. Chem. Inf. Comput. Sci., 1983, 23, 186. 70. Finn, P.W., Kavraki, L.E., Latombe, J.C., Motwani, R., Shelton, C., Venkatasubramanian, S. and Yao, A., Computational Geometry: Theory and Applications, 1998, 10, 263. 71. Clement, O.A. and Mehl, A.T., In; Güner, O.F., Ed., Pharmacophore perception, development, and use in drug design, International University Line (IUL): La Jolla, CA, USA, 2000, 69. 72. Dolata, D., Parrill, A. and Walters, W., SAR and QSAR in Environmental Research, 1998, 9, 53. 73. Holliday, J. and Willet, P., J. Mol. Graph. Model., 1997, 15, 221. 74. Ghose, A.K., Viswanadhan, V.N. and Wendoloski, J.J.J., Receptors and Signal Transduction, 2001, 21, 357. 75. Mayer, D., Naylor, C., Motoc, I. and Marshall, G.J., J. Comput.. Aided Mol. Des., 1987, 1, 3. 76. Takahashi, Y., Satoh, Y., Suzuki, H. and Sasaki, S., Anal. Sci., 1987, 3, 23. 77. Brint, A.T. and Willett, P., J. Chem. Inf. Comput. Sci., 1987, 27, 152. 78. Handschuh, S., Wagener, M. and Gasteiger, J., J. Mol. Model., 2000, 6, 358. 79. Bron, C. and Kerbosch, J., Communications of the ACM, 1973, 16, 575. 80. Kuhl, F.S., Crippen, G.M. and Friesen D.K., J. Comput. Chem., 1984, 5, 24. 81. Gardiner, E.J., Artymiuk, P.J. and Willett, P., J. Mol. Graph. Model., 1997, 15, 245. 82. Jones, G., In; Schleyer, P.V.R., Allinger, N.L., Clark, T., Gasteiger, J., Kollman, P.A., Schaefer, III, H.F., Schreiner, P.R., Eds., Encyclopedia of computational chemistry, John Wiley & Sons, Chichester, UK, 1998, 342. 83. Boehm, H.J., Boehringer, M., Bur, D., Gmuender, H., Huber, W., Klaus, W., Kostrewa, D., Kuehne, H., Luebbers, T., Meunier-Keller, N., Mueller, F., J. Med. Chem., 2000, 43, 2664. 84. Laggner, C., Schieferer, C., Fiechtner, B., Poles, G., Hoffmann, R.D., Glossmann, H., Langer, T., Moebius, F F., J. Med. Chem., 2005, 48, 4754.. m rf o d ns a lo tio n a w c i do ubl e P ). e fr w m r fo kno .co le ed ow b la M dkn i a by e v a si ted w.m s w F o PD te h (w is si h T a. 696. Accepted 2 November 2006 Revised 9 June 2006 Received 15 September 2005 Indian J. Pharm. Sci., 2006, 68 (6): 689-696. Indian Journal of Pharmaceutical Sciences. November - December 2006.
(9)
Figure
Related documents
An important question in managing patients with prior anti- NMDAR encephalitis concerns the duration of long-term monitoring after the initial episode to facilitate early
In this paper, ballast material typically employed in rail track bed construction has been characterized. Laboratory tests have been carried out over a methacrylate tank, which
The degree of resistance exhibited after 1, 10 and 20 subcultures in broth in the absence of strepto- mycin was tested by comparing the number of colonies which grew from the
Assessing the Impact of Biodiversity Conservation in the Management of Maize Stalk Borer (Busseola f
Field experiments were conducted at Ebonyi State University Research Farm during 2009 and 2010 farming seasons to evaluate the effect of intercropping maize with
There is a large variety of Imidazole ring containing derivatives which exhibit different kinds of pharmacological and biological activities and are being developed for
A multilevel voltage source inverter topology consisting of MLDCL and H-bridge inverter is based on minimization of switches, clamping diodes, or capacitors. Cascaded
100 patients with oral squamous cell carcinoma were investigated using molecular and Immunohistochemical detection for PTEN gene, their ages ranging from 33 to 89 years
