R E S E A R C H A R T I C L E
Open Access
Estimation of the friction force during the needle
insertion using the disturbance observer and the
recursive least square
Yuta Fukushima
*and Kiyoshi Naemura
Abstract
Needle insertion can be performed with the aid of an ultrasound (US) image. Detecting the position of a needle in a US image requires considerable technical expertise. To detect whether the needle has reached the target, the physician usually relies on physically sensing the amount of force being fed back from the tip of the needle to their fingertip. The goal of our research was to develop a force visualization system to assist physicians by providing them with a visual representation of the needle tip force. In this paper, we elucidated the characteristics of the force during the needle insertion, and designed the friction force estimation method. Needle tip force is difficult to estimate directly. The total insertion force acting on the needle was defined by adding the needle tip force to the friction force of the needle surface. Therefore, we proposed a method of estimating the change in the friction force by measuring the total insertion force during needle insertion using recursive least square method and a disturbance observer. The needle tip and friction forces were modeled on the basis of the results of in vitro experiments used pork back ribs. The experiments performed using the coaxial needle. This needle could measure the total insertion force and the needle tip force separately in real time. The validity of the designed estimator was evaluated by using the force values obtained by using a coaxial needle. As a result, the estimated friction force and measured friction force were found to be qualitatively consistent. However, a slight error was observed.
Keywords: Percutaneous therapy; Needle insertion; Modeling; Recursive least square; Disturbance observer
Background
Needle insertion is commonly used as a means of admin-istering medication or anesthetics, performing biopsies, and aspirating fluids. Certain needle insertion procedures, such as percutaneous ethanol injection and radiofre-quency ablation, are classified as types of minimally inva-sive surgery. If such procedures were performed without any image of the patient, however, human error may result in the insertion of the needle into an unintended target. Although needle insertion can be performed with the aid of an ultrasound (US) image, US images cannot be used for patients with large amounts of body fat. Furthermore, detecting the position of a needle in a US image requires considerable technical expertise. To detect whether the needle has reached the target, the physician usually relies
on physically sensing the amount of force being fed back from the tip of the needle to their fingertip. Detection suc-cess thus varies according to the degree of proficiency of the individual. Thus, it would be possible to improve the insertion accuracy if a visual representation of the needle tip force could be provided to the physician. The current study focused on the regions where the needle tip force changes sharply upon reaching a target, such as the cava, blood vessels, and cancerous tumors.
The forces acting on the needle tip include those gen-erated by cutting the tissue and the reactive force from the tissue [1]. Therefore, the needle tip force has been dif-ficult to estimate simply by considering the total insertion force. Rather, the needle tip force should be obtained by subtracting the estimated friction force from the total in-sertion force.
There have been several recent studies on force visualization during needle insertion. Okamuraet al. [1]
* Correspondence:[email protected]
Tokyo University of Technology, Graduate School of Bionics Computer and Media Science, Katakuramachi, Hachioji City 192-0982, Tokyo, Japan
and Simone et al. [2] elucidated, from an experiment using a cow liver, that the force acting on a needle can be modeled by summing the friction force, the cutting force, and the stiffness force. Kobayashi et al. [3] mod-eled the friction force based on the relative velocity be-tween the needle and the tissue through an experiment using a hog liver. The purpose of these studies was not to detect the penetration of the needle into the tissue; rather, the estimated force was compared with the mea-sured true value in real time. The friction force acting on the needle proved difficult to measure. Kataokaet al. [4] and Washioet al.[5] developed a coaxial needle con-sisting of an inner needle and outer sheath cannula. This needle could measure the total insertion force and the needle tip force separately in real time. The friction force could then be calculated by subtracting the measured needle tip force from the total insertion force.
The friction coefficient, stiffness, and damping coeffi-cient of living tissue change in real time. Carra et al. [6] proposed a model in which the total insertion force was decomposed into a stiffness force, friction force, and cut-ting force. This model could explain the sharp decrease in the total insertion force. However, they did not per-form an evaluation of the model using living tissue data. In a related study on the changes in the parameter esti-mates, Umeno et al. [7] proposed a method of estimat-ing the air pressure in tires by usestimat-ing the recursive least square (RLS) method and a disturbance observer. This method was capable of estimating changing parameters in real time. RLS is an adaptive filter with a low calcula-tion cost, and it is capable of estimating the coefficient quickly. Baurbeet al. [8,9] used RLS to produce a highly accurate model of the total insertion force. They did not, however, develop a method of separating the needle tip force from the friction force. Moreover, the evaluation produced by the model did not use the needle tip force and friction force that were measured in real time.
The goal of our research was to develop a force visualization system to assist physicians by providing them with a visual representation of the needle tip force. In this paper, we elucidated the characteristics of the force during the needle insertion, and designed the friction force estima-tion method. Needle tip force is difficult to estimate dir-ectly. Estimation of the friction force has an important implication to estimate the needle tip force. To estimate the friction force, we proposed a method of estimating the change in the friction force by measuring the total inser-tion force during needle inserinser-tion using RLS and a dis-turbance observer. The estimated friction force using the proposed method allowed us to determine the estimation accuracy, but raised problems when compared with the measured true value obtained with a coaxial needle. The novelty of this study was to elucidate the characteristic of the force during and after needle insertion.
Methods
Characteristics of the needle insertion force
Coaxial needle
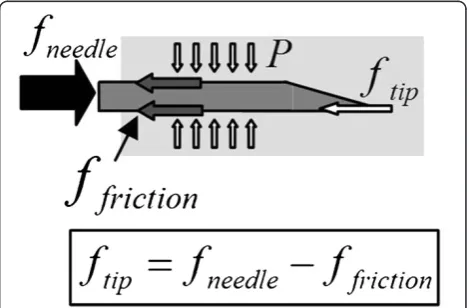
Figure 1 shows a pattern diagram of the force acting on a needle during its insertion. The total insertion force fneedle was defined by adding the needle tip force ftip to the friction force ffriction of the needle surface [4]. The friction force changed with variations in the pressure ap-plied to the needle by the tissue and the contact area be-tween the needle and the tissue [10]. To measure the force acting on the needle during insertion, the coaxial needle was developed as shown in Figure 2. The coaxial needle consisted of a 19 gauge inner needle (Safelet can-nula GA, Nipro Co., Japan) and a 16 gauge outer sheath cannula designed for this experiment. The force acting on the needle was measured by two force sensors. The needle tip force acting on the inner needle was mea-sured by a load cell TL3B09-50 N, (Tec Gihan Co. Ltd., Japan), and the total insertion force was measured by an-other load cell (LMC-21023, Nissho electric works Co. Ltd., Japan). The rated capacity of the force sensors was 50 N, and 100 N, respectively. The friction force was ob-tained by subtracting the needle tip force from the total insertion force. The designed coaxial needle included the error 1 N that is derived from experiment equipment.
Needle insertion experimental setups
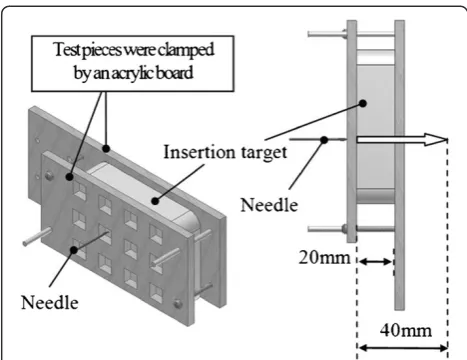
The experimental setups are shown in Figure 3. In the percutaneous needle insertion procedure, the needle penetrates skin, fat, and muscle as insertion targets. Pork back ribs were used, as their multiple fat and muscle layers made them appropriate for the study. As the nee-dle insertion targets, we prepared samples that were 20 mm thick. To minimize the effect of deformation, the test pieces were clamped by an acrylic board, as shown in Figure 4. The acrylic board was then mounted on the three axis stage, as shown in Figure 3. The coaxial needle was set on the motorized single axis stage (SGSP 26-100,
Sigma Koki Co. Ltd., Japan) and inserted into the test piece at a constant speed of 3.0 mm/s, in the same man-ner as in a former study [11]. The displacement was calcu-lated from the velocity value set for the motorized single axis stage. The force acting on the needle was recorded by a data recorder at a cycle of 800 Hz. Noise in the measured data was reduced by using the low pass fil-ter of the Matlab/Simulink software. The needle was moved by 40 mm, as shown in Figure 4, so as to puncture the test piece. The needle was first positioned on surface of the test piece, driven forward 40 mm until it emerged from the opposite side of the sample, and then stopped. The needle was inserted once into each test piece; nine in-sertions were performed.
Experimental results
Examples of the total insertion force, the friction force, and the needle tip force, as measured by the coaxial nee-dle, are shown in Figure 5. All the forces reduced sharply and repeatedly. The insertion process involves three phases: phase I (when the needle is in contact with the test piece but has not yet formed an indentation), phase II (while the needle is being inserted into the test piece), and phase III (after the needle emerges from the opposite side of the test piece). These phases are shown in Figure 5 as I, II, and III, respectively.
In phase I, the total insertion force increased non linearly until the needle penetrated the test piece. At that instant, the total insertion force was equivalent to the nee-dle tip force, and the friction force was zero. Also, the test piece surface was deformed by about 5 mm by the needle.
In phase II, the total insertion force waveforms exhib-ited several peaks. On the other hand, the needle tip force remained constant at 0.5 N while the total inser-tion force increased. The total inserinser-tion force decreased with needle tip force.
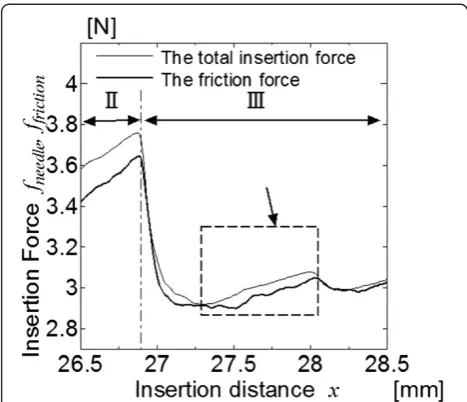
An expanded graph of phase III is shown in Figure 6. After penetration by the needle, the needle tip force be-came zero, and the total insertion force and friction force decreased. After penetration, friction force was the only force acting on the needle. Then, the friction force in-creased slightly, as indicated by the arrow in Figure 6. Figure 2Composition of the coaxial needle.
Figure 3Needle insertion experimental setups.
Figure 4Explanation for preparing test pieces.
Discussion
In phase I, the total insertion force increased non linearly until the needle penetrated the tissue surface. Funget al. [12] stated that the insertion force present until the instant at which the needle punctures the tissue surface was gen-erated by the viscoelasticity of the tissue.
In phase II, the total insertion force, the friction force, and the needle tip force repeatedly increased and de-creased. This can be explained by the fact that muscle tissue consists of fibers and bundles [13]. The needle in-sertion force increased while the muscle fibers deformed, and then fell as the muscular tissue ruptured. The needle tip force was a constant 0.5 N while the total insertion force increased.
In phase III, after the needle penetrated from the oppos-ite side of the sample, the friction force increased slightly. This phenomenon was not observed in phase II, because the needle cut the thin tissue in the beginning of phase III. In cutting the thin tissue, the needle was deformed the tis-sue. After penetration of the tissue, the tissue moved to the opposite direction of the needle.
Estimation of the friction force
Model of the insertion force
The needle insertion force should be modeled according to phase I, phase II, and phase III, as explained in the pre-vious chapter, the detection of each phase proved difficult. Phase II was essential because it included the instant at which the needle penetrates from the opposite side of the sample. We elucidated that the dynamic friction force in single layer tissue presented as a product of the pressure applied to the needle by the tissue, the dynamic friction coefficient, and the area of the needle touching the tis-sue [10]. We assumed that the effect of viscosity was
negligible in the current experiment. Heverly et al. [14] performed experiments to determine the velocity depend-ence of the needle tip force by using a porcine heart. We modeled the insertion force in single layer tissue of phase II as shown below.
fneedleð Þ ¼x m€xþsx_þμPdπxþω ð1Þ
where
ffrictionð Þ ¼x μPdπx ftipð Þ ¼x sx_ :
ð2Þ
Here, the mass of the needle was defined asm, the co-efficientμwas the dynamic friction coefficient, the
pres-sure P was applied to the needle by the tissue, the
diameterdwas the diameter of the needle, the vectorω was the disturbance vector which acted on the system, and the coefficient of the insertion speedswas the coef-ficient that defined how the needle tip force changed with the insertion speed. Equation (1) explains is the force acting on the needle inserted to the silicone. If equation (1) applies to pork back ribs, the disturbanceω includes the parameter variation from preset value of the equation (1). Umenoet al. [7] presented the param-eter variation estimation method using the RLS and dis-turbance observer as mentioned in introduction. In general the disturbance ω can estimate by the disturb-ance observer. The needle tip force was exhibited con-stant value, while the needle cut the tissue at the fixed speed as shown in chapter II. The variation value is only the friction force in equation (2) under fixed speed. Therefore, if the RLS and the disturbance observer were able to design, the friction force into pork back ribs under the constant insertion speed was able to estimate. In this paper, the disturbance observer was employed to estimate the disturbance ω, and the variation parameter ΔμPin equation (1) was obtained using the RLS.
Design of the disturbance observer
Equation (1) was deformed to the linear time invariant system, as follows.
d dt
x
_
x ¼
0 1
−μPdπ=m −s=m
x
_
x þ
0 1=m
λþ −10=
m
ω
ð3Þ
y¼½1 0x_
x : ð4Þ
ω that was the determining matrix for the disturbance invasion route were defined as
X¼ xx_
A¼ ‐μPd0π=m −s1=m
¼ A11 A12 A21 A22
B¼ 1=0 m
C¼½1 0
D¼ −10=m
¼ D11 D21
:
ð5Þ
Here, if the system changed, the disturbance Dω was included in the system noise and the fluctuation compo-nents. So, we designed the system to estimateω.
If the estimation speed of the observer was assumed to be sufficiently fast, equations (3) and (4) were deformed as extended systems expressing equations (6) and (7).
d dt x _ x ω 2 4 3
5¼ AA1121
0 A12 A22 0 D11 D21 0 2 4 3 5 xx_
ω 2 4
3
5þ 1=0m
0
2 4
3 5λ
: ð6Þ
Y¼½1 0 0
x _ x ω 2 4 3
5: ð7Þ
In the extended system, the state variable matrix Z, the system coefficient matrix M, the driven matrix N, and the output matrixOwere defined as
Z¼ x _ x ω 2 4 3 5¼ X
ω M¼ A11 A21 0 A12 A22 0 D11 D21 0 2 4 3 5 N¼ 0 1=m
0
2 4
3 5¼ B
0
O¼½1 0 0 ¼½C 0:
ð8Þ
Thus, we could design an observer to estimate the un-measured state and the disturbanceω.
There are several types of disturbance observer, such as a minimum order observer and a full order observer. In this study, we used a full order observer to compare the real state (xandx_) to the estimated stateX. The full order observer was designed as shown by equations (9) and (10).
_^
Z¼MZ^þNλþL Y −OZ^: ð9Þ
^
Y ¼OZ^: ð10Þ
Here, the matrix Z^ was the estimated value of stateZ, the coefficient L was the observer gain, and the matrix
^
Y was the estimated value of output equationY.
Design of parameter variation method using RLS
A parameter variation method was designed by applying the results of the study by Umenoet al. [7]. The general
state system was defined as shown below, including the inputλ, white noised, and the state variableX. The matrix AandBwere the foregoing matrixes in equation (5).
_
X ¼AXþBλþd: ð11Þ
If the parameter matrices A and B fluctuate, the sys-tem after fluctuation was given as
_
X ¼AXþBλþðΔAXþΔBλþdÞ
_
X ¼AXþBλþDω: ð12Þ
Here, the disturbanceDωwas defined as
Dω¼ΔAXþΔBλþd: ð13Þ
Thus, the parameter fluctuation and disturbance could be defined as being equivalent.
If the estimation speed of the observer could be as-sumed to be sufficiently fast, the disturbance Dω could be approximated as
Dω≅^ ΔAXþΔBλþd: ð14Þ
In the proposed model, the matrix ΔB becomes con-stant at zero. Thus, the matrixΔAand the stateX were defined, and equation (14) could be deformed as
Dω≅^ ΔAXþd ð15Þ
The RLS algorithm was applied to equation (15), and that was discredited. The RLS algorithm for estimating the parameter fluctuation was given by
H nð Þ ¼ 1
K H nð −1Þ−
H nð −1ÞX nð ÞXTð ÞnH nð −1Þ
KþXTð ÞnH nð −1ÞX nð Þ
ΔA n^ð Þ ¼ΔA n^ð −1Þ− H nð −1ÞX nð Þ
KþXTð ÞnH nð −1ÞX nð Þe nð Þ :
8 > > < > > :
ð16Þ
The H(n) was covariance matrix [15]. The predictive errore(n)was given by
e nð Þ ¼XTð Þn ΔA n^ð −1Þ−Dωð Þn: ð17Þ
Here, the matrixΔA^ was the changing estimated value of matrix A, Kwas the forgetting coefficient, and nwas the sample data number.
not be generated. Thus, in this study, we assumed that the parameter fluctuation related to the needle tip force was negligible, and that the fluctuating parameter could be attributed to the fluctuation of Pand μ. Figure 7 is a block diagram of the above. The disturbance observer estimated the disturbance and the state variable. The es-timated disturbance included the fluctuating parameters such as μ and P. The fluctuating parameters were esti-mated by RLS using the estiesti-mated disturbance. The ini-tial setting parameter included a measurement error. The proposed method compensated for this measure-ment error.
Simulation conditions
We evaluated the estimated friction force and the mea-sured friction force obtained with the coaxial needle. Simu-lation was performed using the Matlab/Simulink software. The initial parameter for the estimation method was set as shown in Table 1. Parameters obtained from a silicone rub-ber sample [10] were employed. To evaluate the robustness of the disturbance observer, the dynamic friction coeffi-cientμwas varied to one tenth of the base value 6.63. If the forgetting coefficientKfor RLS is set between 0.0 and1.0, the estimation system is insusceptible of the esti-mated pre value θ^ðn−1Þ, and is susceptible by noise. So, the forgetting coefficient Kwas set to 0.80. The pole of equation (3) was [-1.09 -89.3 0.00]T. The observer gainL should be set negative value than pole of equation (3) on the complex plane. The observer gainLwas set to [5.90 × 1031.14 × 107-1.74 × 10¹⁰]T. The pole of proposed method included observer was set to [-2.0 × 10³-2.0 × 10³-2.0 × 10³].
Results
Estimation results
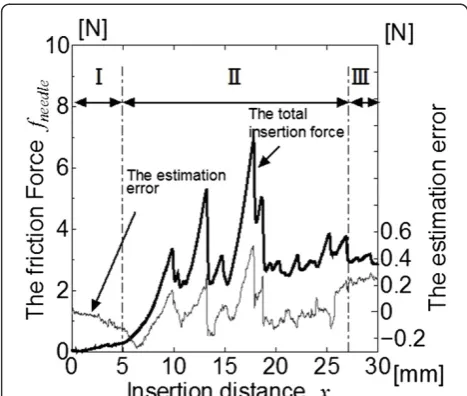
The results of the simulation are shown in Figure 8. The calculated needle tip force was obtained by subtracting the estimated friction force from the measured total in-sertion force. The estimation accuracy of the needle tip
force was determined by the estimated friction force. So, discussing the estimation accuracy of the needle tip force was identical with that of the estimated friction force. The three phases of needle insertion, as shown in Figure 5, are indicated by I, II, and III. In Figure 8, the friction force was qualitatively consistent, although a de-gree of error was observed. We defined the estimation error by subtracting the estimated friction force from the measured friction forces. The estimation error in-cluded the error 1 N that is derived from experiment equipment. The root mean square error (RMSE) was de-fined by
RMSE¼
ffiffiffiffiffiffiffiffiffiffiffiffiffiffiffiffiffiffiffiffiffiffiffiffiffiffiffiffiffiffi
1
b Xb
i¼1
^
Ffi−Ffi
2
v u u t
: ð18Þ
Here, the integer numberbwas the total number of the data, the data number was defined as i, the estimation value of the friction force was defined as F^fi, and the measurement value of the friction force by the coaxial needle was defined as Ffi. The estimation error and the total insertion force were shown in Figure 9. The average error, the maximum error and the RMSE in each phase were shown in Table 2 and Table 3 respectively. Here, to
Figure 8The simulation of the friction force.
Table 1 Initial value for the friction force estimation method during the needle insertion
Needle diameterd[m] 1.60 × 10⁻³
Needle massm[kg] 2.18 × 10⁻³
Dynamic friction coefficientμ 0.663 6.63
The Pressure of tissue to the needleP[N/m2] 63.7 × 10²
The coefficient of velocitys 197
obtain the RSL of each phase, the integer numbersb of each phase were set 1667 (x: 0.00 to 5.00 mm), 7300 (x: 5.00 to 26.9 mm), and 1034 (x: 26.9 to 30.0 mm), re-spectively. The maximum estimation error in phase II was -0.27 N. The average estimation error was -0.10 N. The estimation error increased in the negative direction immediately after the total insertion force fell sharply in phase II. The RMSE were increased in both phase II and phase III.
The estimation error whichμ was set to one tenth of the base value is shown in Figure 10. The result for the estimation error was completely consistent with the re-sults for the estimation error by the base value. The RMSE which μwas set to one tenth of the base value is shown in Table 3. The RMSE was also completely con-sistent with the result of the base value. Therefore, we found that changing the dynamic friction coefficient had no effect on the robustness of the disturbance observer.
Discussion
Discussion
The estimation error increased in phase I as shown in Figure 9. Phase I exhibited a characteristic in that the fric-tion force did not act on the needle, although the pro-posed method could not capture the characteristic of the friction force in phase I. Thus, the larger estimation error was observed.
In phase II, the total insertion force fell sharply as the muscle bundle was cut. The estimation error increased as the muscle bundle deformed, because the proposed method did not consider the characteristics of tissue deformation.
The friction force increased as a result of tissue relax-ation, the estimation error could be observed in phase III. We assumed that the estimation error increased as a result of the tissue deformation, because the estimation error increased in the negative immediately after the total insertion force decreased sharply. Thus, the estima-tion error increased in inserestima-tion phases II and III, espe-cially given that these phases included tissue cutting. The RMSE, indicating the dispersion from the true value, also increased in phases II and III. This means that the RMSE increases as a result of tissue cutting.
Changing the dynamic friction coefficient had no ef-fect on the robustness of the disturbance observer. Thus, the proposed method was robust to difference of initial parameter. This means that the velocity estimated by the disturbance observer was greater than the parameter changing velocity. If the observer gain changed, so too did the estimation accuracy.
In the future, we will enhance the proposed method by including the effect of tissue deformation and relaxation.
Figure 10The estimation error from the friction force simulation (μ: 6.63 × 1/10).
Table 3 The RMSE in each insertion phase
Phase RMSE [N]
μ: 6.63 μ: 6.63 × 1/10
I 0.07 0.07
II 0.14 0.14
III 0.24 0.24
Table 2 The estimation error in each insertion phase
Phase Average value [N] Maximum error [N]
I -0.05 -0.13
II -0.10 -0.27
III 0.24 0.29
Conclusion
The goal of our research was to develop a force visualization system to assist physicians by displaying the needle tip force. In this paper, the needle tip and friction forces were modeled on the basis of the results of our experiments. The validity of the designed estimator was evaluated by using the force values obtained by using a coaxial needle. As a result, both forces were found to be qualitatively consistent. However, a slight error was observed. In the future, to reduce this estimation error, we will design a system that considers the force resulting from tissue de-formation and characteristics of the insertion force.
Competing interests
The authors declare that they have no competing interests.
Authors’contributions
YF performed the needle insertion experiments, analyzed measured data, and drafted the manuscript. KN discussed results with YF and helped to draft the manuscript. All authors have read and approved the final manuscript.
Acknowledgment
The authors are grateful to Mr. H. Saito, Mr. T. Yamazaki and Mr. S. Nagatomo (UNISIS Corporation Japan) for their assistance in creating the outer sheath cannula. The authors also thank Dr. Y. Koseki of the National Institute of Advanced Industrial Science and Technology (AIST) for his advice on the coaxial needle.
Received: 14 January 2014 Accepted: 24 July 2014
References
1. Okamura AM, Simone C (2004) Force modeling for needle insertion into soft tissue. IEEE 51(10):1707–1716
2. Simone C, Okamura AM (2002) Modeling of Needle Insertion Forces for Robot-Assisted Percutaneous Therapy. IEEE international conference on robotics & automation, Washington, DC, USA
3. Kobayashi Y, Sato T, Fujie MG (2009) Modeling of Friction Force based on Relative Velocity between Liver Tissue and Needle for Needle Insertion Simulation. IEEE International conference on engineering in medicine and biology society, Hilton Minneapolis, Minnesota, USA
4. Kataoka H, Washio T, Chinzei K, Mizuhara K, Simone C, Okamura AM (2002) Measurement of the Tip and Friction Force Acting on a Needle during Penetration. In: 5th international conference on medical image computing and computer assisted intervention, vol 2488, Lecture Notes in Computer Science. Springer, Tokyo, Japan, pp 216–223
5. Washio T, Chinzei K (2004) Needle Force Sensor, Robust and Sensitive Detection of the Instant of Needle Puncuture. 7th international conference medical image computing and computer assisted intervention, Saint Malo, Flance
6. Carra A, Avila-Vilchis JC (2010) Mutilayer Needle Insertion Modeling for Robotic Percutaneous Therapy. 4th international conference on bioinformatics and biomedical engineering, Chengdu, China
7. Umeno T (2009) Parameter estimation by using disturbance observer. J Japan Fluid Power Syst Soc 40(3):169–173
8. Barbe L, Bayle B, Mathelin MD, Gangi A (2007) Needle insertion modeling: Identifiability and limitations. In: David F (ed) Proceedings of IFAC, France 9. Barbe L, Bayle B, Mathelin MD, Gangi A (2009) In vivo model estimation
and haptic characterization of needle insertion. Int J Robot Res 26(11):1154–1168
10. Fukushima Y, Saito K, Naemura K (2013) Estimation of the Cutting Force Using the Dynamic friction coefficient obtained by reaction force during the needle insertion. In: Mamoru M, Paolo B (eds) Proceedings of 1st CIRP international conference on BioManufacturing, Tokyo
11. Dimaio SP, Salcudean SE (2003) Needle insertion modeling and simulation. IEEE 19(5):864–875.
12. Fung YC (1993) Biomechanics: Mechanical Properties of Living Tissues. Springer, Berlin
13. Ushiki T (1989) Basic histology. Nankodo, Japan
14. Heverly M, Pierre D, Triedman J (2005) Trajectory Optimization for Dynamic Needle Insertion. IEEE International Conference on Robotics and Automation, Barcelona, Spain, 18-22 April 2005
15. Adachi S (2009) Basic of system identification. Tokyo Denki University Press, Japan
doi:10.1186/s40648-014-0014-7
Cite this article as:Fukushima and Naemura:Estimation of the friction force during the needle insertion using the disturbance observer and the recursive least square.ROBOMECH Journal20141:14.
Submit your manuscript to a
journal and benefi t from:
7 Convenient online submission 7 Rigorous peer review
7 Immediate publication on acceptance 7 Open access: articles freely available online 7 High visibility within the fi eld
7 Retaining the copyright to your article