R E S E A R C H A R T I C L E
Open Access
Graphical interface design for children seeking
information in a digital library
Ko-chiu Wu
1*, Yun-meng Tang
2and Cheng-yu Tsai
3Abstract
Background:Children are very curious. They like to play games but lack reading fluency. Conventional interfaces for information-seeking in digital libraries are unsuitable for children because they are rigid, text-based, and task-oriented. Thus, this study developed a customized interface for a digital library. To facilitate children in online searches, the design concepts included user-friendly target icons, icon recognition, and way-finding in a
two-dimensional visualized environment.
Methods:In this study, the criteria used to develop visualization tools that children can use for information retrieval were based on theories of human perception related to graphical interfaces for information visualization systems, including iconic representations and information density on visualized displays. Databases widely used by children in the National Library of Public Information were linked to the suggested database frame. The database frame was classified into five major subject categories: Natural Sciences, Fine Arts and Music, Health and Athletics, History and Culture, and Treasure of Knowledge. The web interface was designed according to way-finding concepts and map-structure hierarchies. Information searches in the main frame, sub-frames, and linked database were designed to be simple and intuitive for use by children.
Results:Information search efficiency was measured in 104 children assigned to search the virtual environment for icons (databases) that adequately supported their studies. Statistical analyses showed that, compared to the text-lined interface, the graphical interface improved the success and speed of searches by children.
Conclusions:Incorporating theories of spatial memory and representative icons in designs for visualized retrieval systems helps children to recognize different categories of knowledge content and improves their efficiency in information retrieval. To improve database search efficiency in children, information recommendation issues require further study. However, further research is also needed to identify factors that affect patterns of information-seeking behavior in children.
Keywords:Information seeking behavior; Emotional informational navigation; Child-computer interaction
Background
Information-seeking behaviors substantially differ between children and adults. In a comparison of web search pat-terns between children and graduate students, Bilal and Kirby (2002) found that the latter had markedly higher search effectiveness and markedly higher web navigation efficiency and quality. Graduate students were also more proficient in recovering from search related“breakdowns.” Therefore, current information-searching interfaces, which
are usually designed for adults, may be ineffective for children.
Many studies agree that, compared to adults, children have limited information seeking capability and require an improved web interface to help them overcome the information searching barrier. Kulper et al. (1997) found that most children aged 8–11 years cannot perform a search by author name. Other difficulties included spell-ing or phrasspell-ing search statements, applyspell-ing the search terms used in official subject headings, narrowing the search fields, and using Boolean expressions. Children also tend to stop searching after a few hits. Kulper et al. (1997) then concluded that, in databases designed for * Correspondence:[email protected]
1
Department of Interaction Design, Nation Taipei University of Technology, Taipei 106, Taiwan
Full list of author information is available at the end of the article
children, the icons used in the interface should have sim-ple and clear meanings and should be used as a bench-mark for orientating children in further searching. Kulper et al. (1997) further used SoftWare Technique for Evolu-tionary Participatory System development (STEP) to de-velop“BUCHERSCHATZ”(book treasure) and an OPAC prototype with a graphical user interface (GUI).
Hutchinson et al. (2005) studied the errors and frustra-tions that limit information-seeking effectiveness in chil-dren. For example, some children could not spell, type, read, navigate, compose queries, and/or select small ob-jects. The terms used in book searches differed between children and adults. Since children have difficulty manipu-lating and understanding conventional interface tools, their searching and browsing strategies often differ from those applied by adults. Based on this finding, Hutchinson et al. (2007) designed a category browser that uses Boolean queries, colorful icons, and a flat-structured, simultaneous-response interface to help children search for information in the International Children Digital Library (ICDL).
The Internet Public Library (IPL) is hosted by the College of Information Science & Technology at Drexel University. Drexel University also hosts the ipl2 FOR KIDs, which provides web-links to useful information for young users to do homework as well as leisure read-ing. Its nine search categories include Reference, Our World, Computer & Internet, Health & Nutrition, Read-ing Zone, Math & Science, Art & Music, Sports & Recre-ation, and Fun Stuff (Drexel University 2012).
Beheshti (2012) designed and tested a virtual informa-tion environment for children. The design of the virtual
library environment was based on the metaphor of a phys-ical library with rooms, bookshelves and books. Users can scan and open books on virtual shelves and can even use search stations to conduct conventional keyword searches. Book locations are identified by red dots on the floor plan for the virtual library.
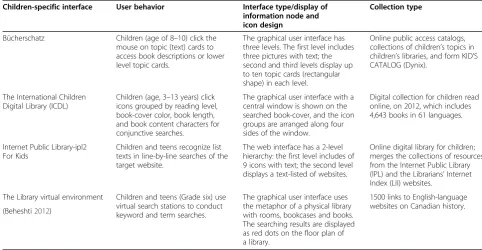
Most conventional information-seeking interfaces are ineffective for use by children because they are rigid, text-based, and task-oriented. In his classic study, Solomon (1993) examined four factors that affect the information retrieval behavior of children when the using online public access catalog (OPAC): user characteristics, school setting, interface usability, and information access features. In Table 1, four GUI information-seeking interfaces designed for children are compared in terms of user behavior, inter-face type/display of information node and icon design, and collection type. While these GUI interfaces were de-signed specifically for children, they require improvements in intuiting user behavior, categorizing information, and providing a game-like search environment. Therefore, this work presents a customized interface for a digital library with novel design concepts (i.e.,the avoidance of conjunc-tion syntax operaconjunc-tions and the use of icon recogniconjunc-tion, a user-friendly icon layout, a search-target avatar, and way-finding approach in a two-dimensional visualized environ-ment) to facilitate online searches by children.
Methods
A graphical interface for children seeking information contained in the National Library of Public Information (NLPI, renamed from National Taichung Library) database
Table 1 Comparisons of four GUI interface designed for children
Children-specific interface User behavior Interface type/display of information node and icon design
Collection type
Bücherschatz Children (age of 8–10) click the mouse on topic (text) cards to access book descriptions or lower level topic cards.
The graphical user interface has three levels. The first level includes three pictures with text; the second and third levels display up to ten topic cards (rectangular shape) in each level.
Online public access catalogs, collections of children’s topics in children’s libraries, and form KID’S CATALOG (Dynix).
The International Children Digital Library (ICDL)
Children (age, 3–13 years) click icons grouped by reading level, book-cover color, book length, and book content characters for conjunctive searches.
The graphical user interface with a central window is shown on the searched book-cover, and the icon groups are arranged along four sides of the window.
Digital collection for children read online, on 2012, which includes 4,643 books in 61 languages.
Internet Public Library-ipl2 For Kids
Children and teens recognize list texts in line-by-line searches of the target website.
The web interface has a 2-level hierarchy: the first level includes of 9 icons with text; the second level displays a text-listed of websites.
Online digital library for children; merges the collections of resources from the Internet Public Library (IPL) and the Librarians’Internet Index (LII) websites.
The Library virtual environment Children and teens (Grade six) use virtual search stations to conduct keyword and term searches.
The graphical user interface uses the metaphor of a physical library with rooms, bookcases and books. The searching results are displayed as red dots on the floor plan of a library.
is developed by applying a user-centered design concept. First, literature review is performed to determine how chil-dren use information node layouts and icon representation-related topics, which are essential for effective use of a visualized database and its spatial arrangement. Five design guidelines for the information-seeking interface are then established: (a) providing children with an effective way-finding approach to searching information nodes in a vir-tual environment, (b) allowing gradual access to the graphic display by spreading out the search targets in an extended virtual reality environment, (c) using icons based on simpli-fied images relevant to the experience of children to allow them to perceive the actual meaning of the database con-tent, (d) integrating both text and relevant images into an icon to represent a database in a digital library to help chil-dren recognize its content, and (e) establishing a game-like information search environment that children would enjoy using for information search rather than a work-like and classroom-like machine interface.
The interface prototype is then implemented using the cognitive walkthrough method, which is widely used to develop digital libraries for children, to study educational development in children, and to categorize and visualize information. Based on expert suggestions in each develop-ment step, the scope of the database searches are designed to meet the requirements of children completing school homework and leisure reading assignments. Icons are also designed for five different databases categories: Natural Sciences, Fine Arts and Music, Health and Athletics, His-tory and Culture, and Treasure of Knowledge. Finally, Flash software is used to embed all icons in a left-right-extended interface prototype so that users can perform search tasks in experimental tests of interface usability.
Information visualization and density
Although children enjoy searching through icons in play-oriented information visualization interfaces to re-trieve information, several topics related to information visualization and iconic representation in GUI design need further study. Shneiderman (1997) reported that the development of window management interfaces should prioritize information visualization and user in-terfaces. Since the literacy skills of children improve slowly before adolescence, the use of search strategies that combine text with images vary by age. Therefore, information systems require interfaces with improved visual communication properties, including iconic rep-resentation and arrangement (metaphor), to help chil-dren during the information-seeking process.
Hu et al. (1999) suggested that interface design may substantially affect system–user concept communication, regardless of user familiarity with the search task; for facilitating such communication, they also reported that a GUI is more effective than a list-based design. For
supporting concept communications, interfaces that in-corporate multiple visual properties may be more effect-ive than those that rely excluseffect-ively on visual properties. Although using graphical interfaces and text-based linear lists incur similar cognitive loads, graphical interfaces re-portedly provide higher user satisfaction. The import-ance of user satisfaction with the interface increases in designs with multiple visual properties. Improvements in interface-induced system-user concept communication may increase with the number of system-suggested items but decrease with user task familiarity. Further, differ-ences in size and distance may provide many effective and essential visual cues in system–user concept commu-nication whereas differences in color provides relatively less effective visual cues for such communication support. The findings of Hu et al. (1999) regarding the visual prop-erties that help users communicate with information systems motivated this study of a novel two-dimensional spatial-organized interface for information systems to help children perform search tasks.
Shneiderman (2003) stated that an object can be char-acterized by using some aspects of the data in the object to indicate its position. Koshman (2006) reviewed the literature on visualization systems used for information re-trieval. She analyzed iconic representations and informa-tion density in visual displays. Whereas concepts from human perception theory, including proximity, closure, and connectivity, are applicable in graphical displays (e.g., user overviews of large collections in a digital database on limited-scale displays; how collections (presented as sym-bols), an improved understanding of how information density can be organized into different layouts and level structures to help users identify the structural contents (metaphors) of a database and to obtain accurate search results that can be presented on a screen.
In the first version of the ICDL, Reuter and Druin (2004) reported that elementary school students preferred navigating digital libraries hierarchically (less cognitive load) instead of by using Boolean searches. Hutchinson et al. (2007) redesigned the category browser by using simultaneous menus to allow book searches within minor hyperlink levels (less memory load). Compared to a multi-level hyperlink structure, a board and extended plan struc-ture allows children to search a virtual reality environment more efficiently and without getting lost. Thus, the second design guideline is to distribute the search targets in an extended virtual reality environment so that children can search targets as they gradually move across the graphic display (background). This approach provides visual cues that help prevent children from getting lost in a sectional, breakdown condition. If the user reaches the wrong node, the cues in the virtual environmental help the user find the original path and find the nodes with simi-lar meanings.
Iconic representations
Users must apply information visualization tools to in-terpret and decode icons and to judge whether the re-trieval results are useful. According to Koshman (2006), p.205, a weakness of the web visualized tool is its pos-sible arbitrary assignments of iconic representations to databases with inappropriate content. Even if the map metaphor helps users navigate and identify location param-eters, it may not enable them to retrieve desired informa-tion represented with meaningful icons. Since the ICDL was developed for English speakers, Bilal and Bachir (2007) stressed the importance of the‘design representations’and ‘meaning’ of information for non-native English-speaking children who use ICDL. They also reported that older children perform book-searching tasks more efficiently than younger children do. Their objective was to incorpor-ate the meanings and representations of icons in a child-friendly visual interface for information search.
Hu et al. (1999) described the visual properties that im-prove communication between users and information sys-tems but recommended further study of contextual and emotional issues. Bates (2002) addressed contextual issues related to interface design and reported that an adequate design requires a clear understanding of cascade interac-tions between the user and system and that each system requires a different interface. Bilal (2001, 2002) suggested that emotions can profoundly impact the overall effective-ness of children in using a Web search engine to perform assigned and fully self-generated search tasks. Several studies have assessed systems that communicate effect by incorporating emotionally expressive computer agents. Leide et al. (2003) mapped the search process used by domain-novice users in a visualized IR system and applied benchmark (lighthouse) concept index user knowledge
boundaries in classification-based visualization schemes. Tzeng (2004) examined the effects of text and emoticons used to express sympathy for failures in computer games and reported that apologetic (sad) emoticons communi-cate emotions more effectively compared to pure text. Brave et al. (2005) studied how emotionally expressive computer agents affect the perceptions of players during computer games. Participants perceived empathetic agents as likeable, trustworthy, supportive, and beneficial. In addition to reviewing some of the human perceptual theories underlying graphical interfaces for information visualization systems, Schmidt and Stock (2009) applied a similar method of using tags to express basic emo-tions such as anger, disgust, fear, happiness and sadness in images.
Whereas most related studies have attempted to use standardized abstract-format icons and even text to rep-resent important meanings in a visualized system, chil-dren generally ascribe meanings to symbols based on actual objects in their environment. For children, learn-ing a new set of visualized symbols is harder than identi-fying images they observe in daily life. Thus, the third design guideline is using icons based on simplified im-ages relevant to the experience of children to allow them to perceive the actual meaning of the database content.
Morse et al. (2002) compared visual information re-trieval methodologies that used textual, iconic, graphical, and“spring”displays and found that the textual interface provided the highest user performance (p. 35); for the most complex tasks, however, graphical methods (icon, graphs,“spring”) were superior. In Heo and Hirtle (2001), a study of how users process large quantities of informa-tion presented in a graphical interface revealed that the “expanding outline” is the most effective presentation. Icons, whether they are text or images, may help children of varying age and of varying literacy understand the meaning of an icon. Therefore, the fourth design guideline is to use both text and images as icons to help children understand the content of a digital library.
Figure 1The NLPI text-based interface for children digital library.
Table 2 NLPI databases linked to icons
Category Icon name Linked database–Window frame Natural
Sciences
Exploring Ecology
Taiwan Amphibious Reptile Video Database
Taiwan Ecology Notebook Database
Taiwan Fish Learning Knowledge Database
Taiwan Bird Video Database
Insect Picture Encyclopedia
Taiwan Marine Ecology Video Databese
Airiti Nature
Newton kids Digital Museum
Compendium of Materia Medica
Form of Different Animal
Science Knowledge
Copernicus 21 Sciences Knowledge Database
The Scientist Magazine Chinese-English Knowledge Database
Science Experiments
Newton Textbook-Nature Science Learning Treasure(Experiments)
Fine Arts & Music
Performance Arts
Opera in Video, Alexander Street Press Online Products
Visual Arts Paper Festival Series - Interactive Multi-Media Net Database
Tsai Chih-Chung Caricature and Animation Database
Chinese Poem Database
Smithsonian Theatre in Video, Alexander Street Press Online
World Fine Arts Database(ART)
Collection of Historical Calligraphy
Music Cultural Sound-Picture Digital Database(Muzimax)
Health & Athletics
Athletics The International Athletic and Competition Animation Special Reports
Human and Food
Compendium of Materia Medica
Food, Culture and Management Database
Taiwan Food Culture Database
History & Culture
Native Inhabitants
Taiwan Who’s Who in The Present Age
Taiwan People(1895–1945)
Biographical Literature
Historical Buildings
Chinese Historical Building Database
Taiwan Historical Building Learning Database
The Palace Museum On-Line Database
The Palace Museum Hertreasure Database
Table 2 NLPI databases linked to icons(Continued)
Taiwan History Taiwan Hundreds of Events Database,
Dictionary of Taiwan History
Taiwan Chronicle
Taiwan Memorabilia Database
Taiwan History Knowledge Database
Taiwan Daily Newspaper Database (Chinese, 1905–1911)
Taiwan Daily Newspaper Database (Chinese, 1898–1944)
Taiwan Origin-Seeking Database
Taiwan Documentation Serious of Books(Doc & Index)
Taiwan Documentation Serious of Books(Image)
Taiwan Documentation Serious of Books(Digital) Social Knowledge Law Bank Info-Cip Credit On-Line
CNS Online Service
Ttsweb CLISA(1995–2005)
Taiwan Native Learning Database
Treasure of Knowledge
English Reading Collection
Netlibrary eBook
Tumble Talking Books
Tumblebook
Ebrary
AMC‐GEPT
MC‐NEW TOEIC
Oxford English Dictionary Online
Wiley eBook
Taiwan News Online
English DNA
Smithsonian Theatre in Video, Alexander Street Press Online
Chinese Literary Allusion
Wenhsun Magazine 200 Digital Library
Jin Yong’s Works Database
Dr.Chinese
Old Teacher E-Learning Idiom-Caricature Database
Chinese Poem Database
Online Chineseall
L&B Digital Library
Apabi eBook
Koobe eBook
Superstar Digital Library
According to the Gibson Affordance Theory, humans perceive possibilities (affordances) for action in order to operate in the environment. Perception is designed for action. Yu (2012) explained that visual perception affects
how children categorize and narrate information. A visual interface design that children can use effectively for searching information must include appropriate affor-dances to simplify the task. According to a study of information-seeking behavior by Shenton & Dixon (2004), children tend to spend minimum effort to find sufficient information, they apply the same method repeatedly for a special information need, they select the search strategy at the point of need, and they apply untaught, expedient information-seeking methods. Thus, we argue that an ef-fective visualized searching interface must enable repeated use of simple search strategies and must enable intuitive way-finding to the right information node in an extended virtual reality environment. Paivio (2006) introduced the dual-coding theory that visual and verbal information are processed differently and along distinct channels in the human mind. Thus, we argue that the iconic representa-tions and the layouts of visual displays are critical for helping children to interpret and choose correct icons (information nodes) in different visual and textual forms to meet children recognition and living experiences. Most importantly, the visualized interface stimulates at-tracts the interest of the user.
Interface prototype development
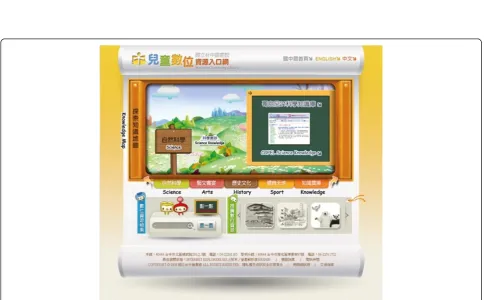
This study developed a set of guidelines for using an icon-searching interface and a spatial-linked structure for On-line Databases used in the NLPI for Children. The core concept is to present the meaning searching process as a treasure-hunting game by using the virtual reality tool to create a graphical interface prototype, which children can use to search for information databases (icons) in the virtual reality environment. Since NLPI is responsible for information services used by children in Taiwan public li-braries, it collects many digital databases used by children. Given the many digital libraries established for children worldwide, the NLPI also plans to establish a user-friendly interface for a digital library for children in Taiwan. Not-ably, the original text-based interface (Figure 1) for the NLPI digital library for children has already been changed to a graphical interface (Figure 2). The proposed interface has a two-dimensional virtual space that integrates differ-ent icons connected to differdiffer-ent databases. After receiving approval from the service librarians and NLPI director, this study identified the databases that children typically use for general search (Table 2).
Figure 3 shows how the extended graphical interface uses icons to represent databases linked to the NLPI. Examples of databases include Copernicus 21 Sciences Knowledge database, Taiwan Amphibious Reptile video database, Taiwan Ecology Notebook database, etc. Based on guidelines 1 and 2, this study developed an extended visualized environment with icons representing different Table 2 NLPI databases linked to icons(Continued)
Chinese Electronic Periodical Services(CEPS)
China Academic Journals Full-Text Database(CJFD)
Encyclopedia Gujin Tushu Jicheng, Imperial Encyclopedia
Holidays eBook
British Encyclopedia On-Line Chinese Version
Chinese Encyclopedia Database
Wiley eBook
Taiwan eBook Academia
Siku Quanshu, Emperor’s Four Treasuries
Discovery Digital Curriculum Teaching Video Database
Newspapers Magv Online Magazine
Taiwan Panorama Magazine Chinese-English Database(2005)
Newspapers in Taiwan
China Daily News Database
Central Daily News Database
United Daily News
Newspaper Title Index Database
China Times Database(1991–1999)
China Times CD
Taiwan Times Database
Udndata.Com
Acer Walking Library
Taiwan News Online
English DNA Bi-Linguistic -Teaching Post
Children Story Collection
Book Teller
GURAU BEAR E-Picture Books
Little Kiss Digital Book
Charng-Jinn Multi-Media Digital Book
The Sound-Picture On-Line For K-9 Digital Learning Curriculum
Native Language
Taiwan Word Dictionary Database
Examinations ITEMS National Examination Database
Chinese Electronic Theses and Dissertation(CETD)
databases to enable children to search for information without getting lost in multiple hyperlink hierarchies.
Concepts of way-finding and map-structure hierarchy were applied in the design of the graphical interface. Since children can typically conceptualize only seven egories, the databases were divided into five subject cat-egory groups - Natural Sciences, Fine Arts and Music, Health and Athletics, History and Culture, and Treasure of Knowledge, which are the subjects included in the pri-mary school curriculum. For example, the Natural Sci-ences category group contained three lower-level icons: Science Knowledge, Exploring Ecology, and Sciences Ex-periments. Each lower-level icon was then linked to several databases, and each database was presented in a separate window frame (Table 2).
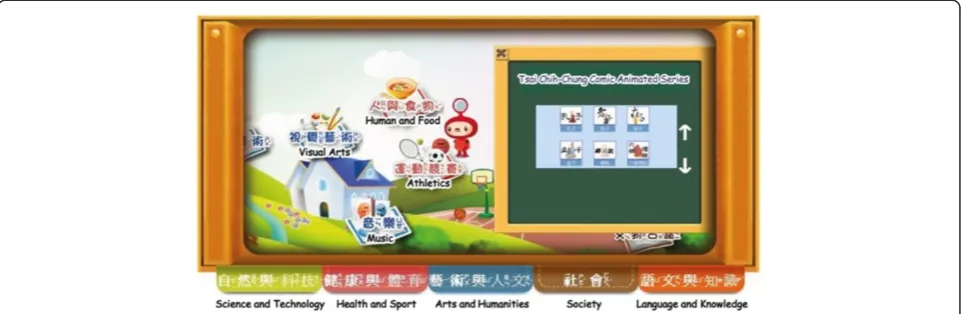
To search for information in the designed mainframe, the user moves the cursor (the spaceman) right or left (Figure 4) in the map to select an icon that represents a category. When the user clicks on the icon for the chosen database, a small window frame presents the detailed content of the database. Figure 5 displays how the up and down arrows can be used to navigate through different window frames to the target database. A video demonstrating how children use the proposed graphical interface for information search is available
online (https://www.youtube.com/watch?v=WDLWYfOpg 5Y&feature=youtu.be).
Human perceptual theory, which underlies the develop-ment of graphical interfaces of information visualization systems, was applied in the design of the interface by using iconic representations that are easily recognized by children. Since simplified images relevant to the experi-ences of children enables them to recognize the database content, 19 images were selected (Figure 6). For example, visual arts are represented by paint brushes and color plates; Taiwan history is represented by the national flag.
The icons comprised images associated with the text and phonetic notation in order to help children recognize the database content. Since skills such as literacy, image recognition, and information searching develop at differ-ent rates, most children use an integrated method to de-duce the content of various databases.
Results and discussion User-oriented evaluation
Genuis (2004) categorized usability evaluations as expert-oriented or user-expert-oriented. Users do not participate in the process applied by experts to assess usability. Therefore, the expert-oriented assessment process eventually causes a mismatch between assessment results and actual user
Figure 3Extended graphical design for the interface of NLPI children digital library.
conditions. In the user-oriented evaluation process, re-searchers collect data when users are performing tasks. However, since the assessment results in this study need to be consistent with the usability requirements, this work also applied the Usability Testing method of user-oriented evaluation to investigate how children use the designed graphical interface and the original text-based interface. While the children performed search tasks on the assigned interfaces, the researchers recorded their behavior in each step. Finally, the researchers analyzed the users in terms of success rates, operating speeds, and satisfaction to improve the interface usability (Rubin 1994).
Figure 7 shows the relationships among the evaluation factors, including children (user) characteristics, searching interfaces, and interface usability. Children characteristic includes grade (age) and computer usage. In a study of interaction design for children, Hourcade (2007) described visual acuity in static and dynamic (moving objects) set-tings. Static visual acuity rapidly improves from ages 5–7 years and from ages 9–10 years and is usually mature by age 10 years. Dynamic visual acuity similarly improves until ages 11 and 12 years. Thus, the selected age distribu-tion of the sample was age 7 to 11 years. While experts suggest 30–45 minutes of free play for elementary school children with extra time allotted for school work (Matte 2014), this research defined heavy and light computer usage as more than 4 hours per week and less than 4 hours per week, respectively.
The searching interface includes the original text-listed interface and the suggested graphical interface. Interface usability was evaluated in terms of success rate and op-erating speed. Success rate was defined as the proportion of children who reached the target icon in a test divided by the total number of children assigned to the group. Op-erating speed is defined as the time children required to complete each task. The graphical interface incorporating visual memory and iconic representation into visualized
retrieval systems clearly helped the children recognize dif-ferent categories of knowledge content. However, further statistical confirmation of improved information searching efficiency is needed.
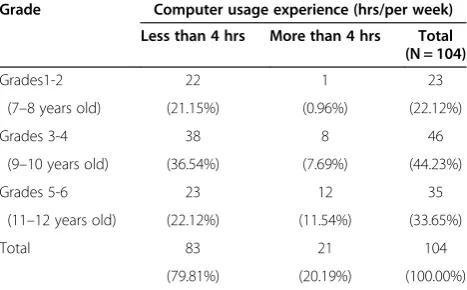
Experiment and sampling
The experiment was performed at the NLPI. The 104 students were randomly divided into two groups in order to compare the original NLPI text-based inter-face and the graphical interinter-face prototype in terms of interface usability. Table 3 shows that 23 students were in grades 1–2, 46 were in grades 3–4, and 35 were in grades 5–6. Additionally, computer usage experience was classified as light (less than 4 hours per week) in 83 students and heavy (more than 4 hours per week) in 21 students.
Before beginning the experiment, the instructor dem-onstrated the operation of the interface to each child in the two groups and then introduced two tasks sequen-tially. The children were required to complete the task in 90 seconds and to inform the instructor after com-pleting each task so that the instructor could record their times. The following two information search tasks were used in the experiment.
You encounter a problem while doing homework and your instructor tells you to search the online Taiwan Historical Dictionary database. You are now trying to find this database.
The second task was as follows:
Search the green sour bear picture books database after school to find books for leisure reading.
Hypotheses for interface comparison
The graphical interface and the original text-based inter-face were compared in terms of success rates and operat-ing speeds for information searches. As the children were
divided randomly to avoid interference between sequential operations performed by each group, Pearson chi-squared test was used to compare success rates between the two interface groups. Two-way analysis of variance was applied to examine the influence of two categorical independent variables (grade-interface or computer usage-interface) on one dependent variable (operating speed). We hypothe-sized the following:
H1: Regardless of grade, success rates for search tasks differ between the two interfaces.
H2: Regardless of grade, children who successfully complete the information search tasks use the two inter-faces at different operating speeds.
H3: Regardless of computer usage experience, success rates for search tasks differ between the two interfaces.
H4: Regardless of computer usage experience, children who successfully complete the information search tasks use the two interfaces at different operating speeds.
Comparison of grade levels
Table 4 shows the task 1 results. Performance signifi-cantly differed between the original text-based interface and the graphical interface in all grade levels (grades 1–2 (**p= .006 < .01); grades 3–4 (***p= .000 < .001); grades 5–6 (**p= .003 < .01)). Regardless of grade, suc-cess rates for task 1 were higher for the graphical inter-face than for the original text-based interinter-face. Success
rates for task 2 also significantly differed between the original text-based interface and the graphical interface in all grade levels (grades 1–2 (***p= .000 < .001), grades 3–4 (***p= .000 < .001), and grades 5–6 (***p= .000 < .001)). In task 2, success rates were higher in all grades of chil-dren who used the graphical interface than in those who used the original text-based interface. Hypothesis H1 is thus validated.
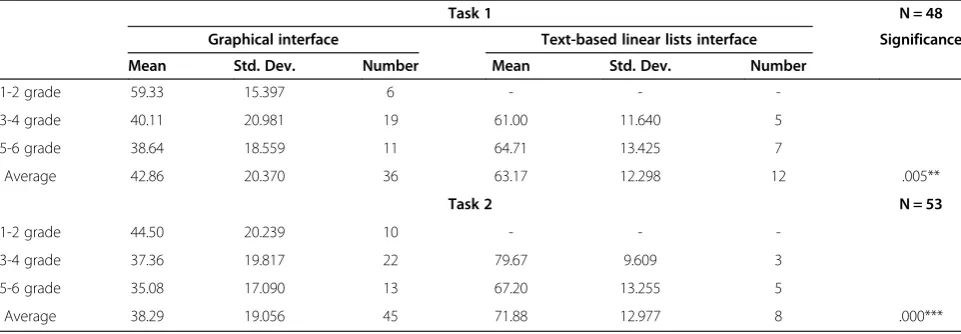
Regardless of grade, children who successfully completed the information search tasks used the two interfaces at dif-ferent operating speeds. Table 5 shows that, regardless of grade, success in completing task 1 significantly differed (**p= .005 < .01) between the original text-based interface and the graphical interface. Regardless of grade, successful completion of Task 2 also significantly (***p = .000 < .001) differed between the original text-based interface and the graphical interface. In all grades, the average operating speed (time required to complete the task) when using the graphical interface was faster (shorter) than that using the original text-based interface. Hypothesis H2 is thus validated.
Comparison of computer usage experience
Table 6 shows that success in completing task 1 signifi-cantly differed between the original text-based interface and the graphical interface in students with light com-puter usage experience (***p= .000 < .001) and in those with heavy computer usage experience (*p= .011 < .05). Regardless of computer usage experience, success rates for task 1 were higher in students who used the graphical interface than in those who used the original text-based interface. Success in completing task 2 significantly dif-fered between the original text-based interface and the graphical interface in students with light computer usage experience (***p= .000 < .001) and in those with heavy computer usage experience (**p= .005 < .01). Regardless of computer usage experience, success rates for task 2 were higher in students who used the graphical interface than in those who used the original text-based interface. Hypothesis H3 is thus validated.
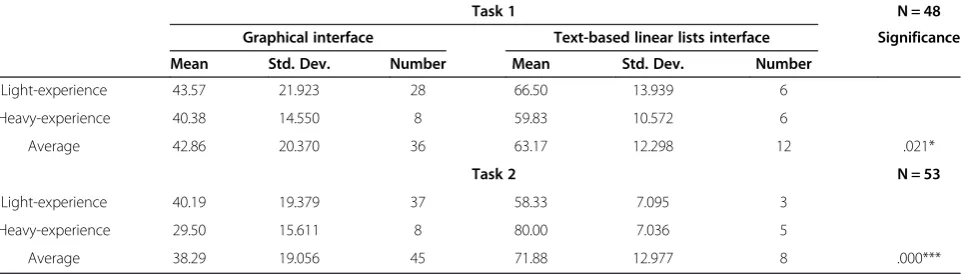
At all computer experience levels, the children who successfully completed the information search tasks used the two interfaces at different operating speeds. Table 7 shows that success in completing task 1 significantly differed (*p= .021 < .05) between the original text-based interface and the graphical interface, regardless of com-puter experience. Similarly, success in completing task 2 significantly (***p= .000 < .001) differed between the ori-ginal text-based interface and the graphical interface, regardless of computer experience. Finally, the average operating speed (time) required to use the graphical interface was faster (shorter) than those required to use the original text-based interface regardless of computer usage experience. Hypothesis H4 is thus validated.
Children Characteristics Searching Interfaces Interface Usability
Grade Graphical
Text-based lists
Success rate
Operating speed Computer usage
experience
Figure 7Relationships among experimental factors used to test children with different characteristics.
Table 3 Samples in grade and computer usage experience
Grade Computer usage experience (hrs/per week)
Less than 4 hrs More than 4 hrs Total (N = 104)
Grades1-2 22 1 23
(7–8 years old) (21.15%) (0.96%) (22.12%)
Grades 3-4 38 8 46
(9–10 years old) (36.54%) (7.69%) (44.23%)
Grades 5-6 23 12 35
(11–12 years old) (22.12%) (11.54%) (33.65%)
Total 83 21 104
This study elucidates information-seeking behavior of children and compares their navigating experience in each interface. The statistical data obtained in compari-sons of success rates and operating speeds contribute to efforts to develop an improved interface for emotional information retrieval. The children also had different com-ments and complaints about the two interfaces. Typical complaints about the text-based interface included of difficulty finding the right keywords, difficulty typing, diffi-culty reading the small font, the high complexity of the interface, and the ease of performing the wrong operation. In contrast, the children commented that the images used in the graphical interface were attractive and that its icons were organized consistently with the curriculum structure and were associated with phonetic notation, which en-abled easy use of trial-and-error methods without break-down after a failed search.
Differences between children and graduate students Bilal and Kirby (2002) compared information-seeking be-havior between children and graduate students using Yahooligans. They found that graduate students employed
advanced search syntax, but the children did not; graduate students applied a“linear or systematic”browsing style to locate information whereas most children had a “loopy” style; graduate students made fewer Web moves, used fewer hyperlinks, and made fewer backtracks than chil-dren did; graduate students did not deviate from any designated targets whereas most children did; graduate students could quickly recover “breakdowns” in key-word searches whereas children could not.
Since the graphical interface improved the effective-ness of information searches by children, this study fur-ther evaluated the interface in graduate students. In two tests performed in six graduate students, the average time needed to complete task 1 was 29.67 seconds (range, 13 to 83 seconds), and the average time needed to complete task 2 was 33.83 seconds (range, 22 to 48 sec-onds). The graduate students tended to view each icon quickly and sequentially to find the first target (online Taiwan Historical Dictionary of databases), and they tended to remember the icons they reviewed. In task 2 (finding green sour bear picture books database), all stu-dents were confused about the meaning of recently viewed Table 4 Comparisons of success rates between graphical interface and text-based linear lists interface
Task 1 N = 104
Graphical interface Text-based linear lists interface Significance
Failure Success Success rate Failure Success Success rate
1-2 grade 6 6 50.00% 11 0 0.00% 0.006 **
3-4 grade 6 19 76.00% 16 5 23.81% 0.000 ***
5-6 grade 2 11 84.62% 15 7 31.82% 0.003 **
Task 2 N = 104
1-2 grade 2 10 83.33% 11 0 0.00% 0.000 ***
3-4 grade 3 22 88.00% 18 3 14.29% 0.000 ***
5-6 grade 0 13 100.00% 17 5 22.73% 0.000 ***
**p< .01, ***p< .001.
Table 5 Comparisons of operating speeds between graphical interface and text-based linear lists interface
Task 1 N = 48
Graphical interface Text-based linear lists interface Significance
Mean Std. Dev. Number Mean Std. Dev. Number
1-2 grade 59.33 15.397 6 - -
-3-4 grade 40.11 20.981 19 61.00 11.640 5
5-6 grade 38.64 18.559 11 64.71 13.425 7
Average 42.86 20.370 36 63.17 12.298 12 .005**
Task 2 N = 53
1-2 grade 44.50 20.239 10 - -
-3-4 grade 37.36 19.817 22 79.67 9.609 3
5-6 grade 35.08 17.090 13 67.20 13.255 5
Average 38.29 19.056 45 71.88 12.977 8 .000***
Visual Arts icons, and none performed backtrack searches correctly. When they could not find the target, they searched the other side of the extended interface and found the target located on Children Story Collection icon. Since the organization of the icons was consistent with the school curriculum structure, children seldom confused the meanings of the icons. However, topics re-lated to Information Categorization and Information Rec-ommendation both require further study. Although the average operational speeds for graduate students were faster than those for children in both primary examina-tions, larger samples are needed to confirm the usability differences between children and graduate students (and even adults).
Conclusion
The information-seeking behaviors of children when using interfaces associated with different media differ from those of adults. For example, children perform web searches in different affective states of navigation. This study devel-oped a customized interface to help children overcome obstacles to using the NLPI digital library for information seeking. Comparisons of usage behavior between the exist-ing text-based interface and the new graphical interface show that the latter is preferred by the children who par-ticipated in this study.
Since the children indicated that they enjoyed using the NLPI graphical interface, the statistical results pro-vide a valuable reference for considering the effects of visualized information in the design of information re-trieval systems. While children are a special user group with unique characteristics, further studies of Information Recommender in children are needed to enhance the us-ability of interfaces that present information graphically. Many information recommender systems collaboratively evaluate and filter web content and are useful for individ-ual searches of relevant information (Ardoin et al. 2013; Chen et al. 2013; Jafarkarimi et al. 2012; Tejeda-Lorente et al. 2014). To develop appropriate recommendations of information items (textual and graphical), a visual inter-face must consider how graphical information-seeking be-havior differs between children and adults.
In addition to adequate information-seeking skills and intelligent affective strategies, children require custom-ized, enjoyable interfaces to help them surf digital libraries online (Druin 2005; Nesset & Large 2004). To develop an effective graphical interface for a digital library for chil-dren, further confirmatory statistical analysis is needed to determine how the information-seeking behavior of children is affected by latent variables such as informa-tion type, media type, and affective state during infor-mation search.
Table 6 Comparisons of success rates between graphical interface and text-based linear lists interface for children with different computer usage experiences
Task 1 N = 104
Graphical interface Text-based linear lists interface Significance
Failure Success Success rate Failure Success Success rate
Light-experience 14 28 66.67% 35 6 14.63% 0.000***
Heavy-experience 0 8 100.00% 7 6 46.15% 0.011*
Task 2 N = 104
Light-experience 5 37 88.10% 38 3 7.32% 0.000***
Heavy-experience 0 8 100.00% 8 5 38.46% 0.005**
*p< .05, **p< .01, ***p< .001.
Table 7 Comparisons of operating speeds between graphical interface and text-based linear lists interface for children with different computer usage experiences
Task 1 N = 48
Graphical interface Text-based linear lists interface Significance
Mean Std. Dev. Number Mean Std. Dev. Number
Light-experience 43.57 21.923 28 66.50 13.939 6
Heavy-experience 40.38 14.550 8 59.83 10.572 6
Average 42.86 20.370 36 63.17 12.298 12 .021*
Task 2 N = 53
Light-experience 40.19 19.379 37 58.33 7.095 3
Heavy-experience 29.50 15.611 8 80.00 7.036 5
Average 38.29 19.056 45 71.88 12.977 8 .000***
Competing interests
The authors declare that they have no competing interests.
Authors’contributions
KW carried out the interface analysis studies, participated in the sequence alignment, drafted the manuscript, and directed the entire processes of this study. TY designed the visualized interface. TC programmed the visualized interface. TY and TC undertook the experiments to collect data and analyzed statistical data. All authors read and approved the final manuscript.
Acknowledgments
The authors would like to thank the National Science Council of the Republic of China, Taiwan for financially/partially supporting this research under Contract No. 99-2515-S-027 -004.
Author details
1Department of Interaction Design, Nation Taipei University of Technology, Taipei 106, Taiwan.2Doctoral program in Design, Nation Taipei University of Technology, Taipei 106, Taiwan.3CAPCOM TAIWAN Co., Ltd., Taipei, Taiwan.
Received: 3 January 2014 Accepted: 30 April 2014 Published: 30 May 2014
References
Ardoin, SP, Christ, TJ, Morena, LS, Cormier, DC, & Klingbeil, DA. (2013). A systematic review and summarization of the recommendations and research surrounding Curriculum-Based Measurement of oral reading fluency (CBM-R) decision rules.Journal of School Psychology, 51(1), 1–18.
Bates, MJ. (2002). The cascade of interactions in the digital library interface. Information Processing and Management, 38(3), 381–400.
Beheshti, J. (2012). Virtual Environments for Children and Teens. In C Eichenberg (Ed.),Virtual Reality in Psychological, Medical and Pedagogical Applications (pp. 271–286). doi:10.5772/51628.
Bilal, D. (2001). Children’s use of the Yahooligans! Web search engine: II. Cognitive and physical behaviors on research tasks.Journal of the American Society for Information Science and Technology, 52(2), 118–136.
Bilal, D. (2002). Children’s use of the Yahooligans! Web search engine. III. Cognitive and physical behaviors on fully self-generated search tasks.Journal of the American Society for Information Science and Technology,
53(13), 1170–1183. doi:10.1002/asi.10145.
Bilal, D, & Bachir, I. (2007). Children’s interaction with cross-cultural and multilingual digital libraries: I. Understanding interface design representations. Information Processing and Management, 43(1), 47–64.
Bilal, D, & Kirby, J. (2002). Differences and similarities in information seeking: children and adults as Web users.Information Processing & Management, 38(5), 649–670. doi:10.1016/S0306-4573(01)00057-7.
Blom, JO, & Monk, AF. (2003). Theory of personalization of appearance: Why users personalize their PCs and mobile phones.Human–Computer Interaction, 18(3), 193–228.
Brave, S, Nass, C, & Hutchinson, K. (2005). Computers that care: Investigating the effects of orientation of emotion exhibited by an embodied computer agent. International Journal of Human–Computer Studies, 62(2), 161–178.
Chen, J, Zhou, X, & Jin, Q. (2013). Recommendation of optimized information seeking process based on the similarity of user access behavior patterns. Personal and Ubiquitous Computing, 17(8), 1671–1681.
Drexel University. (2012).ipl2 For Kids. Retrieved from http://www.ipl.org/div/kidspace/. Druin, A. (2005). What children can teach us: Developing digital libraries for
children with children.Library Quarterly, 75(1), 20–41.
Genuis, SK. (2004). Web site usability testing: A critical tool for libraries.Feliciter, 50(4), 161–164.
Heo, M, & Hirtle, S. (2001). An empirical comparison of visualization tools to assist information retrieval on the Web.Journal of the American Society for Information Science and Technology, 52(8), 666–675.
Hourcade, JP. (2007). Interaction design and children.Foundation and Trends in Human-Computer Interaction, 1(4), 277–392. doi:10.1561/1100000006. Hu, PJ, Ma, P, & Chau, PY. (1999). Evaluation of user interface designs for
information retrieval systems: a computer-based experiment.Decision Support Systems, 27(1–2), 125–143.
Hutchinson, H, Druin, A, Bederson, BB, Reuter, K, Rose, A, & Weeks, AC. (2005). How do I find blue books about dogs? The errors and frustrations of young digital library users. InProceedings of the 11th International Conference on
Human-Computer Interaction (HCII 2005) (CD-ROM). Mahwah, NJ: Lawrence Erlbaum Associates. (Tech Report HCIL-2005-27). Retrieved from University of Maryland, Human-Computer Interaction Lab website: http://hcil.cs.umd.edu/ trs/2005-27/2005-27.pdf.
Hutchinson, HB, Druin, A, & Bederson, BB. (2007). Supporting elementary-age children’s searching and browsing: design and evaluation using the international children’s digital library.Journal of the American Society for Information Science and Technology, 58(11), 1618–1630.
Jafarkarimi, H, Sim, ATH, & Saadatdoost, R. (2012). A naïve recommendation model for large databases.International Journal of Information and Education Technology, 2(3), 216–219.
Koshman, S. (2006). Visualization-based information retrieval on the Web.Library & Information Science Research, 28(2), 192–207.
Kulper, U, Schulz, U, & Will, G. (1997). Bucherschatz - A prototype of a children’s OPAC.Information Services & Use, 01675265, 17(2/3), 201–214.
Leide, JE, Large, A, Beheshti, J, Brooks, M, & Cole, C. (2003). Visualization schemes for domain novices exploring a topic space: the navigation classification scheme.Information Processing and Management, 39(6), 923–940. Lopatovska, I, & Arapakis, I. (2011). Theories, methods and current research on
emotions in library and information science, information retrieval and human–computer interaction.Information Processing and Management, 47(4), 575–592.
Matte, C. (2014). Limiting computer use for kids. How much time is too much? How do we enforce the rules? Retrieved from. In http://familyinternet.about. com/od/introtofamilycomputing/a/LimitComputer.htm.
Morse, E, Lewis, M, & Olsen, K. (2002). Testing visual information retrieval methodologies case study: comparative analysis of textual, icon, graphical and‘spring’displays.Journal of the American Society for Information Science and Technology, 53(1), 28–40.
Nesset, V, & Large, A. (2004). Children in the information technology design process: a review of theories and their applications.Library & Information Science Research, 26(2), 140–161.
Paivio, A. (2006).Mind and its evolution; A dual coding theoretical interpretation. Mahwah, NJ: Lawrence Erlbaum Associates, Inc.
Reuter, K, & Druin, A. (2004). Bringing together children and books: An initial descriptive study of children’s book searching and selection behavior in a digital library. InProceedings of the 67th Annual Meeting of the American Society for Information Science and Technology(pp. 339–348).
Rubin, J. (1994).Handbook of usability testing: How to plan, design and conduct effective tests. New York: John Wiley & Sons.
Schmidt, S, & Stock, WG. (2009). Collective indexing of emotions in images. A study in emotional information retrieval.Journal of the American Society for Information Science and Technology, 60(5), 863–876. doi:10.1002/asi.21043. Shenton, AK, & Dixon, P. (2004). Issues arising from youngsters’information-seeking
behavior.Library & Information Science Research, 26(2), 177–200.
Shneiderman, B. (1997). The next generation of graphical user interfaces: information visualization and better window management.Displays, 17(3–4), 125–129. Shneiderman, B. (2003). The eyes have it: A task by data type taxonomy for
information visualizations. In B Bedersen & B Shneiderman (Eds.),The craft of information visualization: Readings and reflections(pp. 364–371).
San Francisco: Morgan Kaufmann.
Solomon, P. (1993). Children’s Information Retrieval Behavior: A Case Analysis of an OPAC.Journal of the American Society for Information Science, 44(5), 245–264. Tejeda-Lorente, A, Porcel, C, Peis, E, Sanz, R, & Herrera-Viedma, E. (2014). A quality
based recommender system to disseminate information in a university digital library.Information Sciences, 261, 52–69.
Tzeng, JI. (2004). Toward a more civilized design: Studying the effects of computers that apologize.International Journal of Human–Computer Studies, 61(3), 319–345.
Yu, X. (2012). Exploring visual perception and children’s interpretations of picture books.Library & Information Science Research, 34(4), 292–299.
Zhang, Y. (2008). Undergraduate Students’Mental Models of the Web as an Information Retrieval System.Journal of the American Society for Information Science and Technology, 59(13), 2087–2098.
doi:10.1186/2213-7459-2-5
Cite this article as:Wuet al.:Graphical interface design for children seeking information in a digital library.Visualization in Engineering