NOTE
DOI 10.1007/s10086-005-0769-9
C. Hu · M.T. Afzal (*)
Faculty of Forestry and Environmental Management, University of New Brunswick, PO Box 44555, Frederiction, NB E3B6C2, Canada Tel. +1-506-453-4935; Fax +1-506-453-3538
e-mail: [email protected]
Chuanshuang Hu · Muhammad T. Afzal
A statistical algorithm for comparing mode shapes of vibration testing
before and after damage in timbers
Received: March 18, 2005 / Accepted: Septermber 20, 2005 / Published online: March 2, 2006
Abstract Instances of local damage in timber such as knots,
decay, and cracks can be translated into a reduction of service life due to mechanical and environmental loadings. In wood construction, it is very important to evaluate the weakest location and to detect damage at the earliest pos-sible stage to avoid future catastrophic failure. In this study, modal testing was used on wood beams to generate the first two mode shapes. A novel statistical algorithm was pro-posed to extract a damage indicator by computing mode shapes of vibration testing before and after damage in tim-bers. The different damage severities, damage locations, and damage counts were simulated by removing mass from intact beams to verify the algorithm. The results showed that the proposed statistical algorithm is effective and suit-able for the designed damage scenarios. It is relisuit-able for the detection and location of local damage of different severi-ties, location, and number. The peak values of the damage indicators computed from the first two mode shapes were sensitive to different damage severities and locations. They were also reliable for the detection of multiple cases of damage.
Key words Damage detection · Mode shape · Timber ·
Nondestructive test
Introduction
The average modulus of elasticity (MOE) of wood, which is determined by global nondestructive test techniques, is commonly used to design its usage by considering design safety factors. The MOEs at various locations are mostly identical for a uniform wood beam without any defects.
However, most solid wood beams contain natural defects such as knots so that its MOEs at various locations vary.1
Wood beams are also susceptible to fungal decay and crack development during their service life due to mechanical and environmental loads. Such forms of local damage are mostly described as failure causes of reduced service life. If the weakest portion can be determined using nondestruc-tive tests, the safety design factors can be optimized to improve the usage of wood products. It is also very impor-tant to monitor the weakest location and detect damage at the earliest possible stage to avoid the future catastrophic fracture in most engineering applications.
Over the past 30 years, damage detection in structures has received considerable attention from the civil, aero-space, mechanical engineering, and wood engineering com-munities. Commonly used damage detection methods are either visual or localized experimental methods, such as acoustic, ultrasonic, magnetic field methods, radiograph, eddy current, and thermal field methods. Vibration-based methods in wood engineering were studied by some researchers in the past decade to detect dynamic proper-ties2–9
and local damage.1,10–13
The basis of vibration-based damage detection methods is that any changes in the physi-cal properties of the wood beam, i.e., stiffness, mass and/or damping, will in turn alter its dynamic characteristics (reso-nant frequencies, modal damping, and mode shapes). Yang et al.13
reported the possibility of using the shape of the flexural vibration and its curvature of the first mode to detect the damage. However, it is still necessary to study the damage pattern because it is vital for a damage detection algorithm that the location and severity of defects and/or damage should be automatically identified by certain dam-age indicators. In addition, a damdam-age-detecting algorithm must be suitable for multiple defects and/or forms of damage.
Materials and methods
Six uniform and clear beams without any defects after being visually graded were cut from a log of white oak (Quercus
rubra) and their moisture contents were conditioned to
around 12%. The beam dimensions were 1200 × 25.4 × 50.8 mm (length × width × thickness). The damage scenarios were simulated by removing mass from the intact beams and the different damage scenarios are listed in Table 1.
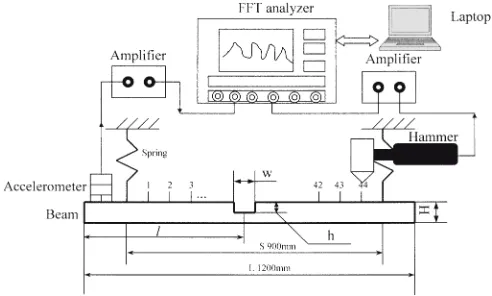
The schematic diagram of the experimental appartus is shown in Fig. 1. The measuring system consisted of an im-pact hammer, an accelerometer, two preamplifiers, and a dual-channel fast Fourier transform (FFT) analyzer. Each beam was tested before and after damage. The beam was free–free supported,14
and the part between the supporting points was subdivided into 45 small equal block elements by 44 center-symmetric impacting points along the algebraic center point of the beam length. The beam was impacted by the hammer, point by point, and the resonant signal was picked up by an accelerometer, which was fixed at one of the free ends. Both the output signal from the hammer and the accelerometer were amplified by preamplifiers and recorded simultaneously using the dual-channel FFT ana-lyzer. Then the data were dumped from FFT analyzer to personal computer for postprocessing. The postprocessing software was developed in MatLab program language for damage identification.
Damage-locating algorithms
The natural frequencies and mode shapes were obtained from the recorded time domain data by computing the frequency response function (FRF) for each measuring point. The Fourier transforms of excitation (input) and re-sponse (output) signals can be expressed by the following equations:
U
( )
w = u t e( )
−i tw t − ∞∞
∫
d (1)V
( )
w = v t e( )
−i tw t − ∞∞
∫
d (2)where u(t) is the excitation signal outputting from the sen-sor hidden inside the hammer; v(t) is the response signal recorded by the accelerometer; U(w) is the Fourier trans-form of u(t); and V(w) is the Fourier transtrans-form of v(t).
The frequency function [FRF or H(w)] of a system was computed as follows:
H V
U
w w
w
( )
=( )
( )
(3)Equation 3 can be rewritten as the following equation:
H H G
G
uv
uu
w w w
w
( )
= 1( )
=( )
( )
(4)where Guv(w) = U*(w)V(w) is the cross-spectrum between
u(t) and v(t); and Gvv(w) = U*(w)U(w) is the autospectrum
of u(t).
The amplitude of the peak (Fij) in the FRF at frequency
wij for measuring point j is the modal coordinate for
measur-ing point j at mode shape i. Here the first two mode shapes were studied so that i = 1,2 and j = 1,2, . . . , 44. The mode shape coordinates for all measuring points were connected to form the mode shape i. The difference of the mode shapes after and before damage was expressed as follows:
Fij Fij Fij
dif= dam− int
(5)
where Fij
dif
is defined as the damage indicator, which is the difference of the mode shapes i at the j-th measuring point before and after damage; Fij
dam
is the mode shape coordi-nates after damage at the j-th measuring point for mode Fig. 1. Diagram of the detecting system
Table 1. Simulated damage scenarios
Scenarios Case 1 Case 2 Case 3 Case 4 Case 5 Case 6 Case 7 Case 8 Case 9 Case 9
w (mm) 3 3 3 3 3 3 3 3 3 3
l/L 40% 40% 40% 40% 25% 40% 55% 70% 40% 70%
Impact point 16–17 16–17 16–17 16–17 7–8 16–17 25–26 34–35 16–17 34–35
h/H 5% 10% 20% 40% 20% 20% 20% 20% 20% 20%
shape i; Fij
int
is the mode shape coordinates before damage at the j-th measuring point for mode shape i. Discrete Laplacian transform expressed by Eq. 6 was then operated on the difference after the above-mentioned subtraction.
lij=
(
Fij+1+Fij−1)
−2Fijdif dif dif
(6)
Considering the difficulty in discerning whether the damage indicator 艎ij indicates damage at the j-th location by
compar-ing the damage indicator for one element with another, the damage indicator values (艎ij) were assumed to be random
variables and were evaluated using a standard normal statis-tical model. Standard normal damage indicator values are denoted as follows:
DIij
ij i
i
= l −m
s (7)
where DIij is the standard normal indicator value of the
mode shape i at the j-th location; and mi and si are mean and
standard deviation of 艎ij for all measuring points at the
mode shape i, respectively. The element was classified as damaged if its standard normal indicator value was greater than a threshold, which was selected judgementally.
Results and discussion
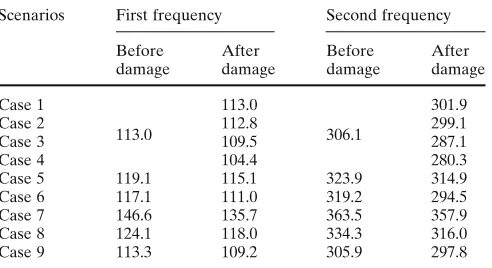
The first two natural frequencies of six beams before and after damage are listed in Table 2. It can be clearly observed that the natural frequencies after the removal of some mass are smaller than those of intact beams except for the first frequencies of cases 1 and 2. This is because the stiffness of the beam is reduced after removing mass. Some researchers reported that the natural frequency is a potential nonde-structive indicator to evaluate and grade timbers.14
As shown in Table 2, the first natural frequencies of cases 1 and 2 showed no difference when compared with intact beam. These results indicate that the first natural frequencies are not suitable for detecting low-level damage or disturbance, while to date there is no known means of using the natural frequencies to locate local damage.
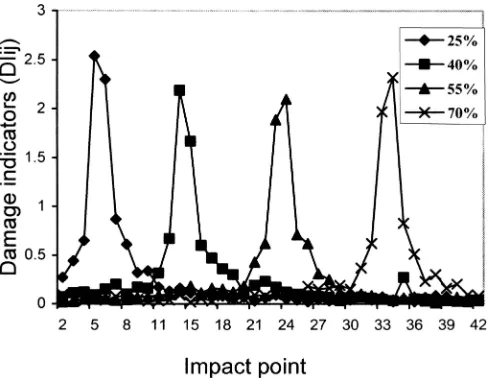
The different damage severities (cases 1–4) were simu-lated to study the effects of the damage severity on the sensitivity of the proposed damage indicator. Damage indi-cators computed from the first two mode shapes versus impacting points under different damage severities (h/H; see Fig. 1) are shown in Figs. 2 and 3, respectively. It can be observed that the damage can be located by the damage indicators computed from the first mode shape or the second mode shape. It is reasonable to conclude that the proposed algorithm is sensitive to damage severity. The damage indicator increases when the damage severity in-creases. The peak values of the damage indicator computed from the first mode shape under different damage severities (h/H: 5%, 10%, 20%, and 40%) were 2.04, 2.2, 2.29, and 2.63. The peak values of the damage indicator computed from the second mode shape were 2.26, 2.43, 2.44, and 2.84. Although the above-mentioned information should not be construed to assume that the damage severity can be
evalu-Table 2. The first two natural frequencies before and after damage
Scenarios First frequency Second frequency
Before After Before After
damage damage damage damage
Case 1 113.0 301.9
Case 2
113.0 112.8 306.1 299.1
Case 3 109.5 287.1
Case 4 104.4 280.3
Case 5 119.1 115.1 323.9 314.9
Case 6 117.1 111.0 319.2 294.5
Case 7 146.6 135.7 363.5 357.9
Case 8 124.1 118.0 334.3 316.0
Case 9 113.3 109.2 305.9 297.8
Frequencies given in hertz
Fig. 2. Damage indicators (first mode) versus impacting points under different damage severities of 5%–40%
ated quantitatively and exactly, they can be used to identify the existence of damage and its location. Further studies should be conducted to improve the algorithm so that the damage severity and the remaining useful life can be esti-mated in structures.
It is well known that the boundary conditions and the mounting of sensors should be carefully considered when designing a vibration test. In this study, different damage locations (cases 5–8) were simulated to study the effects of different damage locations on the effectiveness of the pro-posed damage indicator. Damage indicators of the first two modes versus impacting points under different damage lo-cations (x/L; see Fig. 1) are shown in Figs. 4 and 5, respec-tively. Generally, it can be reasonably concluded from Figs. 4 and 5 that the simulated damage at different locations along the beam were correctly detected and located by the proposed indicator (DIij). The peaks of damage indicators
coincided well with the designed damage locations, and the existence of damage and its location can be readily distin-guished by DIij. The damage indicators tended to become
bigger under the first mode, while the damage indicators became smaller under the second mode when x/L was 40% and 55%. It was thought that this interesting phenomenon was due to the effect of the artificial damage on the local stiffness of the beam and the nature of the mode shapes. The artificial damage in this study decreased the natural frequencies of the beam as shown in Table 2 due to the reduction of the local stiffness of the beam. Meanwhile, the theoretical mode shapes follow a certain sinusoidal function for a free–free supported beam.15
The maximum deforma-tion of the first mode shape approaches 50% (x/L) and the deformation tends to be zero at both ends in a sinusoidal pattern. DI is bigger when x/L is 40% or 55% than that when x/L is 25% or 70% as shown in Fig. 4. The reason is that the deformation is bigger when x/L is 40% or 55%. The maximum deformation of the second mode shape ap-proaches 25% and 75% (x/L) and its deformation is zero at 50% (x/L) and at both ends in a sinusoidal pattern. A simi-lar interpretation can be applied to explain why DI is bigger when x/L is 25% or 75% in Fig. 5. The damage indicator extracted from the mode shape is meaningful only when the deformation and/or deflection are not zero. Therefore, at least the first two mode shapes are suggested to be used together for damage detection to avoid the effect of the mode shape. However, it was found that it was difficult to generate the higher mode shapes such as the third mode shapes because of the excitation source or noise in the response signal.
Two damage counts (case 9) were also simulated to verify the effectiveness of the proposed damage indicator. Damage indicators computed from the first two mode shapes versus impacting points under two damage counts were correctly detected as shown in Fig. 6. It can be ob-served that only the damage indicators of several impact points close to the damage are relevant to the disturbance. It is readily understood that there is no interaction between Fig. 4. Damage indicators (first mode) versus impacting points under
different damage locations (x/L) of 25%–70%
Fig. 5. Damage indicators (second mode) versus impacting points under different damage locations (x/L) of 25%–70%
the multiple damage points with certain distances because the mode shape-based damage indicator is a local indicator and not a global indicator. Therefore, the mode shape-based algorithm is suitable for detection of cases of multiple damage areas.
Conclusions
A statistical algorithm was proposed for damage detection in timbers. The different severities of damage, damage locations, and damage counts were simulated by removing mass from intact beams to verify the algorithm. The results showed that the proposed algorithm is effective and suitable for the designed damage scenarios. The algorithm is reliable for the detection of local damage under different severities, locations, and counts.
Acknowledgment The authors express their thanks to the Natural Sciences and Engineering Research Council of Canada for providing financial assistance.
References
1. Yang XY, Ishimaru Y, Iida I, Urakami H (2002) Application of modal analysis by transfer function to nondestructive testing of wood I: determination of localized defects in wood by the shape of the flexural vibration wave. J Wood Sci 48:283–288
2. Hu YC, Nakao T, Nakai T, Gu JY, Wang FH (2005) Dynamic properties of three types of wood-based composites. J Wood Sci 51:7–12
3. Hu YC, Nakao T, Nakai T, Gu JY, Wang FH (2005) Vibration properties of wood plastic plywood. J Wood Sci 51:13–17
4. Kubojima Y, Ohta M, Okano T (2000) Vibrational properties of heat treated green wood. J Wood Sci 46:63–68
5. Guan HY (2002) Dynamic properties of wood in the moisture content region above the fiber saturation point. PhD dissertation, United Graduate School of Agriculture, Tottori University 6. Dong YK (1996) Dynamic properties for in-plane inhomogeneous
wood-based materials. PhD dissertation, United Graduate School of Agriculture, Tottori University
7. Naki T, Hamatake M, Nakao T (2004) Relationship between piezoelectric behavior and the stress–strain curve of wood under combined compression and vibration stresses. J Wood Sci 50:97– 99
8. Obataya E, Minato K, Tomita B (2001) Influence of moisture content on the vibrational properties of hematoxylin-impregnated wood. J Wood Sci 47:317–321
9. Xu H, Tanaka C, Nakao T, Yoshinobu M, Katayama H (1998) Evaluation of rolling shear strength of plywood by flexural vibra-tion method. J Wood Sci 44:147–151
10. Yang XY, Amano T, Ishimaru Y, Iida I (2003) Application of modal analysis by transfer function to nondestructive testing of wood II: modulus of elasticity evaluation of sections of differing quality in a wooden beam by the curvature of the flexural vibration wave. J Wood Sci 49:140–144
11. Yang XY, Ishimaru Y, Urakami H (2001) Application of modal analysis by transfer function to nondestructive test of wood I. The determination of localized defects in wood by the shape of flexural vibration wave. J Wood Sci 47:304–310
12. Yang XY, Amano T, Ishimaru Y, Iida I (2001) Application of modal analysis by the transfer function on nondestructive test of wood II. Elasticity evaluation of different quality part within wooden beam by the curvature on flexural vibration wave. Mokuzai Gakkaishi 47:412–ss419
13. Yang XY, Ishimaru Y, Iida I (2002) Application of modal analysis by the transfer function to nondestructive testing of wood III: detection of knots and estimation of elastic modulus distribution in wood by the curvature ratio of the flexural vibration wave shape. Mokuzai Gakkaishi 48:16–22
14. Chui YH (1991) Simultaneous evaluation of bending and shear moduli of wood and the influence of knots on these parameters. Wood Sci Technol 25:125–134