http://www.sciencepublishinggroup.com/j/ijmsa doi: 10.11648/j.ijmsa.20190806.11
ISSN: 2327-2635 (Print); ISSN: 2327-2643 (Online)
Area Function for Nanoindentation at High Temperatures
Toshiro Okawa
1, 2, *, Ian Thomas Clark
3, Katsuhiko Tashiro
2, 4, Hideo Honma
2, 4,
Kazuhiro Yoshihara
5, Osamu Takai
2, 41Scienta Omicron, Inc., Tokyo, Japan 2
Materials & Surface Engineering Research Institute, Kanto Gakuin University, Kanagawa, Japan
3Seiko Epson Corporation, Nagano, Japan
4Research Advancement and Management Organization, Kanto Gakuin University, Kanagawa, Japan 5
National Institute for Material Science, Ibaraki, Japan
Email address:
*
Corresponding author
To cite this article:
Toshiro Okawa, Ian Thomas Clark, Katsuhiko Tashiro, Hideo Honma, Kazuhiro Yoshihara, Osamu Takai. Area Function for Nanoindentation at High Temperatures. International Journal of Materials Science and Applications. Vol. 8, No. 6, 2019, pp. 98-102.
doi: 10.11648/j.ijmsa.20190806.11
Received: October 7, 2019; Accepted: October 24, 2019; Published: October 31, 2019
Abstract:
It becomes important to measure mechanical properties of local area of materials because of downsizing of industrial materials, and the fracture of materials often starts at the nanoscale defects. Therefore, the measurement of hardness of the local area of materials is one of key technologies to develop new materials. Nanoindentation is the depth sensing indentation method and can measure the mechanical properties of nanoscale area of materials. The hardness of materials under the controlled environment like high temperature is a big issue in energy or environment industries. Therefore, it becomes important to measure high temperature mechanical properties of nanoscale area of materials by nanoindentation. However, the shape of indenter may change when an indenter contacts to the material surface at high temperatures, and the nanoindentation at high temperatures may lead to inaccuracy of measurements. Nanoindentation does not measure indented are directly but converts the indentation depth to the indented area by area function. In order to correctly convert the indentation depth to the indented area, it is necessary to derive the area function of indented area at high temperatures. In this report, the area function is proposed that considers the change of indenter shape during repeating contact at heated materials. By using this proposed area function, nanoindentation hardness and the reduced modulus of sapphire were obtained at 303K, 473K, 673K, 873K and 1073K successfully. The nanoindentation can be used at high temperatures, if this proposed area function is used.Keywords:
Nanoindentation, Area Function, Hardness, Elastic Modulus, Sapphire, High Temperature1. Introduction
It becomes important to measure mechanical properties of local area of materials because of downsizing of industrial materials, and the fracture of materials often starts at the nanoscale defects. Therefore, the measurement of hardness of the local area of materials is one of key technologies to develop new materials. The conventional technique to measure the hardness of materials using an optical micrometer can evaluate mechanical properties of a local region over several µm according to the resolution of optical micrometer but cannot measure the hardness of nanoscale area. W. C.
Oliver and G. M. Pharr proposed to measure the hardness by the depth sensing indentation method in 1992 without using an optical micrometer [1]. This method is called nanoindentation. Since then, the nanoindentation hardness of various materials has been reported [2-5].
However, the shape of indenter may change when an indenter contact the material surface at high temperatures, and the nanoindentation at high temperatures may lead to inaccuracy of measurements [11, 12]. When an indenter contacts a specimen at high temperatures, the adhesion between an indenter and a specimen is often observed, and the measurement becomes impossible. The apex size of indenter is nm scale, and nanoindentation is very sensitive to the damage at the apex. In order to avoid this adhesion, the contact time shall be reduced. However, if the contact time is reduced, the measurement error increases eventually. Therefore, the indentation of short contact time shall be repeated many times at same area and under same condition. Even if the adhesion is avoided by the repeating contact, the change of indenter shape may occur by abrasion that becomes very severe at high temperature. In order to correctly convert the indentation depth to the indented area, it is necessary to derive the area function of indented area at high temperatures. In this report, the area function is proposed that considers the change of indenter shape during repeating contact at heated materials. By using the proposed area function, the high temperature hardness and reduced modulus of sapphire were measured.
2. Experimental
The hardness (H) is obtained by dividing the indentation load (P) by the indented area (A). In the nanoindentation method, the relationship between the projected indented area (Ac) and the indentation depth (h) is called the area function
(Ac (h)) which is obtained in advance. When an indenter
indents a specimen, the vicinity of the specimen surface is elastically deformed, and two kinds of indentation depth are defined. One is the maximum depth of indented area (hmax),
and the other is the contact depth (hc) [1]. The contact depth
(hc) can be obtained by the maximum depth subtracting the
amount of deflection due to the elastic deformation and can be calculated from a load - displacement curve [1]. S is the stiffness defined as the derivative value of indentation load at
the maximum depth ( ≡ ) on the load - displacement
curve. Nanoindentation hardness (HIT) is obtained from the maximum indentation load (Pmax) divided by the indented area.
The indentation area at hc is obtained from the area function (Ac (hc)). Using these values, the nanoindentation hardness
(HIT) and the reduced modulus (Er) can be obtained from eq.1
and eq.2 respectively.
(1)
√
(2)
The reduced modulus (Er) is the combination of the elastic
modulus of the specimen and that of the indenter material as indicated by eq.3. Here, Especimen is the elastic modulus of
specimen, and νspecimenis the Poisson's ratio of specimen. Etip is
the elastic modulus of indenter material, and νtip is the
Poisson's ratio of indenter material. The material of the indenter is diamond, and Etip is 1070GPa and νtip is 0.07 [13].
! " #
! " $ %!#
%! (3)
The area function of indenter is obtained by indenting fused silica. The reduced modulus of fused silica has been already determined by Hysitron Inc. as 69.6GPa. Using the contact depth and stiffness obtained from the load - displacement curve, the area function of Berkovich type indenter was calculated based on eq.2.
In this experiment, Tribo Indenter and xSol 800 of heating stage manufactured by Hysitron were used. Since the oxidation of diamond indenters becomes severe at temperatures above about 700K, the mixed gas of Ar 96~97% and H 3~4% was used as the flowing gas to heating stage [11, 12]. The Berkovich indenter of diamond was used. The specimen for nanoindentation at high temperatures was the single crystal sapphire having a c - axis surface, and a fused silica was used for getting an area function. The specimen of sapphire was set to the heating stage so that the side of the indenter was parallel to a - axis. Before heating the specimen, the area function is measured by using a fused silica. Then the specimen is changed to sapphire.
The sapphire specimen was heated to a setup temperature and indented at 400 (20 x 20) points in 28.5µm square of surface. The space between indentation points is set to 1.5µm. The maximum load was fixed at 3mN, the loading - unloading time was 0.1s, and the holding time at the maximum load was 0.2s. The loading – unloading velocity was selected to minimize the reaction between the indenter and the specimen. After 400 points indentation, specimen is changed to the fused silica to measure the area function of the indenter again. This measurements cycle was repeated at 303K, 473K, 673K, 873K and 1073K. After the measurement at 1073K was over, specimen was cooled to 303K, and indented again with same indentation condition, and area function was also obtained as before.
3. Results & Discussion
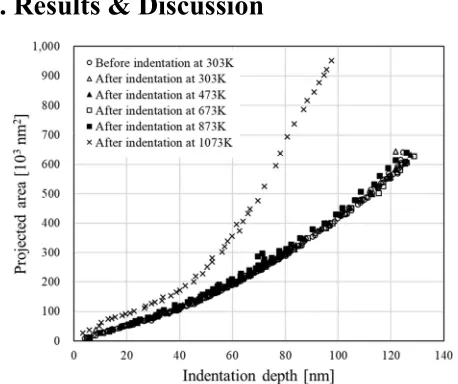
Figure 1. Area function after the indentation of sapphire at various temperatures.
after the indentation of sapphire at each temperature. The ordinate is the projected area of indentation [nm2] and the abscissa is the indentation depth [nm]. The projected area didn’t change so much between 303K and 873K. However, the area function dramatically changed after the indentation at 1073K.
Figure 2. SPM image of indent area: (1) after indentation at 303K, (2) after indentation at 1073K.
Figure 2 shows the SPM image of indented area at 303K and 1073K. The pile up around indented area was found at 1073K as shown in Figure 2. This indicated the shape of indenter changed during indentation at 1073K.
To simplify the image of indenter shape, indenter is supposed to have conical shape. Then the projected area (Ac)
is shown by the radius of indenter (a) as eq.4.
&' ( ) (4) Before starting indentation at 1073K, Ac is shown as [after
indentation at 873K] curve in Figure 1. Then the specimen temperature was raised to 1073K. After 400 indentations at 1073K, Ac is shown as [after indentation at 1073K] curve in
Figure 1. From two curves in Figure 1, radius of indenter (a) is calculated by eq.4 at each indentation depth.
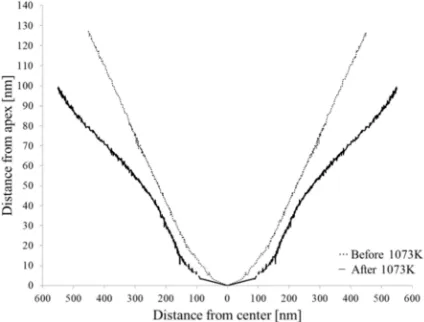
Figure 3. The simulated indenter shape before/after the indentation at 1073K.
Figure 3 shows the change of indenter shape during iteration of indentations at 1073K. The ordinate is the indentation depth, and the abscissa is the radius of indented area. It is possible to view the ordinate to be the distance from the apex of indenter, and the abscissa to be the distance from the indenter center. The indenter shape after 1073K the apex of indenter became round and got thick. This change of indenter shape was caused by the wear during indentation at
1073K [11, 12]. This means the indented area size at the first indentation on sapphire at 1073K was viewed to be same as indicated by [after indentation at 873K] curve in Figure 3. And the indented area size after 400 times iterations of indentation at 1073K was indicated as [after indentation at 1073K] curve in Figure 3. It is possible to suppose that indented area gradually increased during iteration of indentations at 1073K.
Figure 4. Load displacement curves at the /irst indentation 6 and the 400th indentation (○) on sapphire at 1073K.
Figure 4 shows the load - displacement curves at the first indentation and the 400th indentation on sapphire at 1073K. The load - displacement curve of the 400th indentation shows the shallower indentation depth than that of the first indentation, and the pop-in phenomenon was observed [14, 15]. Since the indenter shape at the first indentation was sharp, the projected area smoothly increased as the indentation depth increased. Therefore, the stress given by indenter to specimen was increasing smoothly. Therefore, the pop-in phenomenon was not observed on the load - displacement curve, and the indenter reached to the deeper part. The indenter shape at 400th indentation had round thick apex, and the projected area changed precipitously as indentation depth increased. The precipitous increase of stress from indenter to specimen caused the sample deformation, and large pop-in phenomenon occurred. The round thick indenter could not reach the deep part of the specimen.
Figure 5 shows the change of contact depth with iteration of indentation at each measurement temperature. The ordinate is the contact depth, and the abscissa is the number of iterations of indentation. The contact depths increased as the indentation temperature increased because of softening of sapphire. The contact depth at temperatures between 303K and 873K were almost constant during iteration of indentation. This means that the indenter shape did not change during iteration of indentation at temperatures between 303K and 873K. This result coincides with that area functions were almost similar between 303K and 873K as indicated in Figure 1. However, the contact depth at 1073K decreased as the iteration number increased. In this case, the indented area changed as the iteration number increased, and the area function should be obtained at every iterated indentation at 1073K. But it was impossible because it took very long time to measure area function at every indentation (400 times). Therefore, the following formula of area function was proposed that reflected the change of indenter shape during iteration of indentation. Since the contact depth at 1073K decreased linearly as the iteration number increased, indented area also assumed to increase linearly. Then, the estimated projected area (Ac_new) at
the iteration number of n is calculated by eq.5.
&'_89: ;' <1 >?8 @ &'_A9BC 9 ;' $ D8? E &'_FBG9 ;' (5)
N is the total number of indentations at a measurement temperature and n is the iteration number of indentations. N
was 400 in this experiment. Ac_before (hc) is the area function
before the target indentation starts. Ac_after (hc) is the area
function when the target indentations is over. In the case of indentation at 1073K, Ac_before (hc) is the area function
measured after the indentation at 873K, and Ac_after (hc) is the
area function measured after the indentation at 1073K.
Figure 6. The change of projected area (Ac_new) with the iteration of indentation at 1073K.
Figure 6 shows the change of projected are (Ac_new) with the
iteration of indentation at 1073K. The ordinate is the projected area of indenter calculated by eq.5, and abscissa is the iteration number. The projected area increased as iteration number increased.
Figure 7. The change of nanoindentation hardness of sapphire with number of iterations.
The relation between nanoindentation hardness and the number of iterations is shown in Figure 7. The ordinate is nanoindentation hardness calculated using Ac_new, and the
abscissa is number of iterations. When the projected area increased, the calculated nanoindentation hardness decreased according to eq.1. The average nanoindentation hardness of sapphire at 1073K was 13.6 +/- 1.0GPa. The hardness at a given temperature must be constant. However, the hardness was decreased as the number of interactions was increased as shown in Figure 7. From Figure 3, the radius of indenter increased discontinuously at around 40nm of indentation depth. From Figure 2, the indented area after indentation at 1073K was smaller than that of at 303K, though the indentation depth at 1073K was deeper than that of at 303K from Figure 5. This means that at 1073K indentation, the indentated area was smaller than that of expected by eq.5. This was caused by the contamination of indenter at high temperatures. This contamination increased as the number of iterations was increased. Therefore, the hardness of indenter changed during indentation. The area function using eq.5 did not consider the contamination effect and gave larger projected area than the real projected one.
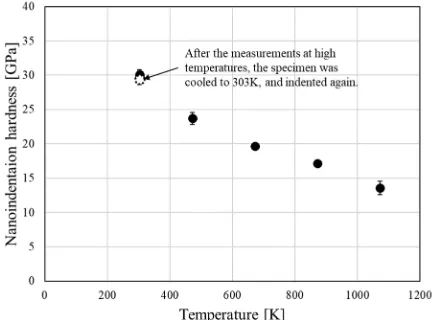
Figure 8. The nanoindentation hardness of sapphire at various temperatures.
hardness, calculated projected area of indentation at each temperature was used. The projected area was obtained by eq.5 at each temperature. The ordinate is nanoindentation hardness, and the abscissa is specimen temperature. The hardness decreased as the temperature increased. In this experiment, the indentation at 303K was repeated after 1073K indentation to check the reliability of this experiment. Before heating the specimen, the hardness was 29.8 +/- 0.8GPa, and after cooling from 1073K to 303K, the hardness was 29.4 +/- 0.8GPa.
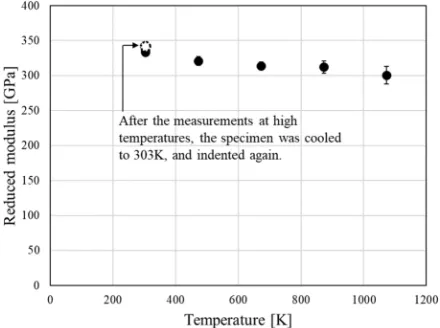
Figure 9. The reduced modulus of sapphire at various temperatures.
Figure 9 shows the reduced modulus of sapphire at various temperatures. To calculate the reduced modulus, calculated projected area of indentation at each temperature was also used. The ordinate is reduced modulus, and the abscissa is specimen temperature. The reduced modulus decreased as the temperature increased. Before heating the specimen, the reduced modulus was 333.7 +/- 3.9GPa, and after cooling from 1073K to 303K, the reduced modulus was 342.3 +/- 5.3GPa. Both the hardness and reduced modulus of sapphire at 303K did not change after heating even if the shape of the indenter changed while heating. This shows that the results obtained were reliable.
4. Conclusion
It becomes important to measure high temperature mechanical properties in nanoscale area of materials by nanoindentation. The nanoindentation hardness and the
reduced modulus of sapphire were measured by
nanoindentation at high temperatures. When sapphire was heated above at 1073K, indenter shape changed very much during indentation. The indenter became thick, and its apex becomes round. To minimize this shape change, the indentation of short contact time was repeated many times at same area and under same condition. This means the area
function changed during iterative indentation. Since the contact depth at 1073K decreased linearly as the iteration numbers of indentations increased, indented area also assumed to increase linearly. Based on this assumption, the formula for area function as a function of iteration number at high temperatures was derived. By using this formula, the nanoindentation hardness and the reduced modulus of sapphire were measured at 303K, 473K, 673K, 873K and 1073K successfully. The hardness and the reduced modulus of sapphire both decreased as the temperature increased. The nanoindentation can be used at high temperatures, if this proposed area function is used.
References
[1] W. C. Oliver and G. M. Pharr, J. Mater. Res., 7, 1564 (1992). [2] Ehab Z. Alsayed, Ilnaz Hariri, Syozi Nakashima, Yasushi
Shimada, Turki A. Bakhsh, Junji Tagami, Alireza Sadr, Dental materials, 32 (6), 807 (2016).
[3] J. J. Roa, G. Fargas, A. Mateo and E. Jiménez-Piqué, Mater. Sci. Eng., 645, 188 (2015).
[4] A. leitner, V. Maier-Kiener and D. Kiener, Mater. Res. Lett., 5 (7), 486 (2017).
[5] K. Kesea, P. A. T. Olsson, A.-M. Alvarez Holston and E. Broitman, J. Nucl. Mater., 487, 113 (2017).
[6] J. M. Wheelerand J. Michler, Rev. Sci. Instrum., 84 101301 (2013).
[7] J. M. Wheeler, D. E. J. Armstrong, W. Heinz and R. Schwaiger, Curr. Opin. Solid State Mater. Sci., 19 (6), 354 (2015). [8] M. Peters, C. Leyens, U. Schulz and W. A. Kaysser, Adv. Eng.
Mater., 3, 193 (2001).
[9] D. R. Clarke and C. G. Levi, Annu. Rev. Mater. Res., 33, pp. 383 (2003).
[10] Gianni Campatelli and Antonio Scippa, Procedia CIRP, 55, 200 (2016).
[11] Jonathan C. Trenkle, Corinne E. Packard, and Christopher A. Schuh, Rev. Sci. Instrum., 81 (7), 073901 (2010).
[12] J. M. Wheeler, R. A. Oliver and T. W. Clyne, Diamond Relat. Mater. 19 (11), 1348 (2010).
[13] Anthony C. Fisher-Cripps, “Nanoindentation”, Springer., 257 (2011).3.
[14] A. M. Minor, E. T. Lilleodden, E. A. Stachand J. W. Morris., J. Mater. Res., 19, 176 (2004).