R E S E A R C H
Open Access
Pathways for best practice diffusion: the
structure of informal relationships in
Canada
’
s long-term care sector
James W. Dearing
1*, Amanda M. Beacom
2, Stephanie A. Chamberlain
2, Jingbo Meng
1, Whitney B. Berta
3,
Janice M. Keefe
4, Janet E. Squires
5, Malcolm B. Doupe
6, Deanne Taylor
7, Robert Colin Reid
8, Heather Cook
9,
Greta G. Cummings
2, Jennifer L. Baumbusch
10, Jennifer Knopp-Sihota
11, Peter G. Norton
12and Carole A. Estabrooks
2Abstract
Background:Initiatives to accelerate the adoption and implementation of evidence-based practices benefit from an association with influential individuals and organizations. When opinion leaders advocate or adopt a best practice, others adopt too, resulting in diffusion. We sought to identify existing influence throughout Canada’s long-term care sector and the extent to which informal advice-seeking relationships tie the sector together as a network. Methods:We conducted a sociometric survey of senior leaders in 958 long-term care facilities operating in 11 of Canada’s 13 provinces and territories. We used an integrated knowledge translation approach to involve knowledge users in planning and administering the survey and in analyzing and interpreting the results. Responses from 482 senior leaders generated the names of 794 individuals and 587 organizations as sources of advice for improving resident care in long-term care facilities.
Results:A single advice-seeking network appears to span the nation. Proximity exhibits a strong effect on network structure, with provincial inter-organizational networks having more connections and thus a denser structure than interpersonal networks. We found credible individuals and organizations within groups (opinion leaders and opinion-leading organizations) and individuals and organizations that function as weak ties across groups (boundary spanners and bridges) for all studied provinces and territories. A good deal of influence in the Canadian long-term care sector rests with professionals such as provincial health administrators not employed in long-term care facilities.
Conclusions:The Canadian long-term care sector is tied together through informal advice-seeking relationships that have given rise to an emergent network structure. Knowledge of this structure and engagement with its opinion leaders and boundary spanners may provide a route for stimulating the adoption and effective implementation of best practices, improving resident care and strengthening the long-term care advice network. We conclude that informal relational pathways hold promise for helping to transform the Canadian long-term care sector.
Keywords:Canada, Long-term care sector, Long-term care, Diffusion of innovations, Advice seeking, Social network analysis, Opinion leadership, Integrated knowledge translation
* Correspondence:[email protected]
1Department of Communication, Michigan State University, Suite 473, 404
Wilson Road, East Lansing, MI 48824-1212, USA
Full list of author information is available at the end of the article
Background
The diffusion of innovations paradigm [1] suggests that the structure of relationships among the members of a social system, in combination with perceptions of inno-vations and the environmental context in which a social system is embedded, affects the decisions of members to adopt an innovation or not [2–9]. Especially when an innovation strikes potential adopters as important, they rely on credible others in their network of relationships for guidance before adoption or rejection [1, 10]. This fundamental importance of social influence in decision processes is well-established across academic disciplines and practical applications [1, 11, 12].
Having insight into the informal structure of an advice-seeking network is akin to having a key. Once in hand, the key can be used by an intervention team to help estimate where in a network interventions can best be seeded. An intervention team can also identify structural weaknesses in the network—such as a potential relationship that does not yet exist or two groups that might benefit from being tied together—that can be targeted for strengthening in an over-alldesigning for diffusionframework [13]. The absence of a relationship can represent an opportunity for tying a net-work more closely together. In a complementary fashion, the spread of an innovation once it is introduced into a net-work can be accelerated by well-established relationships formed on the basis of co-location, a common background, employment in the same sector, or another basis for people to perceive similarity with each other [14]. This is especially the case for colleagues who are accessible and who we perceive to be trustworthy and/or an expert about a topic—informally influential opinion leaders [15]. In stud-ies of knowledge diffusion, scholars have observed that cen-tral advice sources may act as opinion leaders, driving the spread of knowledge through the network [16, 17].
In this study, we sought to identify existing influence among directors of care in Canada’s long-term care (LTC; nursing home) sector and the extent to which in-formal advice-seeking relationships among them bind them as a network that spans the sector. An understand-ing of the extent to which this sector is informally inter-connected could offer a new means for stimulating a national system transformation [18], which is our team’s distal goal. The sustainability of the LTC sector in Canada depends upon system transformation.
The decentralized Canadian context
The formal structure of the Canadian LTC sector is com-plex and variable across provinces and territories. The LTC sector in Canada sits outside of the Canadian Medicare System, such that while many components of the health care system in Canada are publicly financed, the long-term care sector is financed through a combin-ation of public and private contributions [19]. Provinces
are responsible for how long-term care facilities organize, deliver, and monitor care. Their respective approaches have been shaped by where residential long-term care has been situated in the province’s evolution of health and so-cial policy. Generally, provinso-cial and territorial ministries have responsibility for legislation, regulations, standards, and policies. Presently, residential long-term care is situ-ated in the “health” portfolio of provincial governments, with the exception of New Brunswick where it is under social development. In a few provinces, ministries own and operate long-term care facilities (e.g., Prince Edward Island) whereas in others, the owner-operator model may include the regional health authority (e.g., Saskatchewan), not-for-profit only (e.g., New Brunswick) or a mix of non-profit and for-non-profit (e.g., Nova Scotia, Manitoba).
From staff and resident perspectives, differences exist across the country as well. Direct care staff vary in how they are identified, the education requirement for entry to practice, and the extent to which their workplace is union-ized [20]. Entry to LTC is based on provincial/territorial cri-teria, supported by centralized and coordinated entry, and in many jurisdictions, a standardized assessment (the interRAI-Home Care1) is used as part of the LTC applica-tion process to inform eligibility and priority. All residents pay some portion of accommodation costs, often based on their income.
Study rationale and purpose
In Canada, as in a number of countries, the proportion of people aged 65 and older is increasing, with projections suggesting a very substantial proportion of future popula-tions in this age group. The number of Canadians 65 and older will more than double to 10.4 million by 2036 [21]. Already, Canadian LTC residents are increasingly older and more frail with multiple chronic conditions and spe-cialized needs, and most have dementia [22].
The purpose of our project was to identify existing advice-seeking networks among LTC facilities that are within Canada’s residential LTC sector by using social network analysis. Our goal was to inform future efforts to disseminate transformative innovations using this knowledge. Our specific aims were to:
1. Identify the structure of existing informal inter-organizational and interpersonal relationships among 958 LTC facilities and LTC directors of care in Atlantic, Western, and Northern Canada.
2. Identify which LTC facilities and individuals within groups are most influential and which homes and individuals within the overall network link different groups together.
a qualitative study) and studying the knowledge translation roles of our practitioner colleagues in system transform-ation. Our pan-Canadian team has worked together for sev-eral years within the Translating Research in Elder Care (TREC) program of research that has been explained in this journal [23–25] and that relies on a partnership model of applied research.
Levels of analysis in social networks
Social network metrics allow for the analysis of nodes (sin-gle actors such as a person or an organization), how nodes are tied together, and analysis of networks as a whole. We conceptualized and wanted to compare an interpersonal network with an inter-organizational network because LTC leaders—like actors in other industries—may well look to both individuals and to organizations when they are considering the adoption of a care improvement innovation. We do this while acknowledging that in a LTC leader’s mind, the two are blended; he or she has one ego-centric network in mind consisting of comparative and as-pirational sources [26, 27]. This reference group is likely composed of a care director’s set of known colleagues, along with some number of organizations that are watched and admired. Such organizations may be both other LTC facilities that are considered progressive or highly reputable and other types of organizations such as provincial health departments, quality assurance organiza-tions, and university departments of geriatrics.
Methods Study population
The study population consisted of one senior leader (most with the job title of Director of Care or Director of Nursing) from each of the 958 LTC facilities operating at the time of data collection in the Canadian provinces of Newfoundland and Labrador, Prince Edward Island, Nova Scotia, and New Brunswick in Atlantic Canada; British Columbia, Alberta, Saskatchewan, and Manitoba in Western Canada; and the territories of Yukon, Nunavut, and the Northwest Territories in Northern Canada. We defined “LTC facility” as a residential long-term care setting for older adults, commonly those aged 65 and older, that offers 24-h on-site personal care, nurs-ing care, and housekeepnurs-ing services. Our facility sample was a census one. Eligible LTC facilities were first identi-fied using the Guide to Canadian Healthcare Facilities
(2012) and then verified via consultation with regional LTC professionals. We chose the senior leaders because they had decision-making responsibility for clinical care and for implementing innovations that influence best practice use, evidence-based decision-making, and resi-dent care quality.
Data collection and measures
Data collection occurred between November 2014 and May 2015 via distribution of an online survey instrument and followed the Dillman method of tailored survey de-sign [28]. The survey was available in English and French. To pilot test the survey instrument, we recruited four LTC leaders in Edmonton and six in Atlantic Canada to complete the survey and participate in cognitive debrief-ing, with one participant completing the survey in French. Feedback from the pilot testing resulted in refinement of survey format, instructions, and question wording.
We designed the survey to take 10 min to complete and included questions about advice-seeking behavior, demo-graphics, and current employment and employment his-tory. We assessed advice-seeking behavior at both the interpersonal and inter-organizational levels. For interper-sonal advice seeking, we asked the participants to list indi-viduals external to their LTC facility whose advice they seek or behavior they monitor about delivery of quality care, care improvement, and innovation. The respondents were instructed that these interpersonal sources of advice could include people who work in a LTC facility or those who work in another setting such as government, not-for-profit organizations, or industry. The participants could list up to three individuals (from most- to second-most-to third-most-valued source of advice) and were asked second-most-to specify the individuals’job titles and organizational affilia-tions. For inter-organizational advice seeking, we asked the participants to list LTC facilities whose example or reputation they followed with respect to delivery of quality care, care improvement, and innovation. The participants could list up to three organizations in the order of most valued sources.
We collected employment data by asking the partici-pants to indicate their primary organizational affiliation, if they had responsibility for more than one facility, how long they had worked in long-term care over their career, and how long they had worked in their position at their current LTC facility. We also asked the participants to specify whether their primary facility was free-standing or co-located with another health care facility and for the last three organizations in which they had worked. We asked for demographic information on job title, gender, age, highest level of education achieved, and professional background.
facility in the study. Following the protocol of our parent research program, TREC, we classified owner-operator models in three categories: public not-for-profit, voluntary (e.g., faith based) not-for-profit, and private for-profit [23]. On the advice of regional experts, we used a fourth cat-egory, private not-for-profit, to characterize ownership of the majority of LTC facilities in one province, New Bruns-wick. The third variable was the size of each LTC facility, as measured by number of beds in each facility. Again, fol-lowing the TREC protocol, we classified the size in three categories: small (fewer than 80 beds), medium (80–120 beds), and large (more than 120 beds).
A final variable for the interpersonal networks, profes-sional role, was created using the job title and organizational affiliation information collected for each survey participant and each individual nominated as a source of advice.
Analysis
We cleaned the collected survey data to remove duplicate responses and incomplete responses. Complete responses provided the respondent’s name, job title, primary LTC af-filiation, and the nomination of at least one individual or organization (outside of the respondent’s own focal organization) as a source of advice. Survey respondents who reported working at more than one LTC facility were represented as one node only in the interpersonal network, but as multiple nodes (one node for each LTC facility at which the respondent worked) in the inter-organizational network. We then created adjacency matri-ces for the interpersonal and inter-organizational networks in each of the provinces and territories, in which
“1” indicated that an advice or social modeling relation-ship existed between two senior leaders or two LTC facil-ities and“0” indicated the absence of a relationship. The matrices were constructed such that the ego in the dyad was the advice seeker (the survey respondent or the re-spondent’s primary LTC facility) and the alter was the ad-vice source or model (an individual who the respondent identified as a valued source of advice or an organization that the respondent identified as a model of quality care). We then used the two adjacency matrices as data files in the network analysis.
We performed analyses at two levels: at the level of each province and territory and at the pan-Canadian or whole-network level. The employment and demographic data were analyzed by calculation of descriptive statis-tics, using SPSS version 23. The network data were ana-lyzed by calculation of network descriptive statistics at the whole-network, province or territory, and nodal (in-dividual and organizational) levels using SPSS, UCINET version 6, and Gephi version 0.9. We created network vi-sualizations using Gephi and ArcGIS.
At the whole-network level, we measured the number of types of nodes and ties, density, and in-degree centralization. Network density is calculated by dividing the number of observed ties in the network by the number of possible ties that could exist, if all nodes were con-nected to all other nodes [29]. In many social networks, density is quite low [30] and when considered in isolation the measure is not particularly meaningful. It does, how-ever, offer a useful measure to compare the relative con-nectedness of a number of different networks, as was our objective here with the pan-Canadian analysis.
At the nodal level, because of our interest in best practice diffusion, we sought to identify individuals and LTC facilities that play key roles in the flow of advice through the networks: opinion leaders and boundary spanners. We identified nodes in the inter-personal and inter-organizational networks as opinion leaders on the basis of their in-degree centrality scores. In-degree centrality is a simple count of the number of incoming ties, or relationships, a node re-ceives [29]. It is the most commonly used measure of opinion leadership [31], but little formal consensus exists on the appropriate threshold, based on in-degree measures, for identifying the number of opinion leaders in a particular network [16, 32]. Accordingly, we tested the appropriateness of several different thresholds for our data and found that for each pro-vincial and territorial network, an in-degree threshold of at least two standard deviations above the mean in-degree score of all nodes in the network offered the best fit for our data.
Results
Survey respondents
Because of response rates of less than 30% in Yukon Territory, Nunavut Territory, and the province of Newfoundland and Labrador, we excluded data from these areas from our analysis. From the 926 senior LTC leaders surveyed in the remaining eight provinces and territories, we collected a total of 482 complete responses for an over-all response rate of 52%. Specific response rates for each province and territory included in the analysis are re-ported in Table 1 and ranged from 41 to 100%.
The complete demographic and employment charac-teristics of the survey respondents are also summarized in Table 1. A majority of the senior LTC leaders who responded to the survey were women aged 40 to 59 (71%) with a professional background in nursing (79%). Their mean years worked in the long-term care sector was about 15 years, and mean years worked in their current position was about 6 years.
Network characteristics and measures
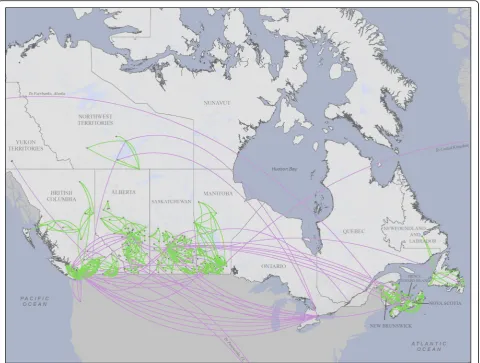
Responses from the 482 senior LTC leaders generated the names of 794 individuals and 587 organizations as sources of advice and example for social network analysis. Figure 1 presents a visualization of the inter-organizational advice network across Canada, illustrating the geographic scope of the study and the spatial distribution of advice seeking. Advice relationships extend across provinces and territor-ies to create a single national inter-organizational network, but these inter-provincial relationships are relatively rare compared with intra-provincial relationships and account for only 5% of links in the network. Most of the social in-fluence for care improvement in the long-term care sector appears to occur intra-provincially and locally. This gen-eral geographic pattern of advice relationships in the inter-organizational network also applies to the interper-sonal network.
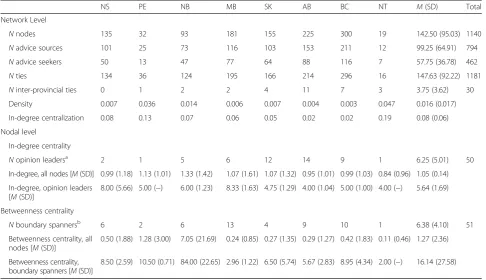
Tables 2 and 3 present measures describing the struc-tures of the interpersonal and inter-organizational advice networks, respectively. The interpersonal advice network is composed of 1140 individuals, ranging from 19 in the Northwest Territories to 300 in British Columbia. The network has 1181 links, with just a small fraction (3%) of these crossing provincial or territorial boundaries; this reinforces the geographic pattern of advice seeking ob-served in the visualization of the inter-organizational network displayed in Fig. 1. Interpersonal network dens-ity across all provinces and territories is low, with the highest densities in the areas with the smaller popula-tions, as is often observed in social networks.
We identified 50 opinion leaders in the interpersonal advice network, with the count in provinces and territories ranging from 1 to 14. In-degree centrality scores averaged about 1 for all individuals and about 6 for opinion leaders.
Network centralization was highest in the Atlantic prov-inces and in the Northwest Territories and lowest in the Western provinces. We also identified 51 boundary span-ners in the interpersonal network, with a count across the provinces and territories ranging from 1 to 13. The aver-age betweenness centrality score was 1 for all individuals and 16 for boundary spanners.
Descriptive analysis of the professional role data col-lected for each individual in the interpersonal network is reported in Table 4. As this table indicates, a substantial proportion of individuals in the provinces and territories have titles other than LTC senior leader or director of care. Many of the individuals nominated as sources of advice, in fact, were those working in corporate LTC po-sitions, in regional health authorities and provincial gov-ernments, and in consultant or expert roles in the LTC sector. The British Columbia interpersonal network vi-sualized in the left panel of Fig. 2 illustrates this finding, with nodes in the network color-coded according to pro-fessional role.
Table 5 reports on the ownership and size of LTC facil-ities in the inter-organizational advice network. Public not-for-profit was the most common owner-operator model (43%), then voluntary not-for-profit (24%), and pri-vate for-profit (22%). About half of the LTC facilities in the network were small, with fewer than 80 beds, and the other half was split equally between medium and large fa-cilities. Inspection of sociograms by province and territory, coded according to ownership and size, suggested no clear influence of these variables on network structure.
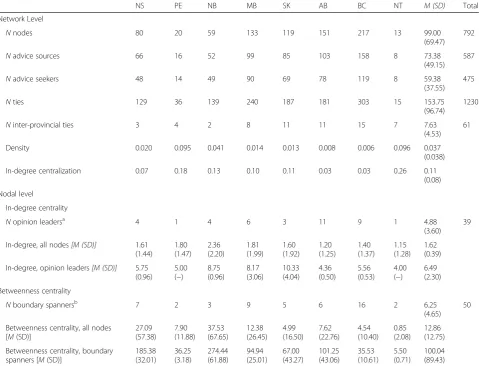
In comparison to the interpersonal advice network, the inter-organizational network had fewer nodes—the respondents named fewer distinct organizations than in-dividuals. Given that the number of possible individuals to name is larger than the number of possible organiza-tions, this is unsurprising. In the interpersonal network, 1140 individuals with 1181 links clustered into 87 groups; in the inter-organizational network, 792 organi-zations with 1230 links clustered into 19 groups. In each province and territory, network density scores were higher in the inter-organizational network than in the interpersonal network. This difference between the two networks is illustrated perhaps most dramatically by the data from British Columbia. Figure 2 depicts a side-by-side comparison of sociograms for the British Columbia interpersonal and inter-organizational networks, illus-trating that the inter-organizational network appears much more dense and interconnected than the interper-sonal network. Quantitatively, the density score was 0.003 for the interpersonal network (Table 2) and 0.020 for the inter-organizational network (Table 3).
identified 39 opinion-leading organizations, with in-degree centrality scores averaging about 2 for all or-ganizations and 6 for opinion-leading oror-ganizations. We also identified 50 boundary spanning organiza-tions, with an average betweenness centrality score of 13 for all organizations and 100 for boundary span-ning organizations.
A second similarity between the interpersonal and inter-organizational networks emerged in analysis of the data on health authority geography in each province and territory. At the province and territory level, inspection of socio-grams color-coded by health authority geography suggested that opinion-seeking individuals and organizations looked to others who are geographically proximate to them and
Table 1Response rates and descriptive statistics for survey participants [N(%), except where noted]
NS PE NB MB SK AB BC NT M Total
NLTC facilities 88 16 65 128 156 175 290 8 115.75 926
Responses 53 (60) 12 (75) 48 (74) 83 (65) 68 (44) 90 (51) 120 (41) 8 (100) 60.25 482 (52)
Gender
Women 44 (83) 9 (75) 40 (83) 65 (78) 58 (85) 70 (78) 96 (80) 4 (50) 48.25 386 (80)
Men 7 (13) 2 (17) 3 (6) 10 (12) 5 (7) 10 (11) 14 (12) 2 (25) 6.63 53 (11)
Missinga 2 (4) 1 (8) 5 (10) 8 (10) 5 (7) 10 (11) 10 (8) 2 (25) 5.38 43 (9)
Age
20–39 3 (6) 2 (17) 5 (10) 6 (7) 4 (6) 8 (9) 11 (9) 1 (13) 5.00 40 (8)
40–59 42 (79) 8 (67) 34 (71) 65 (78) 50 (74) 54 (60) 84 (70) 4 (50) 42.63 341 (71)
60+ 7 (13) 1 (8) 7 (15) 8 (10) 10 (15) 20 (22) 17 (14) 1 (13) 8.88 71 (15)
Missing 1 (2) 1 (8) 2 (4) 4 (5) 4 (6) 8 (9) 8 (7) 2 (25) 3.75 30 (6)
Education
Diploma/certificate 23 (43) 3 (25) 4 (8) 35 (42) 30 (44) 37 (41) 41 (34) 3 (38) 22.00 176 (37)
Bachelors 26 (49) 8 (67) 37 (77) 35 (42) 26 (38) 30 (33) 36 (30) 1 (13) 24.88 199 (41)
Graduate 3 (6) 0 5 (10) 9 (11) 5 (7) 15 (17) 33 (28) 2 (25) 9.00 72 (15)
Missing 1 (2) 1 (8) 2 (4) 4 (5) 7 (10) 8 (9) 10 (8) 2 (25) 4.38 35 (7)
Professional background
Nursing 51 (96) 11 (92) 47 (98) 64 (77) 48 (71) 69 (77) 87 (73) 4 (50) 47.63 381 (79)
Business 1 (2) 0 0 9 (11) 10 (15) 5 (6) 12 (10) 0 4.63 37 (8)
Other 0 0 0 6 (7) 6 (9) 8 (9) 13 (11) 2 (25) 4.38 35 (7)
Missing 1 (2) 1 (8) 1 (2) 4 (5) 4 (6) 8 (9) 8 (7) 2 (25) 3.63 29 (6)
Works at >1 facility
No 50 (94) 9 (75) 47 (98) 67 (81) 57 (84) 79 (88) 102 (85) 7 (88) 52.25 418 (87)
Yes 3 (6) 3 (25) 1 (2) 16 (19) 11 (16) 11 (12) 18 (15) 1 (13) 8.00 64 (13)
Missing 0 0 0 0 0 0 0 0 0 0
Facility managementb
Stand-alone 45 (85) 9 (75) 45 (94) 61 (73) 50 (74) 65 (72) 89 (74) 3 (38) 45.88 367 (76)
Co-located 8 (15) 3 (25) 3 (6) 21 (25) 18 (27) 25 (28) 31 (26) 5 (63) 14.25 114 (24)
Missing 0 0 0 1 (1) 0 0 0 0 0.13 1 (0)
Years worked [M (SD)]
In LTC 14.59 (9.80) 16.23 (10.05) 15.34 (9.24) 16.93 (11.47) 16.52 (9.43) 15.18 (10.63) 14.86 (9.61) 9.33 (11.15) 14.87 −
Missing 1 (2) 1 (8) 1 (2) 6 (7) 4 (6) 8 (9) 14 (12) 2 (25) 4.63 37 (8)
In current job 6.75 (7.28) 6.32 (5.88) 7.68 (4.95) 4.87 (4.19) 5.58 (6.31) 6.23 (11.77) 4.14 (3.38) 3.30 (3.52) 5.61 −
Missing 1 (2) 1 (8) 1 (2) 7 (8) 4 (6) 12 (13) 11 (9) 2 (25) 4.88 39 (8)
NSNova Scotia,PEPrince Edward Island,NBNew Brunswick,MBManitoba,SKSaskatchewan,ABAlberta,BCBritish Columbia,NTNorthwest Territories,LTC long-term care
a
The percentage of missing data for each variable was calculated by using as the denominator the total number of responses received in a particular geographic area. For example, the percentage of missing data for the gender variable in Nova Scotia was 2/53 = 4%
b
Refers to management model of participant’s primary facility.“Stand-alone”refers to a free-standing facility that has its own management staff, whereas“co-located”
within their same health authority. In Fig. 2, the sociogram of the British Columbia inter-organizational network in the right panel offers an example of the extent to which senior leaders look within their own health authority for models of care improvement. This result not only offers an import-ant insight for designing best practice dissemination initia-tives in Canadian long-term care but is also not surprising. Geographic proximity often plays an important role in the structuring of advice and other social networks in numer-ous contexts.
Limitations
These data embed some limitations. Two of Canada’s provinces (Ontario and Quebec) are not represented, re-sponse rate was partial, and data collection was cross-sectional. While partial response rate to a large voluntary survey can always be expected, partial response rates are cause for caution in interpreting social network analyses. Ontario and Quebec, the provinces not yet represented in
our data collection, are populous with many LTC facilities, so our structural understanding of advice seeking about LTC care improvement currently has this important limi-tation. We hope to address this deficiency in future waves of data collection. This would also enrich our cross-sectional first take at illuminating the structure of this relational network and how it may change as followers identify new opinion leaders; as individuals retire, relocate, and take on new jobs; and as organizations come and go.
As with any data collection procedure, certain aspects of our data are by-products of instrumentation. For example, the respondents were asked to name three individuals whose advice they most value and three LTC facilities whose example they follow, as the basis for social network analysis. In consequence, many four-node groups appear, and many nodes appear with three ties to others. Merely changing the instruction (to two or four) would have al-tered the results but not, we believe, in fundamental ways;
“top of the mind”nominations would likely stay the same.
Fig. 1Pan-Canadian inter-organizational network. Theblack circlesrepresent LTC facilities, and thegreenandpurple linesrepresent advice relationships
Social network data such as we have presented here show relationships among people and among organiza-tions as reported by the survey respondents. In socio-grams, the eye is often drawn to those nodes with many ties (high in-degree scores for opinion leaders). What is less obvious are relationships that do not exist in the data because they were not reported by the respondents. Absence of a tie between two nodes may result from lack of a relationship or from non-report of an existing relationship. Because response rate was partial and be-cause respondents could only report up to three individ-uals and three organizations, it is possible that many nodes not linked to each other in our data are in fact tied and that groups exhibiting “structural holes” be-tween them actually are tied. While the relational strata we do see in our data are arguably the most important, because the respondents were instructed to list those others whom they considered most valued, ours is pos-sibly a considerable under-reporting of the actual advice-seeking network for LTC improvement in Canada. This possibility is particularly so for those ad-vice sources who are not employed in LTC facilities but rather work as provincial administrators, health system directors, and quality assurance experts and in other non-LTC positions. Because these types of key individ-uals were not in our sampling frame, we have little
systematic information about them. Anecdotally, how-ever, we and our knowledge translation partners know or know of these individuals. Through their own information-sharing and advice-seeking behaviors, these authority figures may function to tie Canada’s LTC sec-tor together more strongly than Fig. 1 shows, at a cross-provincial supra-level that we cannot detect in the present data with our sampling frame.
Discussion
Transformative system change is necessary in Canada’s LTC sector, given the aging population, health trends of those individuals, and the resultant implications for health care costs. We believe that if informal opinion leaders work with formal sector leadership in considering best practice adoption and implementation, the care provided in Canadian LTC facilities can be transformed more rap-idly. Accordingly, in this study, we collected sociometric (“who-to-whom”) data from directors of care in Canadian LTC facilities in 11 of Canada’s 13 provinces and territor-ies. Our objective was to describe the extent and structure of advice-seeking networks among these facility directors. Our longer range intent is to combine these data about advice-seeking networks with knowledge translation strat-egies to accelerate the adoption of effective practices across Canada’s LTC facilities.
Table 2Measures for interpersonal advice network, by province and territory
NS PE NB MB SK AB BC NT M(SD) Total
Network Level
Nnodes 135 32 93 181 155 225 300 19 142.50 (95.03) 1140
Nadvice sources 101 25 73 116 103 153 211 12 99.25 (64.91) 794
Nadvice seekers 50 13 47 77 64 88 116 7 57.75 (36.78) 462
Nties 134 36 124 195 166 214 296 16 147.63 (92.22) 1181
Ninter-provincial ties 0 1 2 2 4 11 7 3 3.75 (3.62) 30
Density 0.007 0.036 0.014 0.006 0.007 0.004 0.003 0.047 0.016 (0.017)
In-degree centralization 0.08 0.13 0.07 0.06 0.05 0.02 0.02 0.19 0.08 (0.06)
Nodal level
In-degree centrality
Nopinion leadersa 2 1 5 6 12 14 9 1 6.25 (5.01) 50
In-degree, all nodes [M(SD)] 0.99 (1.18) 1.13 (1.01) 1.33 (1.42) 1.07 (1.61) 1.07 (1.32) 0.95 (1.01) 0.99 (1.03) 0.84 (0.96) 1.05 (0.14) In-degree, opinion leaders
[M(SD)]
8.00 (5.66) 5.00 (−) 6.00 (1.23) 8.33 (1.63) 4.75 (1.29) 4.00 (1.04) 5.00 (1.00) 4.00 (−) 5.64 (1.69)
Betweenness centrality
Nboundary spannersb 6 2 6 13 4 9 10 1 6.38 (4.10) 51
Betweenness centrality, all nodes [M(SD)]
0.50 (1.88) 1.28 (3.00) 7.05 (21.69) 0.24 (0.85) 0.27 (1.35) 0.29 (1.27) 0.42 (1.83) 0.11 (0.46) 1.27 (2.36)
Betweenness centrality, boundary spanners [M(SD)]
8.50 (2.59) 10.50 (0.71) 84.00 (22.65) 2.96 (1.22) 6.50 (5.74) 5.67 (2.83) 8.95 (4.34) 2.00 (−) 16.14 (27.58)
NSNova Scotia,PEPrince Edward Island,NBNew Brunswick,MBManitoba,SKSaskatchewan,ABAlberta,BCBritish Columbia,NTNorthwest Territories a
Opinion leaders were defined as all nodes with in-degree centrality scores of at least two standard deviations above the mean b
Our results suggest two main themes. First, physical proximity matters in LTC care improvement advice-seeking. Directors of care seek advice about care im-provement from those who are nearby, both in terms of being employed in the same city and region and in terms of working under the jurisdiction of the same health au-thority. A second, possible proximity effect may manifest in terms of LTC facility ownership, but this is less clear in our data than is grouping by co-location and by health authority. Our results suggest that even in the age of social media and ready online information, care pro-fessionals still look to credible others who tend to be physically nearby. Of course, even those whose are phys-ically proximate routinely communicate through text messaging, voice calls, Facebook posts, and email, enjoy-ing an electronic form of proximity in which accessibility occurs through social media [34].
A second theme in our results is that directors of care in LTC facilities learn about ways to improve
care both from conversation with and social modeling by individuals and from monitoring what other orga-nizations are doing and advocating. With this blended individual and organizational reference group, direc-tors of care can float the idea of adopting a new prac-tice in their LTC facilities, comparing how care is pursued in their facilities with the aspirational stand-ard of reference group facilities and recommendations. They do this through talk and messaging and observa-tion, as well as through looking to see how the new practice is being received by other organizations. Are they trying it? Do they think it is a good idea? The use of reference groups by individuals for help in de-ciding whether to try a new practice is a reason why we asked the respondents for several interpersonal ad-vice sources and several organizational adad-vice sources. Taken together, any one director of care’s answers gives us a glimpse of their reference group for issues of care improvement.
Table 3Measures for inter-organizational advice network, by province and territory
NS PE NB MB SK AB BC NT M (SD) Total
Network Level
Nnodes 80 20 59 133 119 151 217 13 99.00
(69.47) 792
Nadvice sources 66 16 52 99 85 103 158 8 73.38
(49.15) 587
Nadvice seekers 48 14 49 90 69 78 119 8 59.38
(37.55) 475
Nties 129 36 139 240 187 181 303 15 153.75
(96.74)
1230
Ninter-provincial ties 3 4 2 8 11 11 15 7 7.63
(4.53) 61
Density 0.020 0.095 0.041 0.014 0.013 0.008 0.006 0.096 0.037
(0.038)
In-degree centralization 0.07 0.18 0.13 0.10 0.11 0.03 0.03 0.26 0.11
(0.08) Nodal level
In-degree centrality
Nopinion leadersa 4 1 4 6 3 11 9 1 4.88
(3.60) 39
In-degree, all nodes[M (SD)] 1.61 (1.44) 1.80 (1.47) 2.36 (2.20) 1.81 (1.99) 1.60 (1.92) 1.20 (1.25) 1.40 (1.37) 1.15 (1.28) 1.62 (0.39) In-degree, opinion leaders[M (SD)] 5.75
(0.96) 5.00 (−) 8.75 (0.96) 8.17 (3.06) 10.33 (4.04) 4.36 (0.50) 5.56 (0.53) 4.00 (−) 6.49 (2.30) Betweenness centrality
Nboundary spannersb 7 2 3 9 5 6 16 2 6.25
(4.65) 50
Betweenness centrality, all nodes [M(SD)]
27.09 (57.38) 7.90 (11.88) 37.53 (67.65) 12.38 (26.45) 4.99 (16.50) 7.62 (22.76) 4.54 (10.40) 0.85 (2.08) 12.86 (12.75) Betweenness centrality, boundary
spanners [M(SD)]
185.38 (32.01) 36.25 (3.18) 274.44 (61.88) 94.94 (25.01) 67.00 (43.27) 101.25 (43.06) 35.53 (10.61) 5.50 (0.71) 100.04 (89.43) NSNova Scotia,PEPrince Edward Island,NBNew Brunswick,MBManitoba,SKSaskatchewan,ABAlberta,BCBritish Columbia,NTNorthwest Territories a
Opinion leaders were defined as all nodes with in-degree centrality scores of at least two standard deviations above the mean b
Table 4Professional roles for individuals in interpersonal advice network [N(%), except where noted]
NS PE NB MB SK AB BC NT M Total
Nindividuals in network 135 32 93 181 155 225 300 19 142.50 1140
Senior leadership position in an LTC facility (e.g., director
of care)a 81 (60) 18 (56) 58 (62) 113 (62) 90 (58) 125 (56) 160 (53) 7 (37) 81.50 652 (57)
Position in corporate level of an organization providing LTC 10 (7) 2 (6) 3 (3) 9 (5) 1 (1) 29 (13) 19 (6) 0 9.13 73 (6)
Chief executive officer/president/vice president 2 2 2 1 0 8 3 0 2.25 18
Quality improvement/clinical services 3 0 1 2 0 9 3 0 2.25 18
General director/regional leader 5 0 0 6 1 12 13 0 4.63 37
Position in regional health authority or government 12 (9) 7 (22) 5 (5) 34 (19) 43 (28) 43 (19) 54 (18) 5 (26) 25.38 203 (18)
Director, seniors health/continuing care 1 1 0 10 13 31 19 2 9.63 77
Director, education/best practice/ quality improvement 0 2 0 6 3 12 5 1 3.63 29
Manager, case coordination/care coordination/access 5 2 5 2 2 0 10 0 3.25 26
Licensing and review 1 0 0 3 0 0 9 0 1.63 13
Other 5 2 0 13 25 0 11 2 7.25 58
Other position/affiliation 32 (24) 5 (16) 27 (29) 25 (14) 21 (14) 28 (12) 67 (22) 7 (37) 26.50 212 (19)
Therapist, physical/occupational/ recreational 0 0 3 1 0 3 3 1 1.38 11
Mental health clinician, therapist/behavioral 6 0 2 1 0 3 6 2 2.50 20
Educator, best practice/clinical practice 3 0 1 4 4 2 9 0 2.88 23
Specialist, wound care/infection control 1 0 1 3 2 3 10 0 2.50 20
Clinician, physician/pharmacist/nurse 15 2 8 5 4 5 13 2 6.75 54
Other 7 3 12 11 11 12 26 2 10.50 84
NSNova Scotia,PEPrince Edward Island,NBNew Brunswick,MBManitoba,SKSaskatchewan,ABAlberta,BCBritish Columbia,NTNorthwest Territories,LTC long-term care
a
Percentages are provided for the four main categories of professional roles only, and not for the specific job titles
Fig. 2Interpersonal and inter-organizational networks in British Columbia. The interpersonal network (left) is color-coded by an individual’s
Our separation of interpersonal sources of advice from inter-organizational sources of advice highlights structural differences between them and variance across provinces. In general, we see higher degrees of integration (density) in our inter-organizational sociograms than we do with our interpersonal sociograms. Figure 2 gives an example of this general pattern that we see in our data for other provinces, too. At provincial levels, inter-organizational ties appear stronger than interpersonal ties, with fewer small groups of two, three, or four nodes that appear unconnected to larger advice-seeking structures. This makes sense; even if a dir-ector of care does not know a particular person at another LTC facility, she can still look to that facility as a source of ideas. The converse is very unlikely because directors of care will almost always know the organization to which an individual belongs. We believe that this is a novel operatio-nalization of social influence and one that in this case pro-duces findings that have high utility for decision-makers in the health system. Knowing which individuals and which organizations collectively are best positioned to help in a dissemination and change effort is quite advantageous. What we do not know from the present analysis is the strength of belief or credibility that advice seekers vest in individuals versus organization. This is an aim of our tan-dem qualitative study. Knowing a friend and colleague might be expected to outweigh the influence of knowing what an organization is doing because social exchanges carry unspecified obligations to one another [35] that can accumulate into strong trusting relationships [36].
We are working with our knowledge translation col-leagues in Canada’s provinces and territories to further in-terpret these results with the benefit of professional insight. We are also discussing ways in which LTC leaders
may find unique value in data such as these for their own purposes in training, continuing education, and strategic decision-making.
Conclusions
Our results suggest that a single advice-seeking network on the topic of improving resident care in long-term care (nursing home) facilities spans the nation of Canada. Advice-seeking relationships are relatively strong within province and weaker between province, with identifiable opinion leaders and boundary spanners. Proximity exhibits a strong effect on network structure, with provincial inter-organizational networks having more connections and thus a denser structure than interpersonal networks. We found credible individuals and organizations within groups (opin-ion leaders and opin(opin-ion-leading organizat(opin-ions) and individ-uals and organizations that function as weak ties across groups (boundary spanners and bridges) for all studied provinces and territories. Considerable influence in the Canadian long-term care sector rests with professionals such as provincial health administrators not employed in long-term care facilities. Taken together, these are nontrivial and actionable results for our goal of working collabora-tively with Canadian long-term care leaders to improve the state of practice in this critical sector.
Endnotes
1
http://www.interrai.org/home-care.html
Abbreviations
LTC:Long-term care; RAI: Resident Assessment Instrument; TREC: Translating Research in Elder Care
Table 5Owner-operator model and number of beds for LTC facilities in inter-organizational advice network [N(%)]
NS PE NB MB SK AB BC NT M Total
NLTC facilities in network 80 20 59 133 119 151 217 13 99.00 792
Owner-operator
Public not-for-profit 11 (14) 8 (40) 1 (2) 73 (55) 87 (73) 69 (46) 82 (38) 10 (77) 42.63 341 (43)
Private for-profit 38 (48) 8 (40) 0 17 (13) 4 (3) 46 (30) 60 (28) 0 21.63 173 (22)
Voluntary not-for-profit 30 (38) 2 (10) 1 (2) 40 (30) 24 (20) 32 (21) 61 (28) 0 23.75 190 (24)
Private not-for-profita NA NA 55 (93) NA NA NA NA NA 6.88 55 (7)
Missingb 1 (1) 2 (10) 2 (3) 3 (2) 4 (3) 4 (3) 14 (6) 3 (23) 4.13 33 (4)
No. Beds
0–79 44 (55) 9 (45) 41 (69) 74 (56) 87 (73) 73 (48) 76 (35) 7 (54) 51.38 411 (52)
80–120 15 (19) 1 (5) 5 (8) 24 (18) 13 (11) 21 (14) 60 (28) 0 17.38 139 (18)
>120 14 (18) 0 11 (19) 25 (19) 10 (8) 35 (23) 47 (22) 0 17.75 142 (18)
Missing 7 (9) 10 (50) 2 (3) 10 (8) 9 (8) 22 (15) 34 (16) 6 (46) 12.50 100 (13)
NSNova Scotia,PEPrince Edward Island,NBNew Brunswick,MBManitoba,SKSaskatchewan,ABAlberta,BCBritish Columbia,NTNorthwest Territories,LTC long-term care
a
Applicable to New Brunswick only b
Acknowledgements
We thank Charlotte Berendonk of the University of Alberta and Sacha Nadeau of Mount Saint Vincent University for assisting with data collection, Joe Welsh of Michigan State University for preparing Fig. 1, Pamela Fancey of the Nova Scotia Centre on Aging for providing information on Canadian long-term care, and Cathy McPhalen of thINK Editing Inc. for editing the final version of the manuscript. We are indebted to our practitioner partners and collaborators across Canada’s LTC sector who advised us regarding survey development and administration and in the interpretation of results.
Funding
This study was funded by the Canadian Institutes of Health Research, Partnerships for Health System Improvement (MOP #318861). Additional partner funding was provided by the Nova Scotia Health Research Foundation, Alberta Innovates Health Solutions, the Michael Smith Foundation for Health Research, and Research Manitoba.
Availability of data and materials
The data supporting the conclusions of this article are housed in the secure and confidential Health Research Data Repository (HRDR) in the Faculty of Nursing at the University of Alberta (https://uofa.ualberta.ca/nursing/ research/research-supports-and-services/hrdr), in accordance with the health privacy legislation of participating TREC jurisdictions. Data specific to this manuscript can be requested through the TREC Data Management Committee ([email protected]) on the condition that researchers meet and comply with the TREC, HRDR, and provincial data confidentiality policies.
Authors’contributions
JWD, WBB, JMK, JES, HC, JLB, JKS, PGN, and CAE contributed to the conception and design of the study. CAE and JMK secured the CIHR funding, and with assistance of key team members in the provinces, secured the partner funds. JWD, SAC, WBB, JMK, JES, JLB, PGN, and CAE collaborated on the data acquisition, and SAC oversaw the data cleaning. AMB conducted the data analysis in consultation with JWD, SAC, and JM. All authors contributed to the conceptual discussions and interpretation of the analytic results, and JWD and AMB wrote the manuscript based on these discussions. WBB provided substantive edits, and JM, JMK, MBD, JES, DT, RCR, GGC, and JKS also provided detailed editorial revisions. All authors read and approved the final manuscript.
Competing interests
The authors declare that they have no competing interests.
Consent for publication Not applicable.
Ethics approval
We obtained ethics approval for the study from all participating Canadian universities (University of Alberta, Pro00050958; University of British Columbia, H14-02543; University of Saskatchewan, 14-370; University of Manitoba, H2014:370; Mount Saint Vincent University, 2014:043). We also received ethics and operational approvals and research licenses from all participating provincial and territorial health authorities.
Author details
1Department of Communication, Michigan State University, Suite 473, 404
Wilson Road, East Lansing, MI 48824-1212, USA.2Faculty of Nursing,
University of Alberta, Edmonton, Alberta, Canada.3Dalla Lana School of
Public Health, University of Toronto, Toronto, Ontario, Canada.4Nova Scotia Centre on Aging, Mount Saint Vincent University, Halifax, Nova Scotia, Canada.5School of Nursing, University of Ottawa, Ottawa, Ontario, Canada. 6Manitoba Center for Health Policy, University of Manitoba, Winnipeg,
Canada.7Research Department, Interior Health Authority, Kelowna, British Columbia, Canada.8School of Health and Exercise Sciences, University of
British Columbia Okanagan, Kelowna, British Columbia, Canada.9Hospitals
and Communities Integrated Services, Interior Health Authority, Kelowna, British Columbia, Canada.10School of Nursing, University of British Columbia, Vancouver, British Columbia, Canada.11Faculty of Health Disciplines,
Athabasca University, Athabasca, Alberta, Canada.12Department of Family
Medicine, University of Calgary, Calgary, Alberta, Canada.
Received: 29 October 2016 Accepted: 25 January 2017
References
1. Rogers EM. Diffusion of innovations. 5th ed. New York: Free Press; 2003. 2. Wejnert B. Integrating models of diffusion of innovations: a conceptual
framework. Annu Rev Sociol. 2002;28:297–326.
3. Greenhalgh T, Robert G, Bate P, Macfarlane F, Kyriakidou O. Diffusion of innovations in health service organisations: a systematic literature review. Malden: Blackwell; 2005.
4. Coleman JS, Katz E, Menzel H. The diffusion of an innovation among physicians. Sociometry. 1957;20:253–70.
5. Palinkas L, Holloway I, Rice E, Fuentes D, Wu Q, Chamberlain P. Social networks and implementation of evidence-based practices in public youth-serving systems: a mixed-methods study. Implement Sci. 2011;6:113. 6. Cho Y, Hwang J, Lee D. Identification of effective opinion leaders in the
diffusion of technological innovation: a social network approach. Technol Forecast Soc Chang. 2012;79:97–106.
7. Sibthorpe B, Glasgow N, Wells R. Emergent themes in the sustainability of primary health care innovation. Med J Aust. 2005;183:S77.
8. Jippes E, Achterkamp M, Brand P, Kiewiet D, Pols J, vanEngelen J. Disseminating educational innovations in health care practice: training versus social networks. Soc Sci Med. 2010;70:1509–17.
9. West E, Barron D, Dowsett J, Newton J. Hierarchies and cliques in the social networks of health care professionals: implications for the design of dissemination strategies. Soc Sci Med. 1999;48:633–46.
10. Dearing J. Applying diffusion of innovation theory to intervention development. Res Soc Work Pract. 2009;19:503–18.
11. Katz E, Lazarsfeld PF. Personal influence: the part played by people in the flow of mass communication. Glencoe: The Free Press; 1955.
12. Rogers E, Cartano D. Methods of measuring opinion leadership. Public Opin Q. 1962;26:435-41.
13. Dearing J, Smith D, Larson R, Estabrooks C. Designing for diffusion of a biomedical intervention. Am J Prev Med. 2013;44:S70–6.
14. Rogers E, Bhowmik D. Homophily-heterophily: relational concepts for communication research. Public Opin Q. 1970;34:523–38.
15. Weimann G. The influentials: people who influence people. Albany: SUNY Press; 1994.
16. Flodgren G, Parmelli E, Doumit G, Gattellari M, O’Brien MA, Grimshaw J, Eccles MP. Local opinion leaders: effects on professional practice and health care outcomes. Cochrane Database Syst Rev. 2011;8.
17. Valente TW. Network interventions. Science. 2012;337:49–53. 18. Berta W, Virani T, Bajnok I, Edwards N, Rowan M. Understanding whole
systems change in health care: Insights into system level diffusion from nursing service delivery innovations—a multiple case study. Evid Policy. 2014;10:313–36.
19. MacDonald M. Regulating individual charges for long-term residential care in Canada. Stud Polit Econ. 2015;95:83–114.
20. Faust K. Animal social networks. In: Scott J, Carrington PJ, editors. The SAGE handbook of social network analysis. London: SAGE Publications; 2011. p. 148–66. 21. Canada S. Population projections for Canada, provinces and territories 2009
to 2036. Ottawa: Minister of Industry; 2010.
22. Hirdes J, Mitchell L, Maxwell C, White N. Beyond the‘iron lungs of gerontology’: using evidence to shape the future of nursing homes in Canada. Can J Aging. 2011;30:371–90.
23. Estabrooks C, Squires J, Cummings G, Teare G, Norton P. Study protocol for the Translating Research in Elder Care (TREC): building context—an organizational monitoring program in long-term care project (project one). Implement Sci. 2009;4:52.
24. Estabrooks C, Hutchinson A, Squires J, Birdsell J, Cummings G, Degner L, Morgan D, Norton P. Translating research in elder care: an introduction to a study protocol series. Implement Sci. 2009;4:51.
25. Rycroft-Malone J, Dopson S, Degner L, Hutchinson A, Morgan D, Stewart N, Estabrooks C. Study protocol for the Translating Research in Elder Care (TREC): building context through case studies in long-term care project (project two). Implement Sci. 2009;4:53.
26. Hyman H, Singer E. Readings in reference group theory and research. New York: Free Press; 1968.
28. Dillman DA, Smyth JD, Christian LM. Internet, mail, and mixed-mode surveys: the tailored design method. 3rd ed. Hoboken: John Wiley & Sons; 2009. 29. Wasserman S, Faust K. Social network analysis: methods and applications.
Cambridge: Cambridge University Press; 1994.
30. Newman MEJ. Networks: an introduction. Oxford: Oxford University Press; 2010. 31. Valente TW. Social networks and health: models, methods, and applications.
New York: Oxford University Press; 2010.
32. Valente T, Pumpuang P. Identifying opinion leaders to promote behavior change. Health Educ Behav. 2007;34:881–96.
33. Burt RS. Structural holes. Cambridge: Harvard University Press; 1992. 34. Monge PR, Contractor NS. Theories of communication networks. Oxford:
Oxford University Press; 2003.
35. Blau P. Exchange and power in social life. New York: Wiley; 1964. 36. Ring P. Processes facilitating reliance on trust in inter-organizational
networks. In: Ebers M, editor. The formation of inter-organizational networks. Oxford: Oxford University Press; 2002. p. 113–45.
• We accept pre-submission inquiries
• Our selector tool helps you to find the most relevant journal
• We provide round the clock customer support
• Convenient online submission
• Thorough peer review
• Inclusion in PubMed and all major indexing services
• Maximum visibility for your research
Submit your manuscript at www.biomedcentral.com/submit
![Table 1 Response rates and descriptive statistics for survey participants [N (%), except where noted]](https://thumb-us.123doks.com/thumbv2/123dok_us/658320.1561900/6.595.59.538.98.591/table-response-rates-descriptive-statistics-survey-participants-noted.webp)
![Table 4 Professional roles for individuals in interpersonal advice network [N (%), except where noted]](https://thumb-us.123doks.com/thumbv2/123dok_us/658320.1561900/10.595.58.541.467.683/table-professional-roles-individuals-interpersonal-advice-network-noted.webp)
![Table 5 Owner-operator model and number of beds for LTC facilities in inter-organizational advice network [N (%)]](https://thumb-us.123doks.com/thumbv2/123dok_us/658320.1561900/11.595.64.539.99.280/table-owner-operator-number-facilities-organizational-advice-network.webp)
