www.solid-earth.net/5/537/2014/ doi:10.5194/se-5-537-2014
© Author(s) 2014. CC Attribution 3.0 License.
Testing the effects of basic numerical implementations of water
migration on models of subduction dynamics
M. E. T. Quinquis1and S. J. H. Buiter1,2
1Geodynamics Team, Geological Survey of Norway (NGU), Trondheim, Norway 2Centre for Earth Evolution and Dynamics, University of Oslo, Oslo, Norway Correspondence to: M. E. T. Quinquis ([email protected])
Received: 23 September 2013 – Published in Solid Earth Discuss.: 24 October 2013 Revised: 28 April 2014 – Accepted: 5 May 2014 – Published: 26 June 2014
Abstract. Subduction of oceanic lithosphere brings water into the Earth’s upper mantle. Previous numerical studies have shown how slab dehydration and mantle hydration can impact the dynamics of a subduction system by allowing a more vigorous mantle flow and promoting localisation of de-formation in the lithosphere and mantle. The depths at which dehydration reactions occur in the hydrated portions of the slab are well constrained in these models by thermodynamic calculations. However, computational models use different numerical schemes to simulate the migration of free water. We aim to show the influence of the numerical scheme of free water migration on the dynamics of the upper mantle and more specifically the mantle wedge. We investigate the fol-lowing three simple migration schemes with a finite-element model: (1) element-wise vertical migration of free water, oc-curring independent of the flow of the solid phase; (2) an imposed vertical free water velocity; and (3) a Darcy veloc-ity, where the free water velocity is a function of the pres-sure gradient caused by the difference in density between water and the surrounding rocks. In addition, the flow of the solid material field also moves the free water in the imposed vertical velocity and Darcy schemes. We first test the influ-ence of the water migration scheme using a simple model that simulates the sinking of a cold, hydrated cylinder into a dry, warm mantle. We find that the free water migration scheme has only a limited impact on the water distribution af-ter 1 Myr in these models. We next investigate slab dehydra-tion and mantle hydradehydra-tion with a thermomechanical subduc-tion model that includes brittle behaviour and viscous water-dependent creep flow laws. Our models demonstrate that the bound water distribution is not greatly influenced by the wa-ter migration scheme whereas the free wawa-ter distribution is.
We find that a bound water-dependent creep flow law results in a broader area of hydration in the mantle wedge, which feeds back to the dynamics of the system by the associated weakening. This finding underlines the importance of using dynamic time evolution models to investigate the effects of (de)hydration. We also show that hydrated material can be transported down to the base of the upper mantle at 670 km. Although (de)hydration processes influence subduction dy-namics, we find that the exact numerical implementation of free water migration is not important in the basic schemes we investigated. A simple implementation of water migra-tion could be sufficient for a first-order impression of the ef-fects of water for studies that focus on large-scale features of subduction dynamics.
1 Introduction
The subducting crust carries water in two phases: (1) free fluids that are contained in the porosity of the rock and can percolate along grain boundaries (Stern, 2002; Bercovici and Karato, 2003; Wark et al., 2003; Rüpke et al., 2004; Chea-dle et al., 2004) and (2) mineralogically bound fluids in the form of hydroxyl complexes (OH) (Schmidt and Poli, 1998; Hirschmann, 2006). Once a slab starts to subduct, it under-goes dehydration processes due to the increase in pressure and temperature. Most of the water contained in the porosity of the sediments is expelled near the trench through com-paction and is not transported into the mantle. This is known as fore arc volatile discharge (Stern, 2002; Rüpke et al., 2004). Hydrated minerals include, among others, amphi-boles, chlorite and serpentine. It has been well documented that mineralogically bound water is released when hydrated minerals undergo certain phase transitions (Schmidt and Poli, 1998; Iwamori, 1998; Kerrick and Connolly, 2001; Hacker et al., 2003; Ohtani et al., 2004; Rüpke et al., 2004; Syra-cus and Abers, 2006; Hirschmann, 2006). At the same time, experimentally determined phase diagrams suggest that min-eralogically bound water can be transported to the base of the upper mantle, or perhaps even greater depths (Iwamori, 1998; Schmidt and Poli, 1998; Stern, 2002; Ohtani et al., 2004).
Dehydration processes can influence subduction in multi-ple ways. For exammulti-ple, the depth at which major dehydra-tion occurs determines the locadehydra-tion of volcanic arcs, which are located ca. 110–120 km above the surface of subducted slabs (England et al., 2004; Syracus and Abers, 2006). It is the melting of mantle wedge materials that is thought to lead to arc volcanism. But water released from the subducting slab decreases the pressure and temperature at which melting oc-curs, thus enhancing mantle wedge melting and causing vol-canism. Mantle material that is hydrated by water released from the slab may also form weak, positively buoyant “wet plumes” that rise upwards and efficiently hydrate the man-tle wedge (Billen and Gurnis, 2001; Billen, 2008; Gorczyk et al., 2007; Richard and Iwamori, 2010). These fluids can then cause a more vigorous flow in the mantle wedge. Ar-cay et al. (2005) showed that mantle wedge hydration can re-sult in thermal erosion and softening of the overriding litho-sphere.
Once subduction has started, (de)hydration processes may further influence the evolution of subduction by enforcing an asymmetrical geometry of subduction zones, causing sub-duction to be one-sided (Gerya et al., 2008). Dehydration processes can in addition aid the exhumation of high- and ultrahigh-pressure metamorphic rocks by creating a wide and weak subduction channel through which rocks are exhumed (Gerya et al., 2002). Dehydration of the subducting slab may in turn increase slab strength, but this effect may be over-whelmed by the strong impact of water on the mantle wedge. The models mentioned above use similar methods to de-termine the conditions of pressure and temperature at which dehydration processes occur. These are usually based on
thermodynamic calculations (de Capitani and Brown, 1987; Holland and Powell, 1998; Powell et al., 1998; Connolly, 2005) or high-pressure experiments (Schmidt and Poli, 1998; Ohtani et al., 2004; Komabayashi et al., 2005; Iwamori, 2007), and the locations of the dehydration fronts during sub-duction do not greatly vary between models.
Water migration can be described by two-phase flow con-servation equations (Spiegelman , 1993a, b; Bercovici et al., 2001). However, these are not routinely used in numerical simulations of subduction zone dynamics at the scale of the upper mantle as it adds a fairly complex set of equations to an already highly non-linear model. Usually simplifications are therefore made to migrate water in large-scale subduction models.
Bound water is advected along the solid flow field. Bound water can in addition be affected by diffusion mechanisms which allow water to migrate through the solid-phase field as a function of the chemical and temperature gradients (Richard et al., 2006). Because we focus on first-order be-haviour of free water migration on subduction dynamics, we keep our models relatively simple and neglect the effect of bound water diffusion. Free water can migrate in the inter-connected pore space of the solid phase (Stern, 2002; Wark et al., 2003; Cheadle et al., 2004; Rüpke et al., 2004), create its own hydrated channels (Katz et al., 2006), or be absorbed by non-saturated rocks of the mantle wedge (Iwamori, 1998) to be potentially transported with the mantle flow into the lower mantle (Bercovici and Karato, 2003; Iwamori, 2007; Richard and Bercovici, 2009; Fujita and Ogawa, 2013). Free water is also advected by the solid flow field through which it migrates, and this can result in cases where part of the free water migrates up through the mantle wedge while the rest is carried with the solid flow and subducted into the mantle (Cagnioncle et al., 2007).
Numerical studies of hydration of the mantle by slab de-hydration have used different simplified numerical approxi-mations for the migration of free water in the mantle:
I Free water migrates vertically in the upper mantle and is not coupled to the solid-phase flow in the mantle wedge (Arcay et al., 2005).
II The migration of free water is vertical but coupled to the mantle flow. The effective migration path of water is therefore no longer purely vertical, but can include a horizontal component. This method has been imple-mented as an imposed vertical velocity added to the ve-locity of the solid-phase flow (Gorczyk et al., 2007) or as a dehydration front with an imposed horizontal and vertical velocity (Gerya et al., 2002).
2007). Also here the solid flow phase may advect free water in addition to the Darcy mechanism.
Studies that use the above water migration schemes show differences in the spatial distribution of hydrated material in the mantle wedge as subduction evolves (Arcay et al., 2005; Gerya et al., 2002; Gorczyk et al., 2007; Cagnioncle et al., 2007). However, as the numerical setup of the subduction models also differs between these studies, it is difficult to evaluate the possible effects of the numerical implementation of water migration. So far, the influence of the basic numeri-cal implementation of water migration on the dynamics of a subduction model has not been investigated.
We aim to investigate the effects of the three numerical water migration schemes described above (schemes I, II and III) on the dynamics of a subducting slab and its overlying mantle wedge. These models are kept simple, allowing us to focus on the first-order effects of dehydration and water mi-gration. Therefore our models do not include melting, shear heating or adiabatic heating. We first illustrate the effects of dehydration and water migration for a simple model of a cold and hydrated cylinder sinking in a warm mantle. Our second series of models examines the effects of (de)hydration and water migration on a thermo-mechanical subduction model at the scale of the upper mantle.
2 Modelling approach
2.1 Thermo-mechanical equations
We solve the equations for conservation of mass (assuming incompressibility) (Eq. 1), momentum (Eq. 2) and energy (Eq. 3):
∇ ·v=0, (1)
− ∇P+ ∇ · ¯σ0+ρg=0, (2)
ρCp
∂T ∂t =k∇
2T −ρC
pv· ∇T+H; (3)
v is the velocity vector,ρ density,t time,P pressure (mean stress), σ¯0 the deviatoric stress tensor, g gravitational ac-celeration (gx=0 andgy= −9.81 m s−2),Cpspecific heat,
T temperature, k thermal conductivity, and H radioactive heat production per unit volume. In the subduction mod-els, the Boussinesq approximation is assumed, i.e. ∂ρ∂t =0 butρ=ρ0(1−α(T−T0)), whereρ0is the reference density atT =T0andαis the volumetric thermal expansion coeffi-cient.
Materials are either viscous or brittle. Our viscous rheolo-gies are linear or pressure- and temperature-dependent:
ηdf,ds= 1 2
dp
A CrOH
n1
˙
εe01−nn e
Q+P V nRT
; (4)
˙
εe0 is the effective deviatoric strain rate (ε˙e0=(12ε˙0ijε˙ij0 )12),A
a material constant,nthe power law stress exponent,dgrain
size, p grain size exponent, COH water content in ppm, r the water content exponent,Qactivation energy,V activa-tion volume andRthe molar gas constant. df and ds refer to deformation by diffusion creep (p >0 and n=1) and dis-location creep (p=0 andn >1) respectively. Diffusion and dislocation creep are assumed to act in parallel in all mate-rials, resulting in a composite viscosity (ηcomp) (Karato and Li, 1992; van den Berg et al., 1993):
ηcomp=
1
ηds + 1
ηdf
−1
. (5)
In our models, only bound water influences the viscosity and we only consider the impact of water on sub-crustal mate-rials. A water content of 0.4 wt % results in a viscosity de-crease by ca. 2 orders of magnitude when using the dis-location or diffusion creep flow law for wet olivine from Hirth and Kohlstedt (2003). This can result in viscosities that are lower than the minimum viscosity of 1018 Pa s which is imposed in our models. We therefore assume that viscos-ity no longer decreases further once water content exceeds 0.4 wt %.
Brittle behaviour in the subduction models follows a Drüker–Prager criterion (Handin, 1969; Jaeger and Cook, 1976; Twiss and Moores, 1992):
σe0=Psinφ+Ccosφ; (6)
σe0is the effective deviatoric shear stress (σe0=(12σij0σij0)12),
φthe angle of internal friction, andC the cohesion.φ un-dergoes a linear decrease with total effective plastic strain (measured as the square root of the second invariant of the strain tensor) to simulate strain weakening. Such strain weak-ening is thought to result from a reduction in fault rock grain size (Handy et al., 2007), mineral transformations (White and Knipe, 1978; Tingle et al., 1993) or the development of foli-ation or high fluid pressures (Hubbert and Rubey, 1959; Sib-son, 1977). The effective viscosity for plastic flow is (Lemi-ale et al., 2008)
ηp=
Psinφ+Ccosφ 2ε˙0
e
. (7)
Temperature (oC)
Pressure (GPa)
200 400 600 800 1000 1
2 3 4 5 6
BOC wt.% water
0 1 2 3 4 5 6 7
Temperature (oC)
Pressure (GPa)
200 400 600 800 1000 1
2 3 4 5 6
SHB wt.% water
0 1 2 3 4 5 6 7
a)
b)
Figure 1. Water content as a function of pressure and temperature
calculated using Perple_X for (A) bulk oceanic crust, and (B) ser-pentinised harzburgite lithologies (Chemia et al., 2010). Bulk com-positions are given in Table 1.
material field (through a material identifier) and properties such as particle strain, stress and water content. The particles are advected with the solid flow field using a second-order Runge–Kutta scheme. We use harmonic viscosity averaging and arithmetic density averaging schemes from particles to elements (Schmeling et al., 2008). The subduction models have a free surface and we use the surface stabilisation algo-rithm of Kaus et al. (2010) and Quinquis et al. (2011). 2.2 Calculation of water content
Our subduction model includes three lithologies: a bulk oceanic crust (BOC), serpentinised harzburgite (SHB) for the lithospheric mantle (Chemia et al., 2010), and pyrolite for the sub-SHB mantle (Schmidt and Poli, 1998). Water con-tent is determined in wt% as a function of pressure, tempera-ture and bulk composition (i.e. the average chemical compo-sition of each lithology, Table 1). The water contents of BOC and SHB are calculated using Perple_X (Connolly, 2005) by Chemia et al. (2010) (Fig. 1). Perple_X is a thermody-namic code that minimises the Gibbs free energy of a chem-ical system to determine the stability fields of the phases which compose the mineral assemblages. Once these stabil-ity fields are calculated, it is possible to determine the max-imum allowed water content of each phase as a function of pressure and temperature. The thermodynamic calculations
Table 1. Bulk compositions in percent for the lithological oceanic
lithosphere model (Chemia et al., 2010).
Oxides BOC SHB
SiO2 47.32 41.023
TiO2 0.63 0.075
Al2O3 16.11 1.114
FeO 7.21 7.66
MgO 9.27 42.298
CaO 12.17 1.029
Na2O 1.65 –
H2O 2.68 6.8
CO2 2.95 –
Total 99.99 99.999
of Perple_X are valid up to pressures of 7 GPa and temper-atures of 1300◦C and therefore do not cover upper-mantle
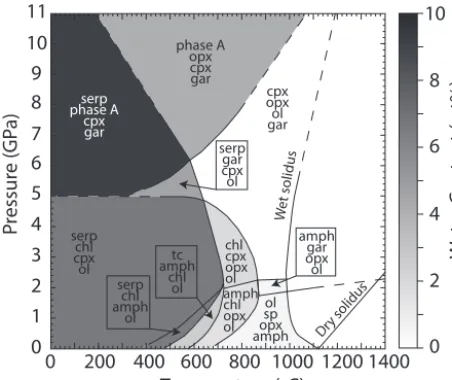
conditions. We base our water contents in the upper mantle on Schmidt and Poli (1998), who experimentally determined water storage capacity for pyrolite up to 8 GPa and 1100◦C. We extrapolate these data to 11 GPa and 1400◦C by linearly continuing the Clapeyron slopes of the stability fields, sim-ilar to Arcay et al. (2005) (Fig. 2). Serpentinisation of the mantle wedge can locally increase the water storage capac-ity up to 7 wt% H2O (Iwamori, 1998; Rüpke et al., 2004; Connolly, 2005; Férot and Bolfan-Casanova, 2012). We fur-thermore assume that the water storage capacity in the sub-lithospheric mantle (i.e. the pyrolytic material) does not con-verge to zero as shown by the phase diagrams determined by Schmidt and Poli (1998) because this would not allow the transport of bound water into the upper mantle. We impose the minimum storage capacity of the mantle to be 0.2 wt%, following Bercovici and Karato (2003) (Fig. 2).
2.3 Water migration schemes
chl cpx opx ol amph chl opx ol serp phase A cpx gar phase A opx cpx gar cpx opx ol gar serp chl cpx ol serp gar cpx ol amph gar opx ol ol sp opx amph tc amph chl ol serp chl amph ol 10 8 6 4 2 0 W at er C on ten t (wt%) Pr essur e ( GP a) Temperature (ºC) 11 10 9 8 7 6 5 4 3 2 1 0
0 200 400 600 800 1000 1200 1400
Dry solidus
Wet solidus
Figure 2. Water content as a function of pressure and
tempera-ture for mantle material of pyrolytic composition, modified from Schmidt and Poli (1998). The solid lines are experimentally deter-mined Clapeyron slopes (Schmidt and Poli, 1998), while the dashed lines have been extrapolated in a similar manner to Arcay et al. (2005). amph: amphibole; chl: chlorite; cpx: clinopyroxene; gar: garnet; opx: ortopyroxene; ol: olivine; serp: serpentine; sp: spinel; and tc: talc.
capacity, the particle is undersaturated and no free water is produced. If the mineralogically bound water of the particle exceeds the water storage capacity, it is oversaturated in wa-ter and dehydration occurs. The amount of free wawa-ter is the difference between the mineralogically bound water of the particle and the maximum allowed water. The free water mi-grates through the model following one of the schemes we are investigating.
The first migration scheme (scheme I) assumes that free water moves vertically upwards owing to its negative buoy-ancy, with one element per time step (1t), and is not affected by the solid-phase flow (Arcay et al., 2005). This implies that the water migration velocity is purely vertical and is imposed as the local vertical grid size divided by the time step. A model using a variable grid size would not have a constant free water velocity, and therefore this should be avoided. If free water is present, undersaturated particles in the current element are hydrated first. If free water remains after this first step, it migrates to the element above; there it hydrates the undersaturated particles of that element from the bottom up. If all particles are saturated and free water is still present, it is evenly distributed over all particles of the element, waiting for the next time step for further upward migration.
The second migration scheme (scheme II) imposes the ve-locity for free water (vf,x andvf,y) (Gorczyk et al., 2007).
This method reduces the grid dependence of the migration scheme, though does not eliminate it completely as the mi-gration path itself is grid-dependent. When a particle is
over-1 2 3 4 6 5 Eulerian grid Particles Vf Vf,y Vf,x Oversaturated Undersaturated Saturated Hydrated elements
Figure 3. Schematic migration of free water and its distribution
along a prescribed path for our velocity controlled water migration schemes II and III (see text for further explanation).Vfis water ve-locity.
saturated, it releases water distributed along the path defined byvf×1t (Fig. 3). The horizontal and vertical components of the solid flow phase are added to the respective compo-nents of the free water velocity. Migration of free water is therefore no longer necessarily vertical. As in the case of the migration scheme I, the first step is to hydrate undersaturated particles in the current element. If free water is still present after this step, the remaining free water migrates to the next element, saturating the undersaturated particles from the bot-tom up, and so on. If all particles along the migration path of this time step are saturated (i.e. all particles in elements 1 to 6 of Fig. 3), the remaining water is distributed evenly over all particles of the last element. The motivation for element-wise distribution is that water migration paths are likely irregular and a linear path for free water would be unlikely (Rüpke et al., 2004; Katz et al., 2006). We only show examples with an imposed vertical velocity andvf,x=0.
The third migration scheme (scheme III) follows a sim-plification of Darcy flow where the fluid follows the pressure gradient caused by the difference in density between the fluid and the solid it is percolating through (Turcotte and Schubert, 2002):
q=(ρs−ρf)gκ
ηf
, (8)
−1e+07
−1e+07
−1e+07 −8e+06
−8e+06
−6e+06
−6e+06 −6e+06
−6e+06
−4e+0 6
−4e+06
−4e+06
−2e+06
−2e+06 −2e+06
−2e+06
0
0
0
0
0 0
2e+06
2e+0 6
4e+066e+068e+061e+07
1300 1350 1400
−100 −50 0
Water Content (wt%)
Depth (km)
X (km)
0 1 2 3 4 5
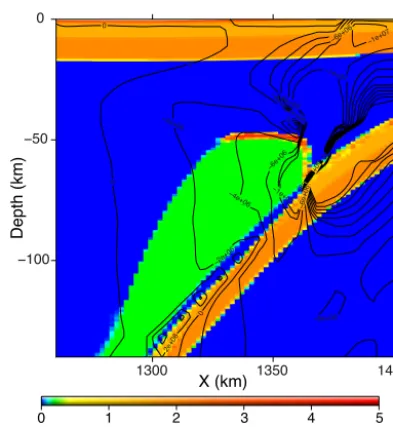
Figure 4. A close-up of the mantle wedge region at 5 Myr in a
sub-duction model that uses free water migration scheme I in which vis-cosity decreases with bound water content. Shown is the elemental bound water content with contours at every 2 MPa of the horizontal pressure difference, dPdx. Horizontal pressure variations are low in the region with highest bound water content.
(2003): κ=d
283
270 , (9)
where8is the volume fraction of fluid andd the grain size (same as in Eq. 4). The fluid velocity is the sum of the Darcy velocity relative to the volume fraction of fluid and the solid velocity:
vf =
q
8+vs, (10)
wherevf is the fluid velocity andvsthe solid-phase velocity.
The water migration and distribution then follow scheme II. We assume, however, that water migration in scheme III is vertical. This assumption (also previously made by (Cagnioncle et al., 2007)) is reasonable, as the horizon-tal pressure gradient in our models in the mantle wedge is much smaller than the vertical pressure gradient (Fig. 4). 8, the volume fraction of fluid, is determined from the ini-tial water content and the grids for pressure, temperature and wt% H2O. However, this assumes that all the free wa-ter that is present in inwa-terconnected channels is used to cal-culate the fluid velocity (Eqs. 8–10). This would result in unnaturally high fluid velocities. We therefore introduce an efficiency factor,ω, that corresponds to the percentage of in-terconnected channels of the network through which water can migrate. The effective permeability in Eq. 8 then be-comes κe=ωκ. This reduces the effective fluid velocity as
water can only migrate through the interconnected network.
The Darcy water velocity is calculated for every particle of the model. The water velocity is not constant throughout the model, and areas with higher water content have higher water migration velocities.
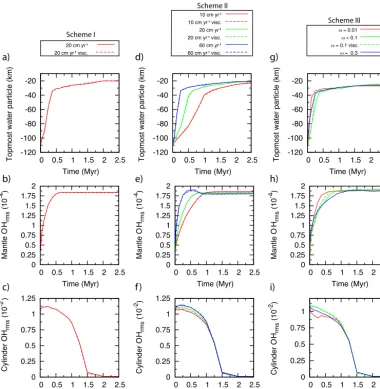
We use the following output values to quantify the influ-ence of the water migration schemes on the water distribution and the dynamic evolution of the models: (1) the water dis-tribution is described by tracking the depths of the top-most, lower-most, and left- and rightmost particles of hydrated ma-terial. The top hydrated particle gives insight into the rate of advancement of the hydration front, which is not necessarily the same as the imposed water migration velocity. For ex-ample, assuming a high water migration velocity and a low amount of free water, free water will first saturate undersat-urated materials, resulting in an effectively lower velocity of the hydration front. (2) The root-mean-square water contents (OHrms) for slab or cylinder and the mantle provide informa-tion on the rate of dehydrainforma-tion of the slab or cylinder and the rate of hydration of the mantle. This gives the average water content over various domains in the model (e.g. in the mantle or in the slab)
OHrms= 1 A
v u u t Z
y Z
x
(OH2f+OH2b) dx dy, (11)
where OHbis the bound water content, OHf is the free wa-ter content, andAis the area of computation. (3) For sinking cylinder models in which viscosity depends on water con-tent, the bottom-most particle of the subducting cylinder is also tracked. This shows the influence of water content on the dynamic evolution of the model.
3 The effects of (de)hydration on a simple model of a sinking wet cylinder
3.1 Simple model of a sinking cylinder
We first investigate the effects of (de)hydration and water mi-gration with a simple model which simulates the subduction of a detached piece of lithosphere by the sinking of a cold, hydrated cylinder into a warm, dry mantle. These experi-ments are based on simple Stokes flow and use linearly vis-cous rheologies. We solve for the advection and conduction of temperature in addition to the mechanical flow, but the temperature does not play a role in the mechanical flow as viscosities are linear viscous.
150 300 0
0
-58
-130
-300
X (km)
Y (km)
0 400 800 1200
−300 −200 −100 0
Temperature (ºC)
Depth (km)
b) Geotherm a)
Lithosphere
Cylinder
Mantle
Figure 5. (A) Model setup for a cold, hydrated cylinder sinking in a warm, dry mantle. All materials are linear viscous, and their rheological
parameters are given in Table 2. (B) Initial geotherm for model in (A).
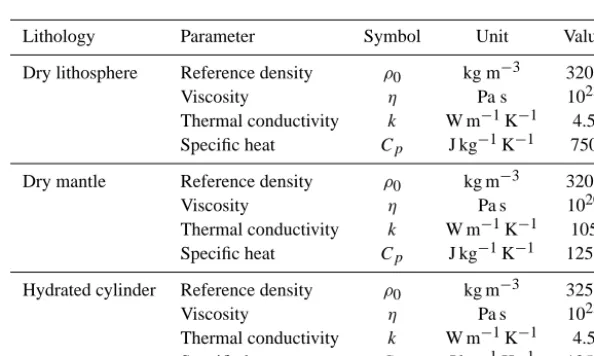
Table 2. Input parameters for the linear viscous sinking cylinder model. For all materials thermal expansivityα=0 and heat production H =0.
Lithology Parameter Symbol Unit Value
Dry lithosphere Reference density ρ0 kg m−3 3200
Viscosity η Pa s 1023
Thermal conductivity k W m−1K−1 4.5
Specific heat Cp J kg−1K−1 750
Dry mantle Reference density ρ0 kg m−3 3200
Viscosity η Pa s 1020
Thermal conductivity k W m−1K−1 105
Specific heat Cp J kg−1K−1 1250
Hydrated cylinder Reference density ρ0 kg m−3 3250
Viscosity η Pa s 1023
Thermal conductivity k W m−1K−1 4.5
Specific heat Cp J kg−1K−1 1250
conditions are free-slip on all sides (i.e. the velocity com-ponent parallel to the boundary is free, whereas the velocity component perpendicular to the boundary is zero). A 20 Myr old lithosphere, 58 km thick, overlies the mantle. The initial thermal condition of this oceanic lithosphere is determined from the plate-cooling model (e.g. Turcotte and Schubert, 2002) for a surface temperature of 0◦C, a temperature of
1300◦C at 58 km, and a thermal diffusivity of 10−6m2s−1. The surface temperature is held at 0◦C and the bottom tem-perature (at y= −300 km) at 1360.5◦C throughout model evolution, while the lateral sides are insulated (zero heat flux). A high conductivity (k=105 W m−1K−1) is used in the mantle to enforce a mantle adiabat of 0.25◦C km−1 (Pysklywec and Beaumont, 2004). The initial temperature of the cylinder is 400◦C, which gradually increases as the cylin-der warms up. The mantle is of pyrolytic composition, while the lithosphere and the cylinder are composed of SHB. The material and thermal properties are in Table 2. The initial wa-ter content of the hydrated cylinder is imposed at 0.2 wt %.
Water Content (wt%) 0 1 2 3 4 5 6 7 8 9 10 −200
−150 −100 −50 0
Depth (km)
50 100 150 200 250
x (km) 50 100 x (km)150 200 250
−200 −150 −100 −50 0
Depth (km)
−200 −150 −100 −50 0
Depth (km)
−200 −150 −100 −50 0
Depth (km)
−200 −150 −100 −50 0
Depth (km)
−200 −150 −100 −50 0
Depth (km)
a) Bound water b) Free water
50 000 yr
250 000 yr
1.25 Myr
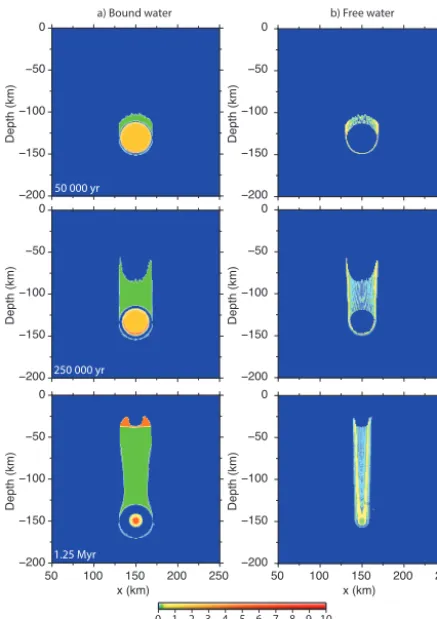
Figure 6. Elemental water content for the Stokes flow models using
scheme I (20 cm yr−1for a grid resolution of 1 km×1 km) showing
(A) bound water and (B) free water.
3.2 Sinking cylinder results
We first examine models in which water content does not influence the linear viscosity. The thermal and mechanical evolution of these models is therefore identical. These mod-els are used to test cylinder dehydration and mantle hydration for the three free water migration schemes.
As only the water migration schemes are changed, the evo-lution of the cylinders dehydration is identical in all cases. Dehydration of the cylinder occurs due to the increase in tem-perature of the cylinder from the outer rim inwards (Fig. 6a). Dehydration processes are assumed to be nearly instanta-neous, whereas water migration velocities are more than an order of magnitude larger than the flow velocities of the man-tle. Therefore, the influence of pressure on dehydration is negligible as the cylinder does not sink as quickly as it de-hydrates. The hydrated cylinder is initially undersaturated as the initial water content is 0.2 wt% (but it could contain up to 6.8 wt% at its initial pressure and temperature). The interior of the cylinder is therefore hydrated by water from the lower rim, which undergoes dehydration. This explains the differ-ences observed in cylinder OHrms during the first 1 Myr of model evolution (Fig. 7). Once the centre of the subducting
cylinder becomes saturated, dehydration in all models con-verges (Fig. 7c, f, i).
Hydration of the mantle initiates at the lateral sides of the cylinder, as the interior is being hydrated (Fig. 6b). This re-sults in a horned-shape area of hydrated mantle, which pro-gresses inwards as the cylinder dehydrates. The spatial dis-tribution of bound water is affected by the flow of the mantle. This is visible in the area of hydrated mantle above the cylin-der: a minimum in width of the hydrated domain occurs at a depth of ca. 125 km (Fig. 6a, last stage). This thinning is accentuated as the cylinder sinks towards the bottom of the model domain. The spatial distribution of free water is not affected by the mantle flow as water migration velocities are much higher than the mantle flow velocities.
The final bound water distribution in the model is inde-pendent of the water migration scheme, due to the limited amount of initial water, but water migration schemes do in-fluence the evolution of the water distribution in the tle (Fig. 7d). Due to the limited amount of water that man-tle material can absorb, the manman-tle is rapidly saturated by water released from the dehydrating cylinder. Therefore the faster the vertical migration of water, the faster the mantle hydrates (Fig. 7d). Due to the much higher water saturation values in the lithosphere, the rate of advancement of the hy-dration front in the overlying lithosphere is greatly reduced and differences in migration schemes are negligible there. In-creasing the efficiency factor in the Darcy flow models (ω, in Sect. 2.3) by an order of magnitude can locally increase the water velocity by an order of magnitude. However, this has a limited influence on the distribution of water as the average water velocity in the Darcy model stays close to 10 cm yr−1 (Fig. 7g).
-120 -100 -80 -60 -40 -20
0 0.5 1 1.5 2 2.5
Topmost water particle (km)
Time (Myr)
0 0.25 0.5 0.75 1 1.25 1.5 1.75 2
0 0.5 1 1.5 2 2.5
Mantle O Hrm s (10 -4) Time (Myr) 0 0.25 0.5 0.75 1 1.25
0 0.5 1 1.5 2 2.5
Cylinder O
Hrm
s
(10 )
-2 Time (Myr) -120 -100 -80 -60 -40 -20
0 0.5 1 1.5 2 2.5
Topmost water particle (km)
Time (Myr)
0 0.25 0.5 0.75 1 1.25 1.5 1.75 2
0 0.5 1 1.5 2 2.5
Mantle O Hrm s (10 -4 ) Time (Myr) 0 0.25 0.5 0.75 1 1.25
0 0.5 1 1.5 2 2.5
Cylinder O Hrm s (10 -2 ) Time (Myr) -120 -100 -80 -60 -40 -20
0 0.5 1 1.5 2 2.5
Topmost water particle (km)
Time (Myr)
0 0.25 0.5 0.75 1 1.25 1.5 1.75 2
0 0.5 1 1.5 2 2.5
Mantle O Hrm s (10 -4 ) Time (Myr) 0 0.25 0.5 0.75 1
0 0.5 1 1.5 2 2.5
Cylinder O Hrm s (10 -2 ) Time (Myr)
20 cm yr⁻¹ 20 cm yr⁻¹ visc.
10 cm yr⁻¹ 10 cm yr⁻¹ visc. 20 cm yr⁻¹ 20 cm yr⁻¹ visc. 60 cm yr⁻¹ 60 cm yr⁻¹ visc.
ω = 0.01
ω = 0.1 ω = 0.1 visc. ω = 0.3 Scheme II Scheme III Scheme I a) b) c) d) e) f) g) h) i)
Figure 7. Evolution with time of the depth of the top-most particle of hydrated material (top row), mantle OHrms(middle row) and cylinder OHrms (bottom row) for our models of a wet sinking cylinder. The first column show results for scheme I (water migration velocity of 20 cm yr−1), the second for scheme II with different imposed velocities (vf,y=10, 20 and 60 cm yr−1) and the third for scheme III, in which
the water migration velocity is calculated using the Darcy law with efficiency factorω=0.01, 0.1 or 0.3 (Sect. 2.3). Models labelled “visc” have a decrease in viscosity with increasing water content.
3.3 Sinking cylinder discussion
Our models of cylinder dehydration and mantle hydration show that different numerical water migration schemes do not result in large differences in the distribution of bound water in the mantle. The sinking cylinder induces a verti-cal solid flow field in the area of mantle hydration. The free water migration velocities are also vertical. The combined fluid migration velocity is therefore vertical and the differ-ence between the schemes lies mainly in the rate of free wa-ter migration. The wawa-ter migration velocities for our three migration schemes are within the same order of magnitude, resulting in a similar bound and free water distribution. How-ever, changing the magnitude of the water migration
-240 -220 -200 -180 -160 -140
0 1 2 3 4 5
Depth (km)
Time (Myr)
Visc independent on water Visc. dependent on water
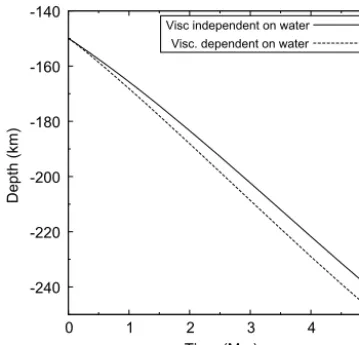
Figure 8. Depth of the bottom of the subducting cylinder versus
time for linear viscous models with or without including the effects of water on viscosity. This figure is for models that follow free water migration scheme I (Fig. 7a–c).
on the system. We will test this in the next section with thermo-mechanical models that also include horizontal man-tle (wedge) flow components.
Figure 6 shows a one-element-thick ring of hydrated man-tle around the subducting cylinder, on the lateral and bottom sides. This is an artefact of the free water migration scheme. Once a particle dehydrates, undersaturated particles of the el-ement are hydrated first. When the contact between cylinder and mantle lies within that element, mantle particles can ab-sorb the released water, resulting in the hydrated ring around the cylinder.
4 The effects of (de)hydration on subduction 4.1 Subduction model setup
We investigate the effects of slab dehydration, water migra-tion, and mantle wedge hydration using a model of a 70 Myr old oceanic lithosphere subducting under a 40 Myr oceanic lithosphere. The model without water follows Quinquis et al. (2013) and has been tested with a number of different numer-ical codes.
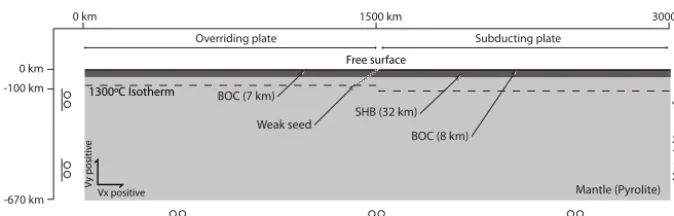
The oceanic plates are composed of two layers: (1) a 7 and 8 km crustal layer for the overriding and subducting litho-spheres, respectively, composed of bulk oceanic crust (BOC) (Chemia et al., 2010), and (2) a 32 km thick serpentinised harzburgite (SHB) layer (Chemia et al., 2010). The rheolog-ical and thermal parameters are given in Tables 3 and 4. We assume that the upper 16 km of the oceanic plates is hydrated to a certain degree through fractures in the oceanic crust. The upper kilometre of BOC is fully hydrated, resulting in an ini-tial water content of 2.68 wt% H2O. Few faults exceed 1 km
depth, resulting in an undersaturation of the remaining BOC. The initial water content of the BOC below 1 km depth is set at 1.5 wt% H2O. Finally, between 7 (or 8) and 15 km (or 16 km) depth, the overriding and subducting SHB is also un-dersaturated at an initial water content of 2 wt% H2O. These values follow Rüpke et al. (2004) and Faccenda et al. (2012). The model domain is 3000 km wide and 670 km deep (Fig. 9) and has the highest horizontal and vertical Eulerian resolution at the trench (1 km per element). The total num-ber of elements is 473×269 (horizontal×vertical), and 16 particles per element are used initially. Due to the variable grid resolution, this series of models requires injection and deletion of particles to maintain elemental particle density between 12 and 36. The particle deletion scheme helps keep the code memory requirements reasonable. To maintain the overall water content of the model, particles are injected dry, whereas the bound or free water content of a deleted par-ticle is distributed evenly over all other parpar-ticles of the el-ement. Subduction is initialised by a “weak seed” located at the interplate boundary. The weak seed simulates a pre-existing shear zone in the oceanic lithosphere separating the overriding and subducting plates. It is 14 km thick (in the di-rection perpendicular to the dip angle), extends to a depth of 82 km and has a 35◦dip angle. The top mechanical boundary is a true free surface (bothvxandvy are free), whereas the
bottom and left boundaries of the model are free-slip. Bal-anced material in- and outflow is defined on the right bound-ary of the model domain (the boundbound-ary parallel component is again free). To avoid strong shearing at the transition be-tween in- and outflow, a linear velocity gradient from in- to outflow is defined over a 20 km depth interval. The inflow ve-locity is 5 cm yr−1over the thermal thickness of the 70 Myr old lithosphere. The outflow velocity is imposed from a depth of−130 km to the bottom of the model domain at−670 km. The initial thermal conditions of the 40 Myr (from x=
0 to x= −1500 km) and 70 Myr (from x=1500 to x=
3000 km) old oceanic lithospheres are determined from the plate-cooling model (Turcotte and Schubert, 2002) for a sur-face temperature of 0◦C, a mantle temperature of 1300◦C at 82 and 110 km depth respectively, and a thermal dif-fusivity of 10−6 m2s−1. The initial step in temperatures at x=1500 km is rapidly diffused. During model evolu-tion, the surface temperature is held at 0◦C and the bot-tom temperature (aty= −670 km) at 1440◦C, while the lat-eral sides are insulated (zero heat flux). A high conductivity (k=183.33 W m−1K−1) is defined for the mantle to enforce the mantle adiabat of 0.25◦C km−1 (Pysklywec and Beau-mont, 2004).
Table 3. Subduction model parameters. The viscosity ranges from a minimum of 1018to a maximum of 1024Pa s. Heat productionH=0.
Parameter Symbol Unit Mantle Sublithospheric Overriding plate Subducting plate Weak seed
mantle BOC SHB BOC SHB
Olivine rheology Dry Dry Wet Wet Wet Wet Wet
Angle of frictiona φ 20◦/10◦ 20◦/10◦ 20◦/10◦ 20◦/10◦ 5◦/2◦ 10◦/5◦ 2◦
Cohesion C MPa 20 20 15 15 5 15 5
Reference density ρ0 kg m−3 3200 3200 3000 3250 3000 3250 3200
Reference temperature T0 ◦C 1300 1300 200 200 200 200 200
Conductivity k W m−1K−1 183.33 2.5 2.5 2.5 2.5 2.5 2.5
Heat capacity Cp J kg−1K−1 750 750 750 750 750 750 750
Thermal expansivity α 10−5K−1 2.5 2.5 2.5 2.5 2.5 2.5 2.5
Initial water content – wt% H2O 0 0 1.5–2.68 2 1.5–2.68 2 2.68
aAngle of internal friction (φ) softens from first to second value over an effective strain interval of 0.5 to 1.5.
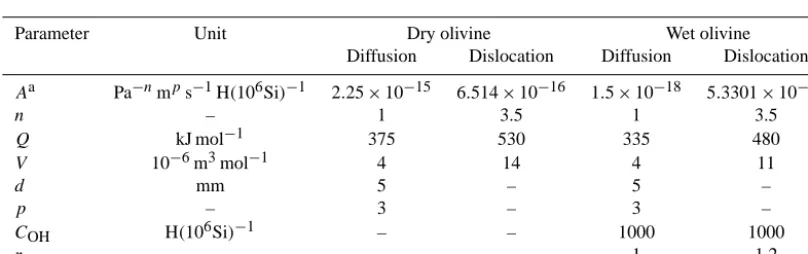
Table 4. Flow law parameters from Hirth and Kohlstedt (2003).
Parameter Unit Dry olivine Wet olivine
Diffusion Dislocation Diffusion Dislocation
Aa Pa−nmps−1H(106Si)−1 2.25×10⁻¹⁵ 6.514×10⁻¹⁶ 1.5×10⁻¹⁸ 5.3301×10⁻¹⁹
n – 1 3.5 1 3.5
Q kJ mol−1 375 530 335 480
V 10−6m3mol−1 4 14 4 11
d mm 5 – 5 –
p – 3 – 3 –
COH H(106Si)−1 – – 1000 1000
r – – – 1 1.2
aAis given for a general state of stress, and was converted from a uni-axial stress (Ranalli, 1995).
constant water migration velocity of 10 cm yr−1. All schemes are used to investigate the evolution of models with or with-out the effect of bound water content on viscosity (Eq. 4). The sinking cylinder models showed that an efficiency factor ωof 0.1 in scheme III (Sect. 2.3) provides realistic water mi-gration velocities. We therefore also use an efficiency factor ωof 0.1 in scheme III in the subduction models. For scheme II, two water velocities are investigated:vf,y=5 cm yr−1and
10 cm yr−1.
4.2 Subduction model results
Subduction is initiated at the weak seed by pushing the 70 Myr oceanic plate inwards, resulting in ca. 15 km of ad-vance of the interplate contact until brittle failure helps lo-calise deformation at the trench. The slab subducts at a fairly steep angle and with a more-or-less constant sinking velocity. The hydrated portion of the slab is limited to the top 16 km, and most of the slab is dry and therefore stiff. As we discuss below, the evolution of this stiff subducting slab is affected by (de)hydration processes, but not significantly.
Main dehydration occurs at two locations in the slab: at ca. 150 km depth, where dehydration occurs at the phase
tran-sition of blueschists to eclogite, and 210 km depth, where dehydration of chlorite occurs (Figs. 10 and 11). The man-tle wedge is hydrated by these dehydration reactions. Hy-drated mantle wedge material is entrained by the downwards flow above the subducting slab. This can bring bound water down to the transition zone. Figure 10 shows that the hor-izontal width of hydrated mantle above the slab decreases with depth. In the wedge, i.e, above 200 km depth, the man-tle can be hydrated up to a distance of 100 km away from the surface of the slab. As the slab deepens, the distance of hy-drated mantle from the slab surface decreases, from 50 km at ca. 200 km depth to less than 10 km at the slab tip (Fig. 10). Including the effects of bound water on viscosity increases the width of the hydrated mantle, BOC and SHB regions (Fig. 12e, g, h). The difference is, however, limited as the width of the hydrated regions increases by ca. 40 km towards the overriding plate.
-670 km -100 km 0 km
0 km 1500 km 3000 km
Free surface
Vx positive
Vy
positi
ve
Mantle (Pyrolite) SHB (32 km)
BOC (7 km)
BOC (8 km) Weak seed
M
at
er
ia
l
ou
tf
ow
(s
ee
te
xt
)
Overriding plate Subducting plate
1300ºC Isotherm
Figure 9. Model setup for subduction of a 70 Myr old oceanic plate under a 40 Myr old oceanic plate. The top boundary is free. The bottom
and left boundary are free-slip, while the right boundary condition includes material in- and outflow. SHB: serpentinised harzburgite; BOC: bulk oceanic crust.
small differences in the distribution of bound water in the mantle. The differences in mantle OHrmsbetween the three water migration schemes is small initially, but it increases to ca. 1×10⁻⁵after 6 Myr and then remains constant (Fig. 12i). The difference corresponds to variations in the lateral distri-bution of hydrated mantle material (Figs. 10 and 12). Includ-ing the effects of water on the viscosity does not change the OHrmsof the slab (Fig. 12j), but it does increase the OHrms of hydrated mantle (Fig. 12i). The effects on the distribution of free water are more substantial (Fig. 11). The distribution of free water for the elemental and Darcy schemes is sim-ilar, but the free water domain is somewhat broader, at ca. 40 km (Fig. 11) in the Darcy models. This is caused by the horizontal component of the mantle flow that is added to the free water velocity. Larger variations occur in the free wa-ter distribution for scheme II and can result in locally large quantities of free water of up to 4 wt% H2O (Fig. 11). How-ever, in our models, free water has no effect on rheology and therefore no influence on the dynamics of the system.
Introducing the effect of water content on viscosity does not have a strong impact on the large-scale mechanical evo-lution of the model. This is because the evoevo-lution of the sub-ducting slab is controlled by its stiffness. Due to the rela-tively little amount of water present in the slab (which is initially hydrated up to 16 km depth), dehydration processes will not greatly affect evolution of the already stiff slab. We do find that water weakening of viscosity increases flow in the mantle wedge and slightly reduces the curvature of the slab (Figs. 14 and 15). Corner flow is more pronounced in the models that have water-dependent viscosity, as a large part of the mantle above the slab is hydrated and thus weak-ened, promoting stronger mantle flow.
4.3 Subduction model discussion
Our models show a similar slab dehydration evolution to Rüpke et al. (2004), Arcay et al. (2005) and Cagnioncle et al. (2007). This is because a similar method for determining the locations of dehydration reactions are used in these ex-periments. The depths at which dehydration reactions occur
are slightly different between these studies because of differ-ences in the thermal structure of the slab in the models.
We find that the overall dynamics of our subduction model are not strongly influenced by the viscosity decrease of man-tle materials due to increase in water content. We suggest that this may be caused by the subducting slab being fairly stiff. Our slab is largely dry and the flow law of Hirth and Kohlst-edt (2003) results in an average viscosity of ca. 5×10²³Pa s, which is up to 5 orders of magnitude above the viscosity of the mantle. The evolution of this strong slab is not greatly influenced by a further viscosity increase caused by dehydra-tion processes. Our models do show an increase in the corner flow (Fig. 14) but not on the same scale as that observed in the models of Arcay et al. (2005). The slab in the models of Arcay et al. (2005) dips at a shallower angle, which could fo-cus corner flow and cause a larger effect of water on the flow field.
The numerical implementation of water migration has a significant effect on the distribution of free water in the man-tle wedge (Fig. 11). In our models, this effect is not visible in the overall evolution of the model because free water does not affect the rheology of the mantle materials. However, the distribution of free water in the mantle wedge could influ-ence the dynamics of subduction by changing the pore pres-sure, thereby changing the stress, and the viscosity. Similarly, the pore pressure effect of free water could reduce the plas-tic yield stress, thereby reducing effective viscosities in the slab and brittle parts of the mantle wedge. During fluid flow, compaction and dilation of the solid matrix may occur, re-lated to pore pressure effects. This could locally change the pressure field and thus in return effect water migration paths, changing the hydration patterns in the solid matrix.
To obtain a first-order assessment of the potential impact of free water on the rheology of our models, we calculated a scheme II water migration model withvf,y=5 cm yr−1in
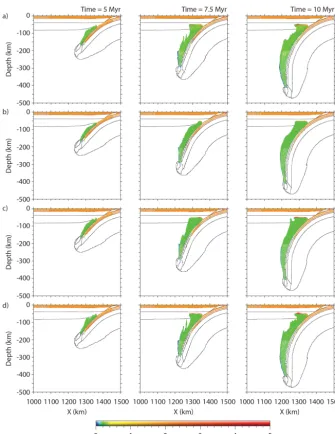
Figure 10. Bound water distribution for subduction models after 5, 7.5 and 10 Myr for the following free water migration schemes: (A)
elemental water migration scheme I (velocityvf,yincreases from 10 cm yr−1just below the lithosphere to 70 cm yr−1at the base of the model
where the grid is coarsest), (B) imposed vertical velocityvf,y=5 cm yr−1(scheme II), (C) imposed vertical velocityvf,y=10 cm yr−1and
(D) Darcy velocity with efficiency factorω=0.1 (scheme III). Bound water moves with the solid-phase flow. Viscosity of all materials changes with water content following the flow law of Eq. 4.
1 wt %. In the initial stages of subduction, where only small amounts of free water are present, the difference in viscosity between the bound water viscosity model and the bound and free water viscosity model is small. However, as the model evolves and the amount of free water increases, the viscosity field changes (Fig. 16). Low viscosity values are localised in the mantle wedge. The amount of hydrated mantle material that reaches the bottom of the model domain is greatly re-duced. This is because mantle flow is localised higher up in the mantle wedge. We emphasise that this model is a
prelim-inary result, as the effect of free water (as opposed to bound water) on creep flow laws is not established.
Figure 11. Free water distribution for subduction models after 5, 7.5 and 10 Myr for the following water migration schemes: (A) elemental
water migration scheme I (velocityvf,y varies between 10 and 70 cm yr−1), (B) imposed vertical water migration scheme II withvf,y=5
cm yr−1, (C) Imposed vertical water migration scheme II withvf,y=10 cm yr−1, and (D) Darcy water migration scheme III with efficiency
factorω=0.1. Viscosity of all materials changes with water content following flow law of Eq. 4.
encouraging melting, and because melts have a low viscos-ity, this could impact subduction dynamics. A logical next step would therefore be to include the effects of melts in our models of subduction with (de)hydration processes.
Including a decrease of viscosity with water content in the models influences the bound water distribution in the mantle close to the surface of the subducting slab (Fig. 14). Due to the limited water absorption capabilities of the mantle and the weak mantle wedge, the flow in the mantle wedge is in-creased, causing a further increase in the area over which the mantle is hydrated and weak. This suggests that subduction and mantle wedge studies that investigate (de)hydration
pro-cesses should preferably include the dynamic effects of water on viscosity and thus mantle flow during model evolution.
Figure 12. Evolution of: (A) depth of the topmost particle of hydrated mantle, (B) depth of the lowermost particle of hydrated mantle, (C)
depth of the lowermost particle of hydrated BOC, (D) depth of the lowermost particle of hydrated SHB for the subduction models, (E) horizontal coordinate of the leftmost particle of hydrated mantle, (F) horizontal coordinate of the rightmost particle of hydrated mantle, (G) horizontal coordinate of the leftmost particle of hydrated BOC, (H) horizontal coordinate of the leftmost particle of hydrated SHB, (I) mantle OHrms, and (J) slab OHrms. “visc” indicates models that have a decrease in viscosity with increasing water content.
present in the transition zone or deeper (Ohtani et al., 2004; Komabayashi et al., 2005). The amount of water reaching the transition zone could be greatly increased by including other chemical reactions in the mantle wedge, such as serpentini-sation (Iwamori, 1998).
We show that including the weakening effect of bound wa-ter on viscosity increases the amount of wawa-ter brought down to the bottom of the model domain (Fig. 14). This is because the viscosity reduction causes a stronger corner flow that
en-trains more hydrated mantle material in the downward flow above the subducting slab.
5 Conclusions
Figure 13. Viscosity field for models that follow the Darcy free
wa-ter migration scheme III with efficiency factorω=0.1 after 7.5 Myr for (A) viscosity not dependent on water content and (B) viscosity decrease with water content.
(de)hydration influences our models but that the exact man-ner of water migration is not that important. We suggest that studies of especially large-scale subduction dynamics may use a simple implementation of free water migration to cap-ture the first-order effects of (de)hydration, as, for example,
Figure 14. Bound water distribution for subduction models
us-ing Darcy free water migration scheme III (with efficiency factor ω=0.1) at 5, 7.5 and 10 Myr. (A) Water content does not change viscosity; (B) water content decreases the viscosity (following flow law Eq. 4).
an imposed velocity or simple Darcy flow water migration scheme. Elemental water migration (simply moving free wa-ter up one element per time step) can be used as long as grid resolution is constant and it is realised that grid size deter-mines the water migration velocity.
Figure 15. Free water distribution for subduction models using the
Darcy water migration scheme (withω=0.1) at 5, 7.5 and 10 Myr.
(A) Water content does not change viscosity; (B) water content
de-creases the viscosity (following flow law Eq. 4).
Including the effects of bound water content on viscosity does not strongly impact the overall evolution of the subduct-ing slab as it is controlled by the slab stiffness. We do find that the decrease in mantle viscosity with increasing water content as slab dehydration continues causes a more vigor-ous corner flow. If we assume that the upper mantle contains an average of 0.2 wt % water, this allows saturated hydrated mantle material to be transported down to the base of the upper mantle, supporting previous assumptions of hydrated material residing in the mantle transition zone.
Acknowledgements. We acknowledge financial support from the European Commission through Marie-Curie Research Training Network “c2c” (contract MRTN-CT-2006-035957). SULEC is developed jointly by Susanne Buiter and Susan Ellis. We warmly thank Zurab Chemia, Mark Caddick and James Connolly for help with Perple_X calculations and discussions on water behaviour, and
Figure 16. Viscosity fields in the mantle wedge for subduction
mod-els calculated using the imposed free water migration scheme II withvf,y=5 cm yr−1. (A) Only the effects of bound water are
taken into account in the viscosity calculations (using a maximum cut-off forCOH of 0.4 wt % in Eq. 4). This is the same model as Fig. 10b. (B) The effects of both bound and free water are taken into account in the viscosity calculations (using a maximum cut-off forCOHof 1 wt % in Eq. 4).
Joya Tetreault for many numerical discussions. This manuscript benefitted from the constructive reviews by Manuele Faccenda, Tobias Keller and Guillaume Richard.
Edited by: T. Gerya
References
Arcay, D., Tric, E., and Doin, M.-P.: Numerical simulations of sub-duction zones – effect of slab dehydration on the mantle wedge dynamics, Phys. Earth Planet. In., 149, 133–153, 2005. Bercovici, D. and Karato, S.-I.: Whole mantle convection and the
transition-zone water filter, Nature, 425, 39–44, 2003.
Bercovici, D.,Ricard, Y, and Schubert, G.: A two-phase model for compaction and damage 1. General theory, J. geophys. Res., 106, 8887–8906. 2001
Billen, M. I.: Modeling the dynamics of subduct-ing slabs, Annu. Rev. Earth Pl. Sc., 36, 325–356, doi:10.1146/annurev.earth.36.031207.124129, 2008.
Billen, M. I. and Gurnis, M.: A low viscosity wedge in subduction zones, Earth Planet. Sc. Lett., 193, 227–236, 2001.
Buiter, S. J. H. and Ellis, S. M.: Benchmarking a new ALE Finite-Element code, Geophys. Res. Abstracts, 14, EGU2012-7528, 2012.
Caddick, M. J. and Thompson, A. B.: Quantifiying the tectono-metamorphic evolution of Pelitis rocks from a wide range of tectonic settings: mineral compositions in equilibrium, Contrib. Mineral. Petr., 156, 177–195, doi:10.1007/s00410-008-0280-6, 2008.
Cheadle, M. J., Elliott, M. T., and McKenzie, D.: Percolation threshold and permeabiliy of crystallizing igneous rocks: the importance of textural equilibrium, Geology, 32, 757–760, doi:10.1130/G20495.1, 2004.
Chemia, Z., Dolejš, D., and Steinle-Neumann, G.: Thermal effects of metamorphic reactions in a three component slab, Geophys. Res. Abstracts 12, EGU2010-5768, 2010.
Connolly, J. A. D.: Computation of phase equilibria by linear pro-gramming: a tool for geodynamic modeling and its application to subduction zone decarbonation, Earth Planet. Sc. Lett., 236, 524–541, doi:10.1016/j.epsl.2005.04.033, 2005.
de Capitani, C. and Brown, T. H.: The computation of chemical equilibrium in complex systems containing non-ideal solutions, Geochim. Cosmochim. Ac., 51, 2639–2652, 1987.
England, P., Engdahl, R., and Thatcher, W.: Systematic variation in the depths of slabs beneath arc volcanoes, Geophys. J. Int., 156, 337–408, doi:10.1111/j.1365-246X.2003.02132.x, 2004. Faccenda, M., Burlini, L., Gerya, T. V., and Mainprice, D.:
Fault-induced seismic anisotropy by hydration in subducting oceanic plates, Nature, 455, 1097–1100, doi:10.1038/nature07376, 2008. Faccenda, M., Gerya, T. V., Mancktelow, N. S., and Moresi, L.: Fluid flow during slab unbending and dehydration: implica-tions for intermediate-depth seismicity, slab weakening and deep water recycling, Geochem. Geophy. Geosy., 13, Q01010, doi:10.1029/2011GC003860, 2012.
Férot, A., and Bolfan-Casanova, N.: Water storage capacity in olivine and pyroxene to 14 GPa: Implications for the wa-ter content of the Earth’s upper mantle and nature of seis-mic discontinuities , Earth Planet. Sc. Lett., 349–350, 218–230, doi:10.1016/j.epsl.2012.06.022, 2012.
Fujita, K. and Ogawa, M.: A preliminary numerical study on water-circulation in convecting mantle with magmatism and tectonic plates, Phys. Earth Planet. Int., 216, 1–11, doi:10.1016/j.pepi.2012.12.003, 2013.
Gerya, T. V., Stöckhert, B., and Perchuk, A. L.: Exhuma-tion of high pressure metamorphic rocks in a subducExhuma-tion channel: a numerical simulation, Tectonics, 21, 6-1–6-19, doi:10.1029/2002TC001406, 2002.
Gerya, T. V., Connolly, J. A. D., and Yuen, D. A.: Why is terrestrial subduction one-sided?, Geology, 36, 43–46, doi:10.1130/G24060A.1, 2008.
Gorczyk, W., Gerya, T. V., Connolly, J. A. D., and Yuen, D. A.: Growth and mixing dynamics of the mantle wedge plumes, Ge-ology, 35, 587–590, 2007.
Hacker, B. R., Abers, G. A., and Peacock, S. M.: Subduc-tion factory: 1. Theoretical mineralogy, density, seismic wave speeds, and H2O content, J. Geophys. Res., 108(B1), 2029, doi:10.1029/2001JB001127,2003.
Handin, J.: On the Coulomb-Mohr failure criterion, J. Geophys. Res., 74, 5343–5348, 1969.
Handy, M., Hirth, G., and Bürgmann, R.: Continental fault struc-ture and rheology from the frictional-to-viscous transition down-ward, in: Tectonic Faults: Agents of Change on a Dynamic Earth, edited by: Handy, M. R. et al., MIT Press, Cambridge, MA, 139– 181, 2007.
Hirschmann, M. M.: Water, melting, and the deep earth H2O cycle, Annu. Rev. Earth Pl. Sc., 34, 629–653, doi:10.1146/annurev.earth.34.031405.125211, 2006.
Hirth, G. and Kohlstedt, D.: Rheology of the upper mantle and the mantle wedge: a view from the experimentalists, in: Inside the Subduction Factory, edited by: Eiler, J., vol. 138 of Geophys. Monogr. Seer., AGU, Washington, D.C., 83–105, 2003. Holland, T. J. B. H. and Powell, R.: An internally consistent
ther-modynamic data set for phases of petrological interest, J. Meta-morph. Geol., 16, 309–343, 1998.
Hubbert, M. K. and Rubey, W. W.: Role of fluid pressure in me-chanics of overthrust faulting: I. Meme-chanics of fluid-filled porous solids and its application to overthrust faulting, Geol. Soc. Am. Bull., 70, 115–166, 1959.
Iwamori, H.: Transportation of H2O and melting in subduction zone, Earth Planet. Sc. Lett., 160, 65–80, 1998.
Iwamori, H.: Seismic evidence for deep-water transportation in the mantle, Chem. Geol., 239, 182–198, 2007.
Jaeger, J. C. and Cook, N. G. W.: Fundamentals of Rock Mechanics, Chapman and Hall, New York, 488 pp., 1976.
Karato, S.-I. and Li, P.: Diffusion creep in perovskite and the linear rheology of the Earth’s lower mantle, Science, 255, 1238–1240, 1992.
Katz, R. F., Spiegelman, M., and Holtzman, B.: The dynamics of melt and shear localization in partially molten aggregates, Na-ture, 442, 676–679, doi:10.1038/nature05039, 2006.
Kaus, B. J. P., Mühlhaus, H.-B., and May, D. A.: A sta-bilization algorithm for geodynamic numerical simulations with a free surface, Phys. Earth Planet. In., 181, 12–20, doi:10.1016/j.pepi.2010.04.007, 2010.
Kerrick, D. M. and Connolly, J. A. D.: Metamorphic devolatiliza-tion of subducted oceanic metabasalts: implicadevolatiliza-tions for seismic-ity, arc magmatism and volatile recycling, Earth Planet. Sc. Lett., 189, 19–29, 2001.
Komabayashi, T., Hirose, K., Funakoshi, K.-I., and Takafuji, N.: Stability of phase A in antigorite (serpentine) composition deter-mined by in situ X-ray pressure observations, Phys. Earth Planet. In., 151, 276–289, 2005.
Lemiale, V., Mühlhaus, H.-B., Moresi, L., and Stafford, J.: Shear banding analysis of plastic models formulated for incompress-ible viscous flows, Phys. Earth Planet. Int., 171, 177–186, doi:10.1016/j.pepi.2008.07.038, 2008.
Ohtani, E., Litasov, K., Hosoya, T., Kubo, T., and Kondo, T.: Water transport into the deep mantle and formation of a hy-drous transition zone, Phys. Earth Planet. In., 143–144, 255–269, doi:10.1016/j.pepi.2003.09.015, 2004.
Peacock, S.: Thermal effects of metamorphic fluids in subduction zones, Geology, 15, 1057–1060, 1987.
Powell, R., Holland, T. J. B. H., and Worley, B.: Calculating phase diagrams involving solid solutions via non-linear equations, with examples using THERMOCALC, J. Metamorph. Geol., 16, 577– 588, 1998.
Pysklywec, R. N. and Beaumont, C.: Intraplate tectonics: feedback between radioactive thermal weakening and crustal deformation driven by mantle lithosphere instabilities, Earth Planet. Sc. Lett., 221, 275–292, 2004.
Quinquis, M. E. T., Buiter, S. J. H., and Ellis, S.: The role of boundary conditions in numerical models of sub-duction zone dynamics, Tectonophysics, 497, 57–70, doi:10.1016/j.tecto.2010.11.001, 2011.
sub-duction: from linear viscous to thermo-mechanical rheologies, Geophys. Res. Abstracts, 15, EGU2013-7255-1, 2013.
Ranalli, G.: Rheology of the Earth, 2nd edn., Chapman & Hall, Lon-don, UK, 392 pp., 1995.
Regenauer-Lieb, K., Yuen, D. A., and Branlund, J. M.: The initi-ation of subduction: criticality by addition of water?, Science, 294, 578–580, doi:10.1126/science.1063891, 2001.
Richard, G. C. and Bercovici, D.: Water-induced convection in the Earth’s mantle transition zone, J. Geophys. Res., 114, B01205, doi:10.1029/2008JB005734, 2009.
Richard, G. C. and Iwamori, H.: Stagnant slab, wet plumes and Cenozoic volcanism in East Asia, Phys. Earth Planet. In., 183, 280–287, doi:10.1016/j.pepi.2010.02.009, 2010.
Richard, G. C., Bercovici, D., and Karato, S.-I.: Slab dehydration in the Earth’s mantle transition zone, Earth Planet. Sc. Lett., 251, 156–167, doi:10.1016/j.epsl.2006.09.006, 2006.
Richard, G. C., Monnereau, M., and Rabinowicz, M.: Slab dehydra-tion and fluid migradehydra-tion at the base of the upper mantle: impli-cations for deep earthquake mechanisms, Geophys. J. Int., 168, 1291–1304, doi:10.1111/j.1365-246X.2006.03244.x, 2007. Rüpke, L. H., Phipps Morgan, J., Hort, M., and Connolly, J. A. D.:
Serpentine and the subduction zone water cycle, Earth Planet. Sc. Lett., 223, 17–34, doi:10.1016/j.epsl.2004.04.018, 2004. Schmeling, H., Babeyko, A. Y., Enns, A., Faccenna, C.,
Funi-ciello, F., Gerya, T. V., Golabek, G. J., Grigull, S., Schmal-holz, S., and van Hunen, J.: A benchmark comparison of sponta-neous subduction models – towards a free surface, Phys. Earth Planet. Int., 171, 198–223, doi:10.1016/j.pepi.2008.06.028, 2008.
Schmidt, M. and Poli, S.: Experimentally based water budgets for dehydrating slabs and consequences for arc magma generation, Earth Planet. Sc. Lett., 163, 361–379, 1998.
Sibson, R. H.: Fault rocks and fault mechanisms, J. Geol. Soc. Lon-don, 133, 191–213, 1977.
Sibson, R. H., Moore, J. M., and Rankin, A. H.: Seismic pumping – a hydrothermal fluid transport mechanism, J. Geol. Soc. London, 131, 653–659, 1975.
Spiegelman, M.: Flow in deformable porous media. Part 1. Simple analysis, J. Fluid. Mech., 247, 17–38. 1993a.
Spiegelman, M.: Flow in deformable porous media. Part 2. Numer-ical analysis - the relationship between shock waves and solitary waves, J. Fluid. Mech., 247, 39–63, 1993b.
Staudigel, H.: Hydrothermal alteration processes in the Oceanic Crust, in: Treatise of Geochemistry, vol. 3, chap. 15, edited by: Holland, H. and Turekian, K., 511–537, 2003.
Stern, R.: Subduction zones, Rev. Geophys., 40, 3-1–3-38, doi:10.1029/2001RG000108, 2002.
Syracus, E. M. and Abers, G. A.: Global compilations of variations in slab depth beneath arc volcanoes and implications, Geochem. Geophy. Geosy., 7, Q05017, doi:10.1029/2005GC001045, 2006. Tingle, T., Green, H. W., Scholz, C. H., and Koczynski, T. A.: The rheology of faults triggered by the olivine-spinel transformation in Mg2GeO4and its implications for the mechanism of deep-focus earthquakes, J. Struct. Geol., 15, 1249–1256, 1993. Turcotte, D. L. and Schubert, G.: Geodynamics, 2nd edn.,
Cam-bridge Univ. Press, 186 pp., 2002.
Twiss, R. J. and Moores, E. M.: Structural Geology, W. H. Freeman and Company, New York, 532 pp., 1992.
van den Berg, A. P., van Keken, P. E., and Yuen, D. A.: The effects of a composite non-Newtonian and Newtonian rheology on mantle convection, Geophys. J. Int., 115, 62–78, 1993.
Wark, D. A., Williams, C. A., Watson, E. B., and Price, J. D.: Reassessment of pore shapes in microstructurally equilibrated rocks, with implications for permeability of the upper mantle., J. Geophys. Res., 108, B1, doi:10.1029/2001JB001575, 2003. White, S. H. and Knipe, R. J.: Transformation-and