DOI: 10.1051/epjconf/20135702003 C
Owned by the authors, published by EDP Sciences, 2013
Atomic and molecular spectroscopy with
optical-frequency-comb-referenced IR coherent sources
P. Cancio
1,a, S. Bartalini
1, M. De Rosa
2, G. Giusfredi
1, D. Mazzotti
1,
P. Maddaloni
2, M.S. Vitiello
3and P. De Natale
41Istituto Nazionale di Ottica (INO) – CNR and European Laboratory for Non-linear
Spectroscopy (LENS), via Carrara 1, 50019 Sesto Fiorentino FI, Italy
2Istituto Nazionale di Ottica (INO) – CNR, via Campi Flegrei 34, 80078 Pozzuoli NA, Italy 3NEST, Istituto Nanoscienze – CNR and Scuola Normale Superiore, Piazza San Silvestro 12,
56127 Pisa PI, Italy
4Istituto Nazionale di Ottica (INO) – CNR, Largo Fermi 6, 50125 Firenze FI, Italy
Abstract. We provide a review of progress in the development of metrological-grade measurements in
atomic and molecular systems through the extension, in the mid-infrared and far-infrared range, of optical frequency combs (OFCs) and the introduction of new techniques and highly coherent sources.
1. INTRODUCTION
The hallmark of progress in physical sciences is the constant improvement of measurement precision and accuracy. Testing ground of such progress are the simplest systems, like atoms and molecules, that can be investigated by spectroscopic techniques. However, their transition frequencies are spread across most part of the electromagnetic spectrum, depending on the specific atom/molecule and degree of freedom. Therefore, their accessibility for experimental studies has always depended on the effective availability of proper sources and techniques. Moreover, accurate measurements require appropriate standards, available for each selected spectral range. Since their first demonstrations at the end of the last century, OFCs have soon become widespread clockworks, providing stable and accurately known frequency references across the visible/near-IR spectral interval [1,2]. More recently, their extension to other spectral windows has been pursued by many groups, worldwide [3,4]. Of course, such extensions has always proceeded hand-in-hand with the development of appropriate tunable coherent sources and techniques.
In this paper, we review recent progress in the development of a metrological toolbox enabling precise measurement of atomic and molecular transition frequencies in the infrared range, mainly achieved by groups at the European Laboratory of Nonlinear Spectroscopy (LENS) and National Institute of Optics (INO-CNR) in Florence and Naples, Italy, putting the results in the proper context. More specifically, we will show results for atomic helium transitions around 1083 nm wavelength [5–10], experiments on CO2, CH3I and CH4 in the 3–4.5m range [11–26], novel set-ups for interrogation of rotational transitions in simple molecules in the far infrared (THz) range [27,28]. As is described, such experiments have been strictly dependent on the development of highly coherent sources, often harnessing their intrinsic properties, and new methodologies.
ae-mail:[email protected]
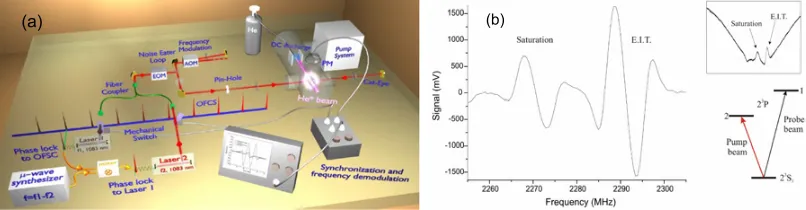
Figure 1. (a) Experimental set-up of the OFC-assisted multi-resonant diode laser spectrometer. (b) EIT spectrum
for the V coherence spectroscopy configuration with L1 resonant with4He 23S
1→23P2transition and L2 resonant with4He 23S
1→23P1one, when the L2 frequency is scanned and L1 frequency is fixed. Saturation dip spectrum due to L2 is also shown.
2. HELIUM SPECTROSCOPY WITH AN OFC-ASSISTED MULTI-RESONANT DIODE LASER SPECTROMETER AT 1083 NM
Helium atom has long been a favorite testing ground for fundamental two-electron QED theory and for new techniques in atomic physics, both experimental and theoretical. In this context, the spectroscopic measurements and theoretical determinations of the energies of low-lying triplet states have pushed the limits of precision. The readily accessible 23P manifold from the metastable 23S state at 1083 nm has been the focus of much experimental activity, particularly following the introduction of OFC’s [5–10,29]. Fundamental physical constants and atomic properties can be determined for such precise spectroscopic measurements. Fine structure (FS) energies of the 23P manifold in He can produce an accurate determination of the fine structure constant,[30]. Nuclear properties, as difference of nuclear charge radius among such different He isotopes, can be determined from precise isotope-shift (IS) measurements at 1083 nm [9]. Measurements of 23P hyperfine structure (HFS) of fermionic He isotopes are used to determine nuclear interaction and nuclear magnetic moment in such atomic species [10]. Precise measurements of large energies as optical transitions between 23S and 23P levels are used to determine QED and high-order relativistic effects (Lamb shifts) in such states [5,6,9,29].
Although spectroscopic measurements of such frequency intervals, at least for the microwave FS, HFS and IS energies, can be allowed by heterodyne optical spectroscopy without need of absolute frequency referencing of the laser sources [7,30,31], metrological properties transferred by the OFCs are fundamental for accurate measurements of optical frequencies [5,6,9,29]. In addition, FS, HFS and IS microwave intervals, calculated by difference of optical transitions, benefit of such OFC referencing in terms of final accuracy [7,10]. In this frame, we have recently developed an OFC-assisted diode laser spectrometer at 1083 nm for multi-resonant spectroscopy of He atom around such wavelength [8] (see Fig.1a).
Basically two different 1083 nm Extended Cavity-Distributed Bragg Reflector (EC-DBR) diode laser sources [32], resonant with different He transitions, are phase-locked to a near-IR OFC (MenloSystems, FC1500-100). The first laser (L1) is directly phase-locked to the nearest OFC tooth
signal for L2. For larger separations, the OFC can be used as an optical frequency mixer to compare and control directly the phase/frequency noise of the two CW lasers, as described in section3. Finally, a microwave synthesized frequency,fwis used to down convert the detected beat-note,f12to the local oscillator frequencyfLO of the second phase-lock circuit (OPLL2). In this way, we have developed a GPS (Global Positioning System) traceable absolute frequency chain for both lasers given by:
f1=f0+N1fr+fLO
f2=f1+f12=f0+N1fr+fw+fLO
(1)
wherefr andf0are the OFC repetition rate and carrier-envelope offset frequencies controlled against of a Rb-GPS-disciplined 10-MHz quartz clock (stability of 6×10¹³in 1 s and accuracy of 2×10⁻¹²). Moreover, simultaneous synthesized scans of both frequencies are allowed by changing thefrfrequency. Alternatively, the frequency difference between the lasers is scanned by changingfw. This approach can be extended to a larger number of OFC-assisted laser sources, even in other spectral regions, and with larger frequency separations between them. Such systems are proposed for applications that require phase-locked lasers to a low-power optical reference under noisy conditions.
Sub-Doppler saturation fluorescence spectroscopy on metastable He atomic beam at 1083 nm was realized with such spectrometer (see Fig.1b). Simultaneous absolute frequencies of optical transitions and frequency differences between them can be measured at the same level of precision and accuracy. Systematic effects were minimized or avoided, in particular, those due to non resonant light, by means of the alternative blocking of both lasers. Thanks to such precision spectroscopy, we have recently determined the nuclear charge radius of 3He with respect to the 4He one [9], discovering possible unknown effects in the electron-nucleus interaction beyond standard QED. In this case3He−4He IS at 1083 nm was measured by frequency difference of the centroid optical frequencies between 23S and 23P manifolds measured in 2012 for3He [9] and in 2004 for4He [5,6], putting in evidence the potentiality of OFC assisted absolute frequency measurements. These measurements in3He have allowed by the first time to test the combined FS-HFS QED theory of 23P manifold in 3He at the kHz level [10], meaning the first step for a determination of the nuclear magnetic moment of this atom from an atomic physics measurement. Finally, this OFC-assisted multiresonant spectrometer can be used for coherence spectroscopy following Raman schemes, as the one illustrated in Fig.1b for the Electronically-Induced-Transparency (EIT) in4He. Such schemes can be used for applications that require a precise coherent manipulation of individual atomic or molecular quantum states in cold samples [33].
3. CO2SPECTROSCOPY WITH AN OFC-REFERENCED NON-LINEAR SOURCE AT
4.2–4.5M
Since 2005, within our research group in Florence, an OFC-referenced difference-frequency-generated (DFG) spectrometer, based on a(2)non-linear process in a periodically-poled LiNbO3crystal, has being developed and continuously improved, in terms of stability and emitted power [11,34,35]. This coherent source is aimed at transferring the clockwork nature (one-step traceability of optical frequencies against the Cs microwave standard at 9.2 GHz) of OFCs from the visible/near-IR regions to the mid IR, where most of the strongest ro-vibrational molecular transitions lie (the so called “fingerprint region”, between 2.5 and 10m).
In our earlier experiment [11] we used the OFC only as an absolute frequency reference for our DFG source. By coupling this mid-IR radiation to a medium-finesse (F ∼500) cavity, we performed saturated-absorption sub-Doppler spectroscopy and we measured the line-center absolute frequency of the (0001−0000) R(60) transition of CO
More recently the locking scheme was changed, in order to use the OFC also as a transfer oscillator for phase-locking the pump radiation involved in the DFG process (delivered from an external-cavity diode laser) to the signal one (delivered from a fiber-amplified Nd : YAG laser). The phase-locking technique is based on a scheme involving a direct-digital-synthesis process able to cancel out any phase-noise contribution from the two free parameters of the OFC: the carrier-envelope offset f0and the repetition frequencyfr[36]. In this way, the extremely high frequency stability of the latter source (based on a monolithic non-planar ring oscillator laser cavity) is directly transferred to idler radiation. The achieved intrinsic linewidth of the mid-IR source was measured to be as low as 10 Hz [34]. Such a narrow emission spectrum of the source has turned to be crucial for efficiently coupling radiation to a high-finesse cavity with a few kHz mode linewidth.
Two years ago, we developed a high-sensitivity technique for trace gas sensing, named saturated-absorption cavity ring-down (SCAR), in order to overcome the main limitation to the achievable CRD sensitivity, namely variations of the empty-cavity decay rate [13]. The SCAR working principle can be shortly described as follows. An optical cavity filled with an absorbing molecular species is illuminated with an intense CW laser tuned to excite the target molecular transition of the gas. When the laser is turned off, photons stored in the cavity decay due to both absorption from the gas and mirror leakage. Because light intensity saturates the molecular transition, the initial instants of decay are affected by losses from the mirrors only. Once this background is subtracted, within each CRD event, we can determine the absolute quantity of the trace gas species from the linear molecular absorption encoded in the decay tail. In the same work, we demonstrated both the high sensitivity and the high spectral resolution of SCAR, by measuring the hyperfine structure of the 17O12C16O isotopologue in natural abundance.
In case of extremely low concentrations of the absorbing molecular species, the SCAR cavity must be filled at higher gas pressures, in order to increase the absorption coefficient to be measured. Higher pressures require higher intensity to saturate the transition and thus higher power from the mid-IR radiation source. This was achieved by placing the non-linear crystal inside a Ti : sapphire laser cavity, boosting the DFG power up to 30 mW [35].
The most prominent result obtained by the combination of the SCAR technique with the power-boosted DFG source was the first optical detection of 14C16O
2 well below the ∼1-ppt natural abundance [15]. After a systematic spectroscopic measurement of the (0001−0000) ro-vibrational band of this elusive isotopologue, by using an enriched sample, we improved the ground-state molecular constants of 14C16O
2 by one order of magnitude [14]. We also identified the P(20) transition as the target line for radiocarbon detection, being the best trade-off between the highest linestrength and the lowest interference from nearby lines of more abundant CO2 isotopologues. The intercomparison between concentrations measured by SCAR and by the accelerated mass spectrometry (AMS) was successfully checked, finding a very good agreement within respective uncertainties. At last, the almost perfect linearity of SCAR was confirmed also at high enrichment levels (up to 6400 times the natural abundance) [16].
4. CO2SPECTROSCOPY WITH AN OFC-REFERENCED QCL SOURCE AT 4.3M
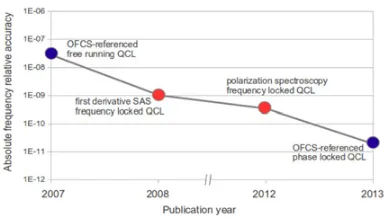
Figure 2. Improvement of the relative accuracy of the absolute frequency measurements made by QCL-based
spectroscopic experiments, in the last years. The four points are related to our four works cited in this section: Refs. [17–20], respectively.
fact, in typical operating conditions, they are affected by a larger frequency noise, that broadens their spectrum up to few MHz, which arises partly from the current noise of the driving current and partly from the active region itself, for some still unexplained mechanisms [38]. In this framework, a crucial step towards an extensive use of QCLs for demanding spectroscopic and metrological applications is the development of techniques enabling the narrowing of the QCL emission and its referencing to a stable frequency standard. In last years we developed several techniques for either giving an absolute frequency reference to a mid-IR QCL or for further narrowing its emission linewidth. They can be divided in two different categories: those directly based on an OFC, and those based on a secondary frequency standard, such as a molecular transition. In the following we will briefly describe experiments from both these categories, demonstrating how the accuracy of the spectroscopic measurement on CO2molecular transitions has been progressively improved by more than 3 orders of magnitude (Fig.2). Starting from the second category, it is worth mentioning the first stabilization of a mid-IR QCL to a sub-Doppler feature of a CO2line, obtained by using the first derivative of a saturated-absorption Lamb dip for closing a feed-back loop acting on the QCL current [18]. In this case we achieved the stabilization of the QCL absolute frequency with an overall accuracy of 10−9but, due to the poor bandwidth of the lock-in based detection, we did not achieve any narrowing of the QCL source. This last result was indeed obtained by changing the spectroscopic sub-Doppler technique: adopting a polarization spectroscopy set-up we have recently obtained the narrowing of the emission linewidth of a QCL from its typical free-running value of about 1 MHz (FWHM) down to less than 1 kHz [19]. As a consequence, also the stabilization of the QCL frequency at the center of the molecular transition was improved, achieving an overall accuracy on the QCL absolute frequency of about 4×10⁻¹⁰, mainly limited by systematic errors. The techniques described above, as already noted, do not require an OFCS, and thus are very compact and cost effective solutions. On the other hand, since they are based on the stabilization of the frequency to a fixed point, they do not allow to tune the QCL frequency. For this reason we also worked on the referencing of a mid-IR QCL to an OFC. To this purpose, a frequency conversion is required, since the OFC operates in the near-IR range. We both demonstrated an approach based on the up-conversion of the QCL frequency to the near-IR region, where the beating with the OFCS is observed [17], and an approach based on the observation of the beat-note directly in the mid-IR, by beating the QCL with the ultra-narrow DFG source described in the previous section. In the first case the absolute frequency of a free-running QCL was counted while the QCL was scanning across a Doppler-broadened molecular transition; the relative accuracy of the frequency determination was evidently limited by the QCL emission linewidth, at about 3×10⁻⁸. For this reason, in the second case, a phase lock of the QCL to the OFC-referenced DFG source was implemented. In this way, not only the possibility of continuously tuning the QCL frequency is preserved, but also a dramatic narrowing of the QCL emission is achieved. With this scheme, the absolute QCL frequency is known with an accuracy of about 10−12, while the center of a CO
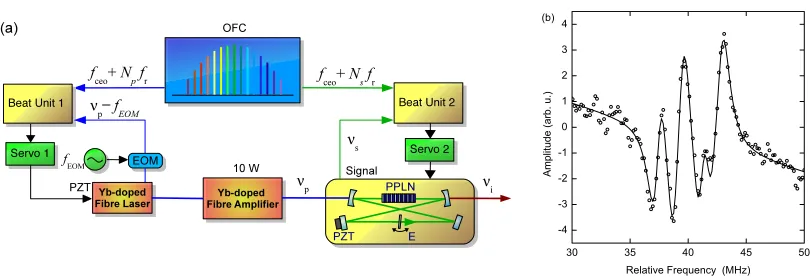
Figure 3. (a) Simplified scheme of the OPO locking to the optical frequency comb (OFC). PPLN:
periodically-poled lithium niobate crystal; E: YAG etalon; EOM: electro-optic modulator. (b) Hyperfine structure of theν1 P(18, 3) rovibrational transition of CH3I, at 30 mTorr, with 630 mW of saturating power. Experimental data (open circles) have been fitted by a linear background and six Lorentzian derivatives.
5. CH3I SPECTROSCOPY WITH AN OFC-REFERENCED OPO SOURCE AROUND 3M
For many years since their first demonstration CW optical parametric oscillators (OPOs) have been considered impracticable as spectroscopic source, as their operation was affected by strong instabilities or high pump power were needed for exceed the oscillation threshold. In the last decade, advances in material science and the availability of powerful and narrow-linewidth laser sources in the near IR renewed the interest in OPOs. In the last years several CW OPOs have been demonstrated as reliable source for high-resolution spectroscopy. They are mostly addressed to the generation of coherent radiation in the mid-IR region between 2 and 5m, a region of particular interest, because of the presence of strong fundamental rovibrational bands of many molecules. OPOs can generate new frequencies over a wide spectral range from visible to IR, with emitted power up to watt level and with good spectral features.
We developed a widely-tunable, singly-resonant OPO, emitting more than 1 W in the region between 2.7 and 4.2m. The OPO performance has been demonstrated by carrying out high resolution spectroscopic measurements on rovibrational transitions of CH3I vapor, being able to resolve their sub-Doppler hyperfine structure and determine their absolute frequencies.
two sidebands at frequencies±fEOM with respect to the carrier laser frequencyνp. In fact, a sideband is locked to the comb, while the OPO is pumped at the carrier frequency. By changingfEOMthe pump frequency and, as a result, the idler frequency are scanned.When both the signal frequency and the pump sideband are simultaneously locked their frequencies can be written asνp =f0+Npfr+fb1+fEOM andνs =f0+Nsfr+fb2, respectively.Np (Ns) is an integer number that indexes the pump (signal)
nearest comb tooth. The resulting idler frequency reads as
νi =νp−νs=(Np−Ns)fr+fb1−fb2+fEOM, (2) independent of the comb offset frequencyf0. The locked system showed a relative Allan deviation of 3×10⁻¹²−1/2, forbetween 1 and 200 s [21].
In order to test the spectral features of the absolutely stabilized OPO we carried out sub-Doppler spectroscopy of CH3I rovibrational transitions around 3.38m. Rovibrational levels of this molecule, identified by the quantum numbersJ andK, are split into hyperfine sublevels by electric quadrupole interaction of the iodine nucleus, with nuclear spinI =5/2. These hyperfine sublevels give rise to six transitions satisfying the selection ruleF =J, where F=J+I [39].
Figure (3b) shows the six sub-Doppler hyperfine components of the ν1P(18, 3) rovibrational transition of CH3I, at 30 mTorr pressure. Phase-sensitive lock-in detection has been adopted to increase the signal-to-noise ratio of the saturated absorption. The profile has been fitted to a linear background and six Lorentzian profile derivatives with equal widths and amplitudes. The centroid of the multiplet has been estimated as 88 791 204.19±0.05 MHz. The 50 kHz uncertainty is the standard deviation of the fit results from different data sets. The position of the six components with respect to the centroid are in good agreement with the calculated ones. Also, we estimated an upper limit of 200 kHz for the idler linewidth (FWHM).
In a singly resonant OPO the idler linewidth depends on the pump and the signal linewidths. In order to further reduce the idler linewidth, the signal frequency has been stabilized with respect to a resonance of a reference Fabry–Pérot cavity, by means of the Pound–Drever–Hall (PDH) locking scheme [40]. The reference cavity is made by two curved mirrors (ROC=1 m) glued on an invar spacer. The mirrors provide high finesse (F >4000) over the same wavelength range of the OPO mirrors. The invar spacer is held by a mechanical suspension and placed in a thermally stabilized vacuum chamber for seismic and acoustic isolation. A servo electronics is fed by the PDH signal and drives the piezo-mounted mirror of the OPO cavity. With a servo-loop bandwidth of about 4 kHz, limited by the piezo resonances, we calculated, from the in-loop power spectral density [41], a FWHM of∼70 kHz at 1 ms for the signal frequency [22]. This linewidth is, to the best of our knowledge, the lowest value reported for a mid IR OPO over 1 ms. In fact, for longer times the reference cavity shows a long term drift of∼1 MHz/s which is transferred to the locked signal frequency.
6. CH4SPECTROSCOPY WITH AN OFC-REFERENCED DFG SOURCE AROUND 3M
Figure 4. Layout of the experimental apparatus: the OFC-referenced DFG radiation is used for precision
spectroscopy. The following legend holds: OFCS=OFC, ECDL=external-cavity diode laser, EDFA=Er-doped fiber amplifier, YDFA=Yb-doped fiber amplifier, SL=servo lock, LO=local oscillator, BU=beat unit, BS= beam splitter, M=mirror, DM=dichroic mirror, FS=frequency synthesizer, PPLN=periodically poled lithium niobate.
power-boosted up to 10 W by an Er-doped fiber amplifier (EDFA). The pump radiation, tunable between 1030 and 1070 nm, comes from a second ECDL which seeds an Yb-doped fiber amplifier (YDFA) whose output beam (about 1 W) passes through an acousto-optic modulator (AOM). The emerging first-order diffracted beam is superimposed with the signal radiation and then focused into a 5-cm-long, temperature-controlled, multiple-channel periodically poled LiNbO3 (PPLN) crystal, where the DFG process takes place. The resulting idler beam, filtered from the unconverted near-IR radiation by a Ge window, has a power of a few milliwatts and an emission linewidth of approximately 1 MHz (basically determined by the linewidths of the pumping sources). Its absolute frequency is determined by referencing both the ECDLs to a near IR OFC covering the 1–2m octave (MenloSystems, FC1500-250). For this purpose, each beat note at frequencyf(s,beat) (f(p,beat)) between signal (pump) and the Ns(Np) comb tooth is sent to a corresponding electronic servo. The two servo circuits lock these beat notes to given local oscillator values by feeding back proper corrections both to the external-cavity piezos and to the laser current drivers. In this way, the DFG emission frequency reads
fDF G=Mfr+(f(p,beat)−f(s,beat))+fAOM (3)
whereM=Np−Ns,fr∼250 MHz is the comb mode spacing andfAOM ∼90 MHz is the frequency of the signal driving the AOM. The link to the Cs-clock standard is established by stabilizingfragainst a high-quality 10-MHz BVA quartz oscillator which is disciplined, in turn, by a Rb/GPS clock; the same reference chain is used to lock the time base of the frequency synthesizers generating the signals at
f(p,beat),f(s,beat), andfAOM, respectively. Finally, the integersNpandNs, and henceM, are determined by means of a near-IR wavemeter having an accuracy much better thanfr/2. In this way, the absolute frequency of the DFG radiation can be monitored by simultaneously measuring the terms of Eq. (3). Coarse tuning of DFG across the molecular resonance is accomplished by changingM, while fine steps are realized by slightly changing fr at a given M. Originally developed to perform saturation sub-Doppler spectroscopy of methane [23], such a versatile radiation source has then been used in a number of other detection schemes including
– cavity ring-down spectroscopy (CRDS);
– frequency modulation (FM) spectroscopy [24]; in this frame, a portable DFG-based spectrometer was also realized for detection of methane in natural abundance. Here, the IR beam was coupled to a 13-m multiple-reflection cell and a two-tone FM technique was implemented, thus leading to a minimum detectable concentration of 400 ppt Hz−1/2;
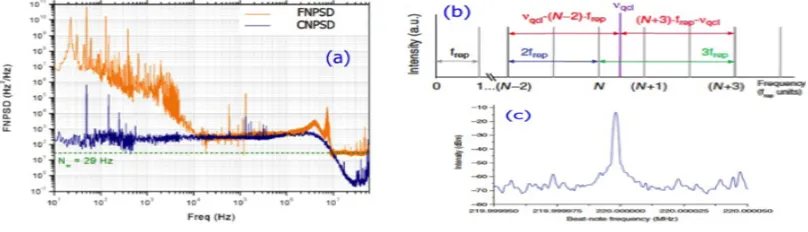
Figure 5. a) Experimental FNPSD of the THz QCL (orange trace), compared with the contribution to the
frequency-noise of the CNPSD from the current driver (blue trace). The dashed line marks the white-frequency-noise level; (b) Comb-like structure of the THz-FC beam, in the frequency domain, and monochromatic QCL emission (νqcl). The red-coloured arrows indicate the beating between the QCL and the third-order neighbors teeth of the comb. The corresponding frequencies fall in the range between 2frepand 3frep(blue and green arrows, respectively); (c) Phase-locked beat-note signal acquired with a 100 Hz span and 1 Hz RBW.
7. MOLECULAR SPECTROSCOPY WITH THZ QCL CONTROLLED WITH A FREE-SPACE THZ FREQUENCY COMB
Although QCL is the most efficient compact semiconductor source in the mid-IR (4.3–24m), QCL technology is however not still completely mature in the spectral region >100m. After the first demonstration in 2002 [44], efficient and miniaturized QC sources operating in the 1.2–4.9 THz window have now been successfully developed, in either single-plasmon or double-metal waveguide configuration. Frequency and phase stabilized, high power and reliable, metrological-grade solid-state terahertz sources can indeed find application in a large number of fields, spanning from far-IR astronomy [45] and high-precision molecular gas spectroscopy [46,47] to high-resolution coherent imaging and telecommunications [48,49]. To address such application requirements, high-frequency-stability sources are almost mandatory. In this context, the knowledge of the intrinsic linewidth (LW) due to quantum noise plays a key role, ultimately determining the achievable spectral resolution and the coherence length. In a QCL, environmental effects such as temperature, bias-current fluctuations or mechanical oscillations are expected to significantly affect the LWs. We recently developed a sophisticated experimental technique to investigate the spectral purity of a 2.5 THz QCL via the measurement of its frequency-noise power spectral density (FNPSD). The latter provides, for each frequency, the amount of noise contributing to the spectral width of the laser emission by deriving the laser emission spectrum over any accessible time scale. It also allows calculating the LW reduction achievable using a frequency-locking loop, once its gain/bandwidth characteristics are known [27,37]. Intensity measurements were performed to retrieve information in the frequency domain by converting the laser frequency fluctuations into detectable intensity (amplitude) variations [37]. As a discriminator, we used the side of a Doppler-broadened methanol molecular transition. Specifically, the ro-vibrational molecular transition line of CH3OH, centered atν0=2.5227816 THz, was used as a discriminator. The resulting FNPSD spectrum is plotted in Fig.5a, together with the current-noise power spectral density (CNPSD) of the current driver, converted to the same units by using the current tuning coefficient. Above 8 MHz, an asymptotic flattening is observed in the FNPSD, with a significant deviation from CNPSD, thus suggesting a flattening to a white noise level (Nw), from which an intrinsic LWν= Nw=90±30 Hz has been extracted [27]. Despite the broadening induced by thermal photons, the measured LW results narrower than in any other semiconductor laser.
using a commercial hot-electron bolometer (HEB) detector, with only a few tens of nW radiation power required. A THz-FC covering the 0.1–6 THz frequency range, has been realized by an optical rectification approach, based on the Cherenkov effect of a femtosecond mode-locked Ti : sapphire laser in a waveguide fabricated on a MgO-doped LiNbO3crystal plate [50]. The beating between the QCL and the THz-FC is detected on a HEB (see Fig.5b). The two beams are superimposed by means of a highly asymmetrical beam splitter, so that more than 99.5% of the QCL radiation is available for the experiment beam. The QCL terahertz radiation also works as local heater for the superconductive junction, bringing it at the suitable operating temperature. The beat note is mixed with a synthesized RF signal, so that it is down-converted to the 21.4 MHz frequency of the phase-lock electronics local oscillator (LO). The output of the phase detector is processed by a standard proportional-integral-derivative (PID) unit and then sent to the QCL current driver, to close the locking loop. The achieved signal-to-noise ratio is >50 dB at 1 Hz RBW, close to the expected limit of 60 dB [28]. By numerical integration of the beat-note spectra, we find that about 75% of the QCL power is phase-locked to the THz-FC emission. The phaselock leads to a narrowing of most of the CW laser emission down to the terahertz comb tooth linewidth (see Fig. 5c). Our approach demonstrates that even a small fraction (<100 nW) of the radiation emitted from the QCL is sufficient to generate a beat note suitable for phase-locking to the comb, paving the way to novel metrological-grade terahertz applications, including high-resolution spectroscopy, manipulation of cold molecules, astronomy and telecommunications [28].
References
[1] J. Reichert, et al., Phys. Rev. Lett. 3232 (2000). [2] D. J. Jones, et al., Science 288, 635 (2000).
[3] T. Udem, R. Holzwarth, T. W. Hansch, Nature 416, 233240 (2002).
[4] P. Maddaloni, P. Cancio Pastor, P. De Natale, Meas. Sci. Technol. 20, 052001 (2009). [5] P. Cancio Pastor, et al., Phys. Rev. Lett. 92, 023001 (2004).
[6] P. Cancio Pastor, et al., Phys. Rev. Lett. 97, 139903 (2006). [7] G. Giusfredi, et al., Can. J. Phys. 83, 301 (2005).
[8] L. Consolino, et al., Opt. Express 19, 3155 (2011).
[9] P. Cancio Pastor, et al., Phys. Rev. Lett. 108, 143001 (2012).
[10] K. Pachucki, V. Yerokhin, P. Cancio Pastor, Phys. Rev. A 85, 042517 (2012). [11] D. Mazzotti, et al., Opt. Lett. 30, 997 (2005).
[12] D. Mazzotti, et al., J. Opt. A 8, S490 (2006).
[13] G. Giusfredi, et al., Phys. Rev. Lett. 104, 110801 (2010). [14] I. Galli, et al., Mol. Phys. 109, 2267 (2011).
[15] I. Galli, et al., Phys. Rev. Lett. 107, 270802 (2011). [16] I. Galli, et al., Radiocarbon (2012), submitted. [17] S. Bartalini, et al., Opt. Lett. 32, 988 (2007). [18] S. Borri, et al., Opt. Express 16, 11637 (2008). [19] F. Cappelli, et al.. Opt. Lett. 37 (2012).
[20] I. Galli, et al., Appl. Phys. Lett. (2012), to be submitted. [21] I. Ricciardi, et al., Opt. Express 20, 9178 (2012). [22] I. Ricciardi, et al., Mol. Phys. 110, 2103 (2012).
[23] P. Maddaloni, P. Malara, G. Gagliardi, P. De Natale, Appl. Phys. B 80, 141 (2005). [24] P. Maddaloni, P. Malara, G. Gagliardi, P. De Natale, Appl. Phys. B 85, 219 (2006). [25] P. Malara, P. Maddaloni, G. Gagliardi, P. De Natale, Opt. Express 14, 1304 (2006). [26] P. Maddaloni, P. Malara, G. Gagliardi, P. De Natale, J. Opt. Soc. Am. B 23, 1938 (2006). [27] M. Vitiello, et al., Nature Photon. 6, 525 (2012).
[30] M. Smiciklas, D. Shiner, Phys. Rev. Lett. 104, 070403 (2010). [31] F. Minardi, et al., Phys. Rev. Lett. 82, 1112 (1999).
[32] M. Prevedelli, et al., Opt. Commun. 125, 231 (1996). [33] W. Vassen, et al., Rev. Mod. Phys. 84, 175 (2012). [34] I. Galli, et al., Opt. Express 17, 9582 (2009). [35] I. Galli, et al., Opt. Lett. 35, 3616 (2010).
[36] H. R. Telle, B. Lipphardt, J. Stenger, Appl. Phys. B 74, 1 (2002). [37] S. Bartalini, et al., Phys. Rev. Lett. 104, 083904 (2010).
[38] S. Borri, et al., IEEE J. Quam. Electron. 47, 984 (2011).
[39] C. H. Townes, A. L. Schawlow, Microwave Spectroscopy (Dover, New York, 1975). [40] R. Drever, et al., Appl. Phys. B 31, 97 (1983).
[41] G. Di Domenico, S. Schilt, P. Thomann, Appl. Opt. 49, 4801 (2010). [42] S. Okubo, et al., Opt. Express 19, 23878 (2011).
[43] P. Maddaloni, et al., J. Chem. Phys. 133, 154317 (2010). [44] R. Köhler, et al., Nature 417, 156 (2002).
[45] J. M. Reix, et al., Acta Astron. 34, 130 (2009).
[46] D. M. Mittleman, Sensing with THz Radiation (Springer, 2003). [47] P. De Natale, et al., Appl. Opt. 36, 8526 (1997).
[48] M. Tonouchi, Nature Photon. 1, 97 (2007).