IJEDR1703172
International Journal of Engineering Development and Research (
www.ijedr.org
)
1195
Defect Detection and Classification in Ceramic Plates
Using Machine Vision and Naïve Bayes Classifier for
Computer Aided Manufacturing
1
Harpreet Singh,
2Kulwinderpal Singh,
1Research Student,2Assistant Professor, 1,2Department of Mechanical Engineering,
1,2North West Institute of Engineering & Technology, Dhudike, Moga, India
Abstract: Detection of defect is an inevitable task in ceramic manufacturing. In spite of the importance of the pictorial inspection of products, many of the inspection processes are performed manually. Here, the development of automatic processes for the examination of ceramic products is important. The difficulty is that manual inspection has some obvious
drawbacks, such as being long, the high price involved, and the absence of standardization. Packaging glass or china clay
product uses the packaging containers which of exact size that of the product to fit in. In this work, we propose a smart
system for the automatic detection of the types of defects in ceramic products: the previous one is detection of a defect in ceramic plates for domestic use, called ceramic deformation, and the latter one is classification of a defect called deformation in plates for domestic use. To evaluate these applications, we used the dataset made available by the previous researchers for defect detection purpose only. The result in the form of graphs and GUI are provided showing the effectiveness of the method. In the result it is found that the overall accuracy for defect detection in ANN is nearly 73%
while this accuracy for Naïve Bayes is nearly 85%. Also time taken for total defects analysis by Naïve Bayes is almost 0.02s
while for ANN it as almost 0.25s.
Keywords: Machine Vision, Inspection, Defects, Classification, Gray Level, Image Series.
I. INTRODUCTION
Quality is pivotal to the successful functioning of an enterprise as it can be explained as the ability of the products or services to satisfy the requirement of the customers, rather than just conforming to the standards. Quality naive bayes classifier, quality control and quality improvement are suggested by Juran et al. (1998) as the trilogy which ensures quality in the modern day manufacturing centres. For an effective decision at all these stages (in line with Garbage In Garbage Out-GIGO- concept), there needs to be a measure of the current status of the quality in an accurate and quick way. A viable option is to use sensors for such measurements of the critical parameters of the finished product. There is another important decision to be made as to the degree of inspection that is required for any product. Given the situation of progressive improvement of the manufacturing process, the inspection has to be flexible enough to accommodate newer quality standards. When the process capability is to be improved due to sudden changes in the quality specification, there is a requirement for 100% inspection. 100% inspection has its disadvantages, since the cost involved is higher and additionally the human operators also have to be educated to make the right decision. But the availability of inexpensive sensors, higher computer memory storage capabilities and calculation speeds makes it economical to implement automated inspection methodology in the current production environment. Though sensors are available for automating many of the inspection tasks, there are still many situations where manual inspection is the best possible solution. When it comes to visual inspection of varied kinds of defects in complex shapes which are sometimes hidden to the view completely, manual inspection still may be considered as a suitable option.
IJEDR1703172
International Journal of Engineering Development and Research (
www.ijedr.org
)
1196
capture images with very good quality required for any specific application. Generally the usage of vision inspection is dictated by the application and it should be always aimed to make it simple. It is more cost effective and better engineering practice to capture a good image at the source, rather than to pour resources into cleaning it up or simplifying it later. The second stage is the pre processing of images to gather the necessary quality for the application desired and to obtain the image data. Later, the data has to be processed and then the decision regarding the inspection status has to be made. The available information has to be used to make a decision regarding the type of defects, since no approach aimed at defect detection will be complete without quantifying the decision. The final step is an elaborate process in itself because decision making is a case of pattern recognition and involves a lot of preliminary steps to ensure correct decisions.II. RELATED WORK
Rosati et al. (2009), have attempted real time defect detection on curved reflective surfaces using a set of mirrors. A special mirror was designed to direct the illumination at specific direction and the presence of defects could be observed by analysing the images using standard image processing software. An efficient camera system approach was used, where the machine vision sensor was in the path of specularly reflected light rays. A similar set up can be used for inspection of automobile parts with highly reflective surfaces. But the high intensity reflections might saturate the machine vision sensor resulting in loss of information and this was not discussed in detail. To avoid saturation, reduction in the intensity of incident light might cause lesser contrast in the defects that are imaged. This is a particular anomaly while using bright field imaging systems. Microstructure surfaces were reconstructed from SEM images by Samak et al. (2007). Unlike the previously discussed approach, the sample to be inspected was tilted and the change in position of the point under observation was converted into height information using the standard triangulation algorithm used for most of the depth detection problems. Later De launey’s triangulation has been done using this information. The images were microscopic and the CAD model of many broken materials was successfully created such that fracture analysis can be done using this information. Abrahamo vich et al. (2005) described the calibration and use of multiple cameras for inspection. Quite interestingly, the cameras used were commercially available webcams, array of cameras such that imaging of a large area can be covered. Many of the inspection scenarios like wooden sheet inspection, sheet metal inspection demand multiple cameras and the performance, as stated by the author, is really convincing for an industrial user since the web camera costs 1/50th of an industrial camera. The methodology of imaging different areas of the same surface and then stitching all of it together will enhance the speed of inspection provided the illumination source for all the surfaces also remains the same. But the approach is really beneficial when the surface for inspection is planar (which the author has specifically stated) and can be imaged at once
Sun et al. (2005) applied X-ray imaging for real time detection of welding defects in steel tubes. Though X-ray was used, the signals were captured in digital form just like visible light and the image was used for subsequent analysis. The use of X-rays and image processing paradigms could easily automate the inspection process which was undertaken by human inspectors till then. The feed back after the implementation of the set up was that it is more efficient than manual inspection of video streams. This is an example of capturing higher contrast image information by use of X-rays. Moreover, in this particular case, choices for inspection set ups were limited since the defects were subsurface. Luo and Liou (1998) used multiple cameras to measure the surface conditions of a cylinder and used the images to measure deviations. The methodology was based on binocular vision. The images captured by the two imaging devices have been correlated with each other to determine the diameter of the sample to be inspected. Both the imaging devices were used to capture the same surface under inspection. Use of two cameras helped in the evaluation of depth information, though there were anomalies due to the curvature of the surface. The explanation is particularly useful for determining the diameter of cylindrical components, rather than surface inspection. Lee et al. (2000) suggested machine vision system for curved surface inspection. Ceramic plates machine are the spindles and plates which are used in large numbers in each of the machines. The resources available to inspect defects on flat surfaces and circular shapes, none of them are useful for inspecting internal, curved and circular shapes. As a result, thousands of plates are manufactured at the industry to cater to the needs of the consumer and for the maintenance of older ones. Also, a less computationally intensive algorithm is required to speed up the entire inspection process. Juran et al. (1998) suggested the quality naive bayes classifier, quality control and quality improvement as the trilogy which ensures quality in the modern day manufacturing centres. Accounting for all shortcomings, it has been found that manual inspection has only 80% accuracy in making correct inspection. A viable option is to use sensors for such measurements of the critical parameters of the finished product. For an effective decision at all these stages (in line with Garbage In Garbage Out-GIGO- concept), there needs to be a measure of the current status of the quality in an accurate and quick way. As a result there is always an attempt to augment the senses of the inspector using instruments like sound amplifier, optical magnifier etc.
IJEDR1703172
International Journal of Engineering Development and Research (
www.ijedr.org
)
1197
real time image. Algorithms analyze the moving objects frames and output of the location of the object within that video frame. In early pre processing stage temporal or special smoothening is used to eliminate various noises present in the video frame or the image under consideration. There are various environmental changes so we also use the technique of background modeling against those environmental changes occurring in the video frame.III. PROPOSED METHOD
Image processing methodology to be adopted generally is based on the type of illumination, the characteristics of object under inspection, the data to be extracted and type of machine vision system. Though some of the image processing procedures are adaptable, most of the new applications require newer and different techniques of pre-processing of the images. The complete vision system has to be designed based on the inspection requirement which vary for different applications. In many of the industrial applications the size, dimension, pattern or shape of the objects are assessed. The application discussed here in this work is principally to detect the presence of defects and classify them. Different methodologies tried out with regards to the kind of illumination will be discussed in this chapter. Since speed and accuracy are the major requirements, each of the methods will be analyzed for suitability, according to the speed and the accuracy at which the inspection process can be completed.
In our proposed system, the CHT aims to find the circles in the plate image. After generating the edge image, we will consider the edge points as
, k=1, 2, 3……n.
The weights in a circular Hough space are analyzed for estimating the three parameters of one circle . A Hough space can be written as:
and k=1, 2, 3……n are the edge pixels.
The position with the maximum value of is chosen as the parameter vector for the strongest circular boundary. However, in our proposed system, CHT is used for detecting the plate outer boundary. Depending upon the database considered the defined range of radius searches for the values that have been set manually.
For the given database, a value of the radius for plate ranges between 100 to 110 pixels. In order to formulate the circle detection process in an efficient, effective and accurate naive bayes classifier, the Circular Hough transform based approach for the plate was performed first; after the completion of this particular process, 3 parameters are stored for circles which includes, radius and center coordinates.
IV. RESULT
The defect classification requires more information about the defects, if a better classification is to be achieved. The usage of different illumination systems gives more information about the area under consideration. From the images in Figure, it can be understood that the details are varied in each of the images, though the same details are being imaged in all of them.
Each of the features has varying highlights in different images. The usage of the window has made sure that each pixel represents information which is related to the neighbouring pixels, rather than an abnormal value which is seldom correlated to any other pixel values in the vicinity.
The comparison of the same pixel values in different images will yield a more concrete idea about the presence of a particular feature in image. The images in Figure prove this aspect. Throughout the implementation of proposed approach, a fusion of information has been used to make better decisions.
One major disadvantage of this approach is the number of calculations which in turn increased run time for each algorithm implementation. As a result, it was attempted to consider a region of interest by creating a mask based on the camera position which might reduce the computational load and run time by many times.
It also helped to simplify the thresholding operation. The thresholding operation was done by finding the optimum cut off frequency for the parameters under consideration. An interesting fact to be noted is that only the spatial coordinates of the image is the same at all stages of classification operations, since the gray scale values have been replaced by statistical parameters which have their own unique range. As a result, they had to be normalized to a unique scale while doing operations in unison with another pixel.
Similar conversion of scale happens in all the measurement processes in metrology. As a result, the parameters have to be accompanied with a scaling factor while implementing the final classification process also. The images in Figure have the defective area separated out to a very good extent. Here again, the information fusion has been applied through logical operations to arrive at a final image with an optimum separation of defective region. The usage of information fusion will help in making decisions on the basis of a large amount of valid information, thus decreasing the possibility of error in the decision. This can be done by avoiding all information, which is obviously
)
,
(
x
ky
k)
,
,
,
,
(
)
,
,
(
1r
y
x
y
x
h
r
y
x
H
k c cIJEDR1703172
International Journal of Engineering Development and Research (
www.ijedr.org
)
1198
erroneous, by implementing a condition for evaluating the suitability of particular information for use in the algorithm (For example, in a thresholding operation the whole image naive bayes classifier be showing defective area of the plate). The parameters in the index values corresponding to the thresholded region is now passed to the defect classifier. The Naive Bayes Classifier based on normal distribution has been considered. All the data points could not be fitted exactly into the normal distribution. Again, an information fusion approach was considered where the data from different combinations could be considered together and then the best possible decision taken.
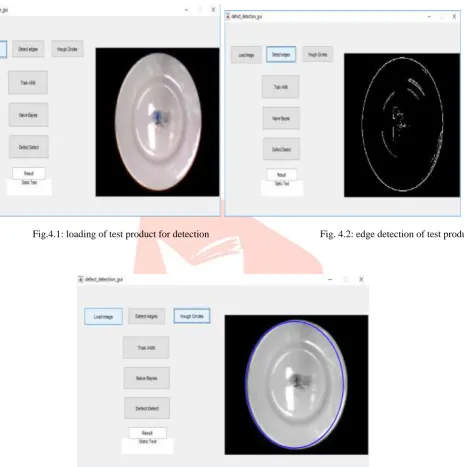
Fig.4.1: loading of test product for detection Fig. 4.2: edge detection of test product
IJEDR1703172
International Journal of Engineering Development and Research (
www.ijedr.org
)
1199
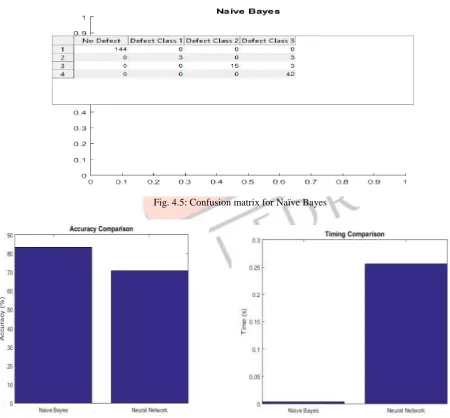
Fig. 4.4: Confusion matrix for ANNFig. 4.5: Confusion matrix for Naïve Bayes
Fig. 4.6: Accuracy comparison graph for both methods Fig. 4.7: Time comparison graph for both methods
IJEDR1703172
International Journal of Engineering Development and Research (
www.ijedr.org
)
1200
The results are good except for the case of yellow stain, which is a difficult kind of defect compared with the rest. Nevertheless many of the pixels corresponding to yellow stain were classified correctly. The flow chart for the proposed approach is given in Figure 6.16
V. CONCLUSION
An approach to inspect and classify defective glass plate using machine vision has been presented in this work. The glass plates were imaged using an experimental set up with a machine vision system using a specific system. These approaches may be used to find the presence of defects and successful classification of defects with very high accuracy and reliability.
Based on this work, the following are the specific conclusions:
1. Experimental study concludes that plate’s defects are classified into three categories and these categories depend upon the type of defects present in plate. In category 1, plates have minor defects (like variation in radius of the plate as compared to the standard plate), category 2 plates have large defects (like plates are crack from one side or it is totally broken) and it is send to waste material. Plates which have only edge defective are classified into final category i.e. category 3.
2. After comparing two methods, study resulted that Naïve Bayes is more accurate and less time consuming as compared to ANN. It is also found that accuracy level for Naïve Bayes is nearly about 85% while for ANN it is nearly about 73%. Also the time taken for total defects analysis by Naïve Bayes is almost 0.02s while for ANN it as almost 0.25s.
Table 5.1: Comparison between two methods
Name of Method Accuracy Level Time Taken (Second)
Naïve Bayes 85% 0.02
ANN 73% 0.25
SCOPE FOR FUTURE WORK
The proposed set up could be practically implemented and fine-tuned to meet the requirement of the industry.
Also, instead of the normal halogen light source, other light sources could be tried out.
There can also be quantification of the surface or geometrical features of the plate by methods such as phase shifting interferometry and structured lighting sources etc. Such approaches can be as well used to find the surface finish of the components under consideration.
REFERENCES
[1] Rosati G., Boschetti G., Biondi A. and Rossi A. (2009) Real-time defect detection on highly reflective curved surfaces.
Optics and Lasers in Engineering, 47(3-4), 379-384.
[2] Samak D, Fischer A and Rittel D. (2007) 3D Reconstruction and visualization of microstructure surfaces from 2D images. Naive bayes classifierals CIRP, 56(1),
149-152.
[3] Abrahamovich G., Barhak J. and Spicer P., (2005), “Reconfigurable array for machine vision inspection (RAMVI)”,
Conference on Reconfigurable Manufacturing. Naive bayes classifier Arbor, USA, R-01, May 10–12, 2005.
[4] Sun Y., Bai P., Sun H.Y. and Zhou P. (2005) Real time automatic defect detection of weld defects in steel pipe. NDT&E International, 38, 522-528
[5] Luo P.F. and Liou S.S. (1998) Measurement of curved surfaces by stereo vision and error analysis. Optics and. Lasers Engineering, 30, 471-486.
[6] Lee M. F. R., de Silva C. W., Croft E. A. and Wu Q. M. J. (2000) Machine vision system for curved surface inspection.
Machine Vision Applications, 12,177-188.
[7] Lindner C., Schäffler F. and León F. P. (2007) Texture-based surface segmentation using second-order statistics of illumination series. Lecture notes in informatik, 109, 32-37.
[8] A.McIvor, “An active contour tracking method by matching forground and background simultaneously,2013.
[9] Iivarinen J. and Visa A. (1998) An adaptive texture and shape based defect classification. 14th International Conference on Pattern Recognition (ICPR'98), 1, 117.