www.nat-hazards-earth-syst-sci.net/17/157/2017/ doi:10.5194/nhess-17-157-2017
© Author(s) 2017. CC Attribution 3.0 License.
A reconstruction of 1 August 1674 thunderstorms
over the Low Countries
Gerard van der Schrier and Rob Groenland
Royal Netherlands Meteorological Institute, De Bilt, the Netherlands Correspondence to:Gerard van der Schrier ([email protected]) Received: 9 August 2016 – Discussion started: 7 September 2016
Revised: 14 December 2016 – Accepted: 29 December 2016 – Published: 10 February 2017
Abstract. On 1 August 1674 an active cold front moved over the Low Countries. The accompanying thunderstorms along the squall line were abnormally active, leading to large-scale damage in Europe, from northern France to the north-ern parts of Holland where damages were particularly severe. Using reported and pictured observations of damages and modern meteorological concepts, the reconstruction of the storm points to an exceptionally severe squall line. The ori-entation and the velocity of the squall line are reconstructed and shows a developed bow-echo structure. An estimate of the strength of the strongest wind gusts is ≈55–90 m s−1 and is based on an assessment of the damages caused by this event. A rough estimate of the return time of this event, based on observed hail size, is between 1000 and 10 000 years. This storm is compared to a more recent storm which was similar in dynamics but much less devastating. Special attention is given to the city of Utrecht which was hit hardest, and where the impact of this storm is still recognizable in the cityscape.
1 Introduction
Wednesday 1 August 1674 (new/Gregorian calendar) ended in thunder and lightning over the Netherlands, which is not uncommon for a typical warm and humid Dutch summer day. Different from other days was that the meteorologi-cal conditions of this day led to the formation of a line of thunderstorms along the cold front which developed to ex-tremely severe levels. During the passage of this line, wind gusts caused severe damages over an area from northern France, into (what was called in the 17th century) the Span-ish Netherlands and the Dutch Republic. The passage of the front was noted as far east as Hamburg (northern Germany;
see Fig. 1 for the location of mentioned places). The dam-age was overwhelming in the Netherlands and this storm was referred to at the time (in Dutch) as “het Schrickelik Tem-peest”, or the Terrible Tempest.
Using modern insights in mesoscale meteorology and by gathering impact-related evidence and accounts from various sources, we take a fresh look at this day, analyse the event and make an estimate of its severity in terms the strength of the wind gusts and its return period. Here we argue that this event is characterized by strong straight line winds resulting from downbursts. This contrasts with the popular view that a single tornado caused this damage. However, we argue in this study that vortices, embedded within the frontal structure, are likely to have been present. In addition to a description of a historic event, the reconstruction and analysis of this summer storm event illustrates the impact of a storm of this ferocity that is rare enough not to be captured by the modern weather radar archives (which are a few decades long) but apparently not unlikely to occur. The quantification of the strength of the wind gust associated with this event may provide a per-spective on the disruption to society in case such a rare event would occur again.
A summary of the storm event is given by the newspaper “The Dutch Mercurius” of August 1674 (Hollandsche Mer-curius, 1674):
Figure 1. Cities, towns and villages mentioned in the text. The numbers in the map refer to (1) Alkmaar, (2) Amsterdam, (3) Antwerp, (4) Brussels, (5) Delft, (6) Fontainebleu, (7) Frankfurt am Main, (8) Haarlem, (9) Hamburg, (10) Hilversum, (11) Ilpen-dam, (12) Koog aan de Zaan, (13) Leiden, (14) Neerkant, (15) Stras-bourg, (16) Texel, (17) Utrecht, (18) Vethuizen.
was found that had no damage to its tiles, win-dows or something else. Several windmills were overturned by the wind (. . . ) As it was all prayers day, many men were outside, and many of them were never seen again. Several other towns in Hol-land suffered damage as well, though not as much as Amsterdam. On the island of Texel, the furious winds drove many ships on the beach or were sunk. The largest damage happened in Utrecht because in a quarter of an hour most of the houses lost their facades and roofs. (. . . ) These thunderstorms were not only in Holland but also in other provinces. In Brussels, hail stones fell which were as large as marbles, many trees were removed from the Earth, but also many house facades were overthrown. The bridge in Antwerp, which lay over the river Scheld, was destroyed by the strong winds, and the ships drifted away on the river. In Hamburg and in the area of the river Elbe this thunderstorm was felt as well. In Strasbourg, hailstones fell as large as a baby’s head.
Figure 2.Drawing of the ruin of the Dom cathedral following the 1674 storm by Herman Saftleven (Utrecht City Archive no. 28635). The viewpoint of the artist is from the undamaged part of the Cathe-dral overlooking the area with the collapsed nave towards the Dom tower.
The storm caused an enormous amount of damage in the Dutch provinces of Holland and Utrecht (located in the west and central parts of the Netherlands). Especially Utrecht city and surrounding villages were hit hard, where church towers from five surrounding villages were partly or completely de-stroyed based on newspaper accounts (Haerlemsche Courant, 1674).
The Dom cathedral in Utrecht probably suffered most from the storm. Although the church had seen storm damage from earlier storms, this time the nave of the church, between the tower and the transept, collapsed (Fig. 2).
2 Accounts and descriptions of the storm 2.1 Used sources
Amsterdamse Courant, 1674). Although details in these ac-counts differ, the general structure and a considerable amount of the wording in these articles are similar. This indicates that the three newspapers and the pamphlet should be regarded as one source rather than four independent sources.
The exact circumstances during and after the storm are well known due to the publication of Gerrit Jansz. Kooch (1674), skipper and merchant (1597/98–1683). Kooch (1674) painted a picture of the damage in the Netherlands in a poem of 138 couplets. He also collected some informa-tion about the damage in (what is now called) Flanders (Bel-gium). Its sources include official publications on the storm (likely including the newspaper articles mentioned above), but he also wrote to people and used his network of friends and family to gather damage reports. Furthermore, he asked carpenters and roofers about the extent of the damage and he investigated himself the extent of the damage by interview-ing people who he then introduced in his poem. The rhyme begins with Kooch’s personal account of the impact of the storm on his surroundings in Amsterdam and then gives de-scriptions of damages from Flanders, following the path of the storm northward until it leaves Holland over the North Sea. Some additional information on Kooch is provided by Pfeifer (2015).
Drawings by the landscape painter Her-man Saftleven (1609–1685) were commissioned by Utrecht city council to record the damage in and around the city in great detail. The sheer amount of drawings depicting the damage of the storm in the vicinity of Utrecht (over 25 are available in the Utrecht city archives1 while some 60 drawings are known to exist; A. F. E. Kipp, personal communication, 2016) indicate the widespread character of the damage this storm produced. An inventory of Saftleven’s known drawings of the ruins in and around the city is provided by Kipp (1974) and reproduced by Graafhuis and Snoep (1974). Some of these drawings depict damage within the city walls (18 focusing on the Dom Cathedral, five of other subjects) but most (45 in total) depict damage in the vicinity of the city, outside the walls.
In the summaries of local histories of all Dutch cities and villages compiled by van der Aa (1839), damage due to the events surrounding the 1674 storm is frequently mentioned.
In a historical description of events by Joh. Lodew. Gottfrieds (Gottfried, 1700), published in 1700, the storm of 1674 and the damage it caused is described to some detail.
Finally, Buisman (2000), in his impressively detailed de-scription of each single season in 1000 years of weather in the Low Countries, collected a vast amount of descriptions of this storm from city archives, official records and diaries. A similar collection of sources for descriptions of the storm and its damage is provided by Graafhuis and Snoep (1974) and Graafhuis (1974).
1http://www.hetutrechtsarchief.nl/
2.2 Summary of contemporary descriptions of the storm and its damage
The short duration of the storm is made clear in Kooch’s ac-count of the damage in Amsterdam. His personal experience was that the storm passed in a short half hour (strophe 10). Later, one of his sources claims that the storm passed over Amsterdam in a quarter of an hour (strophe 80 and 81) and that no house would have been undamaged if the storm were to have lasted a full hour. Sweerts (1674) writes that in less than half an hour the whole town of Utrecht was turned to ruins.
The passing of this system saw unusually strong gusts which are described in Kooch’s report, accounting numerous cases of people, small boats and carriages taken up into the air. The impact of the storm on the landscape is also made clear by Kooch (1674, strophe 42–44) in which a farmer fails to recognize the surroundings of his grass land after the pas-sage of the storm, with not only the haystacks blown away, but the trees along the borders of his land and church towers of a nearby town as well.
The destructive force of the gusts was illustrated by the nature of the damage: churches collapsed, church choirs and spires were damaged or destroyed, wind mills were over-turned, pieces of lead used as roofing (some of them 150 pounds in weight) were blown off completely and roofs of houses were ripped off. One account from the city of Hilversum (Kooch, 1674, strophe 45 and 46) is indicative of the enormous damage which affected this town where 50 homes were levelled and others badly damaged, causing many deaths (van der Aa, 1839).
There are several reports from the water-rich province of North Holland about boats that did not survive the storm. An example from the area near Ilpendam (north of Amsterdam), was of two farmers who were first blown out of the boat and then the boat was taken up by the winds, flying “over several fields”. The boat was shattered to pieces when the farmers found it again (Kooch, 1674, strophe 119 and 120).
The amount of rain (Kooch, 1674, strophe 91–95) must have been exceptional. It was described as “the rain was over-whelming”, “as if buckets were emptied”, “it came streaming down the streets”, and “the rain, which came like the Deluge, flooded the houses, ruined the walls and spoiled the grain that was left on the fields”. Kooch also reports on the remark-able size of the hail stones. Other reports of large hail stones come from northern France, Belgium and the Netherlands (Hollandsche Mercurius, 1674; Buisman, 2000).
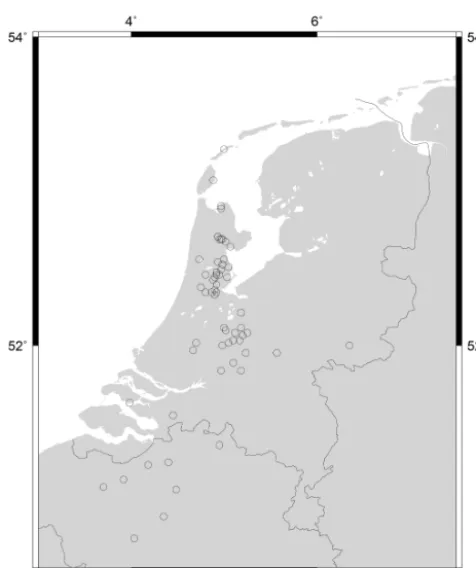
Figure 3.Damage reports compiled from various sources related to the 4 August 1674 storm.
shows hardly any damage in the eastern parts of the Nether-lands. Although these parts were relatively sparsely popu-lated, no damage reports for some larger cities have been found which were related to this storm.
It is interesting that in the westernmost parts of North and South Holland almost no damage was seen (Fig. 3). This re-markable feature is also noted by Kooch (1674, strophe 114), mentioning Alkmaar and Haarlem. Inquiries with the histori-cal societies of the cities Leiden and Delft, close to the North Sea coast but more south than Haarlem, show that no damage is known that is related to this storm (Historical Societies of Delft and Leiden, personal communication, 2016).
At smaller spatial scales, the contrasts in damage are also striking. Kooch (1674, strophe 110) notes that in Amster-dam harbour the ships broke from their moorings and drifted away, while empty barrels on the quay were unaffected. What is striking about the drawings of Saftleven (Fig. 4) is that the houses around the cathedral square, visible in the background of the drawing, still appear to be intact. Even the facades are intact and the pinnacles on the facades appear undamaged. A tree apparently survived the storm. Kooch notes some of these contrasts (strophe 77) when describing how a poorly maintained little house, weakened to the point that it could be brought down “with bare hands” was undamaged by the storm.
The thunderstorms produced a long track of massive de-struction through the province of North-Holland, without los-ing strength. Damage was reported as far as the northern part of Holland at Texel Island.
3 Meteorological interpretation 3.1 Reconstruction
The widespread damage in the east–west direction and the rapid passing of the storm point to a narrow frontal structure passing over the Low Countries. Such cold fronts are com-mon in the summer season, replacing warm humid air with cooler air.
A few sources match the passage of the front to the time of day. Between 18:00 and 19:00 LT (local time) the storm passed Antwerp (Kooch, 1674, strophe 12) to arrive between 19:00 and 19:30 LT at Utrecht (Sweerts, 1674) and just be-fore 20:00 LT (Kooch, 1674, strophe 80) or around 20:00 LT the front passed Amsterdam (Hollandsche Mercurius, 1674). The front passed Koog aan de Zaan between 20:00 and 21:00 LT (Buisman, 2000), which is northwest of Amster-dam. The direction in which the front moved is estimated to be parallel to the line on the west side of the damage reports over the province Holland (north of∼52◦N). Note that even in the small Dutch Republic there were different time zones; these timings are adjusted. When using the distances between the centres of Antwerp, Utrecht, and Amsterdam, and the un-certainties in the timing of the passage of the front, lower and upper bounds of the average speed can be calculated between these cities. For Antwerp–Utrecht and Antwerp–Amsterdam, the lower bounds are 70 and 60 km h−1 respectively
(up-per bounds are unrealistic at >150 km h−1). For Utrecht– Amsterdam, the upper bound is 78 km h−1 (lower bound is unrealistic at 26 km h−1).
Decomposing these estimates into the direction parallel to the movement of the squall line and one perpendicular to it, the average speed of the frontal system on the west side of the front (passing through Antwerp) is about 60 km h−1. More to the east, passing trough Utrecht, the speed is about 65 km h−1. These estimates can only be made consistent with each other by using speeds close to the lower bounds for the Antwerp–Amsterdam and Antwerp–Utrecht sections, and close to the upper bound for the Utrecht–Amsterdam sec-tion. These diverging estimates of the average speed of the frontal system are consistent with a situation that an accel-erating part of the squall line passed Utrecht while the west-ern part of the squall line, travelling at lower speed passed through the area west of Amsterdam.
The distance between Amsterdam and Koog a/d Zaan is too small (≈4 km) and the timing estimates have too large uncertainties to be of much use.
Figure 4.Drawing of the ruin of the Dom cathedral following the 1674 storm by Herman Saftleven (Utrecht City Archive no. 28637 and no. 28630, both views from the southeast).
the existence of a bow echo. A bow echo is formed when the band of convective thunderstorms is combined with a rear-inflow jet. When this rain-cooled downdraft of a thun-derstorm reaches the Earth’s surface, it spreads horizontally and most rapidly in the direction in which the front pro-gresses, producing straight-line winds. The rear-inflow jet advects high-momentum winds from aloft, further enhanc-ing the wind speeds at the surface. Within these areas of con-vective downdraft, or downbursts, smaller pockets of intense winds exist which are referred to as microbursts. Microbursts are characterized by spatial scales of approximately 4 km. Still smaller areas of extreme wind within microbursts are called burst swaths, which range from 40 to 140 m (Fujita and Wakimoto, 1981). The strong heterogeneity at small spatial scales of the storm damages are in line with this concept.
When the rear inflow jet bends the frontal system, bookend vortices develop on either side of the jet which are advected along with the front. The cyclonic vortex in the west will be strong due to the interaction with the Coriolis force, making the winds on the west side of the vortex much weaker, ex-plaining the absence of damage in towns like Haarlem and Alkmaar (which are to the west-northwest of Amsterdam close to the North Sea coastline). The stronger winds due to the bookend vortex at the west end of the squall line could have contributed to the vast damages in Holland. The book-end vortex at the eastern book-end lacks the interaction with the Coriolis force and is much weaker, making the distinction be-tween areas with or without damage further inland less clear than at the west side of the bow echo.
3.2 Is there evidence of embedded vortices?
Apart from the bookend vortex of the squall line, the straight-line wind associated with the bow echo may have embedded vortices which are produced by horizontal shear. There are no observations of a whirlwind in the accounts of Kooch (or elsewhere). However, the direction in which church spires fell in the city of Utrecht may indicate embedded vortices. While the nave of the Dom cathedral and the towers of the Nicolaaskerk fell in a northerly direction (in the same direc-tion as the movement of the front), the drawings of Saftleven show that the two towers of the Pieterskerk (200 m to the ENE) were blown down in the direction of the nave and choir of the church (Fig. 5, left panel). One account (Haer-lemsche Courant, 1674) confirms that the church spires fell through the roof of the Pieterskerk. The nave and choir of the Pieterskerk faced east, indicating that the winds were perpen-dicular to the direction in which the squall line moved and to the direction of the straight-line winds.
dam-Figure 5.Left panel: drawing of the ruin of the Pieterskerk with the spires and part of the church towers removed by the storm. The direction of the fall is into the church. Drawing by Herman Saftleven (Utrecht City Archive no. 28644). Right panel: plan of the Jacobikerk, showing in blue the reconstruction of the direction in which the spire fell in the 1674 storm. In purple, the carillon is shown in its separate spire east of the main spire, with the position of the bells on the church floor after the collapse of the spire. In red, the destroyed arches are shown (which have never been repaired). Figure from Kipp (1974).
age in Utrecht and the direction in which towers there fell is indicated in Fig. 6.
Embedded vortices are also observed in the damage anal-ysed by Fujita and Wakimoto (1981). In a study of a series of destructive windstorms on 16 July 1980 in the American Midwest, the damage of downbursts on a forest was anal-ysed, including the direction in which the trees fell. The pattern of damage reflects the burst swaths associated with these downbursts where most trees fell in the direction of the movement of the front. At the sides of the burst swaths some trees fell sideways or (nearly) against the direction of the movement of the front.
4 Estimate of the strength of the storm
There are no direct measurements of the strength of the mean winds and wind gusts at the surface generated by the down-bursts of the storm. In order to make an assessment of the strength of this storm and a provisional estimate of its return period, two approaches are tried. One relates the observed damage to a wind strength via the Fujita scale (Fujita, 1958; Fujita and Wakimoto, 1981). The other attempts to make a re-turn period analysis using a modern climatology of hail and observed hail size.
4.1 Wind strength estimate
The accounts of the storm from the newspaper reports, the drawings of Saftleven, and especially Kooch’s rhyme are de-tailed to the point that a Fujita damage scale2can be attached to the storm. Below are some of the descriptions of damages related to this storm.
In Kooch’s rhyme are several accounts, mostly from the water-rich northern parts of Holland, of prams being taken up into the air to be transported (in one account) “over sev-eral fields”. A pram is a light tender with a flat bottom and a bow formed from the ends of the side and bottom planks meeting in a small raised transom. The common size of these barges in the province of North Holland was typically 6.6 m×1.4 m×0.4 m (Schutten, 2004). By making an esti-mate of the water displacement, the weight of a loaded pram is estimated at 2000 kg (Dutch National Maritime Museum, personal communication, 2016), while≈600 kg is the esti-mate for an empty pram. There are also numerous accounts of carriages with horses, taken up in the air (Kooch, 1674, strophe 35) and other heavy objects being displaced, like the lead from the roof of Amsterdam’s orphans house (with a weight of more than 1500 kg) which was ripped off, fell to the ground and was transported through three streets (Got-tfried, 1700).
Figure 6.Compiled damages to larger structure in the city of Utrecht. The numbers in blue circles refer to Table 1; blue arrows refer to the direction in which the structure collapsed (details in Sect. 3.2). The large red arrow denotes the direction in which the front moved over Utrecht. Map from J. Bleau (1649), Utrecht City Archive no. 214022.
Table 1.Detailed damage reports within the city of Utrecht and its immediate surroundings. Numbers refer to locations on the map of Fig. 6.
1 Dom Cathedral 2 Abstede
3 Seven windmills on the city wall 4 Towers of Agnieten monastery 5 Towers of St Nicholaaskerk 6 St Servaaskerk
7 Magdalenakerk 8 Geertekerk 9 St Catherinakerk 10 Duitse Huis kerk 11 Mariakerk
12 Roof of the Buurkerk
13 The two towers of the Pieterskerk 14 Nearly all trees on St Jans churchyard 15 Inn just outside Wittevrouwen 16 Gasthuissteeg
17 St Jobs hospital on the way to Vleuten 18 Tower of St Jacobikerk
19 Begijnhof
20 Gate of Bemuurde Weerd
Gottfried (1700) claims that of the eight windmills on the city walls, only three were not severely damaged.
There are numerous accounts of uprooted or snapped trees from Utrecht (such as from the St Jans churchyard) and Am-sterdam where on the Nieuwe Markt (New Market) a heavy
tree (“too large to embrace”) was uprooted and transported across the market for 180 feet (≈50 m) (Kooch, 1674, stro-phe 97).
Of the seven windmills on the city wall of Utrecht, perhaps one survived the storm (Perks, 1974). Two other windmills, just outside the city, survived the storm as well. These wind-mills were post wind-mills, which consists of a large square box, constructed to turn about a heavy wooden pillar (the post). The post is supported by a system of double quarterbars and heavy crosstrees resting on brick piers (Stockhyzen, 1963). This construction makes them vulnerable to strong winds, lifting the square box off the post. Kooch (strophe 124) also tells of the destruction of the wind-powered powder mill in Monnikendam, north of Amsterdam, and the displacement of its six edge runner millstones (vertical millstones which revolve on a circular base), attached pair-wise by a wooden axle.
In Kooch’s poem we find two accounts of objects which are propelled at high speed. One is in Amsterdam, where the lead roofing of the corn exchange was stripped off (es-timated to weigh nearly 2000 kg; Kooch, 1674, strophe 85), broken into 27 pieces – one of these parts being propelled at high speed into the window-frame of the nearby cheese mer-chant’s warehouse. The other account is from Diemermeer (southwest of Amsterdam) where three planks from a shed made a large opening in the thatched roof of a farmstead.
that houses, roofs, and chimneys had been repaired by the time Saftleven made these drawings (some of these draw-ings were made a considerable time later), although Kooch reports (strophe 89) that the waiting time for reparations to houses could be as long as 2 months because of the shortage of bricklayers, carpenters, and glaziers. A similar word of caution applies to the trees seen in the drawings – uprooted trees were strutted after the storm if they could be salvaged.
The description of the Fujita scale for F2 includes “roofs torn off frame houses”, “large trees snapped or up-rooted”, “light-object missiles generated”, and “cars lifted off ground”. With the lighter carriages and prams replacing the description of cars, these descriptions match the accounts of the 1674 storm damage. The F3 scale for “severe damage” describes “roofs and some walls torn off well-constructed houses”, “most trees in forest uprooted” and “heavy cars lifted off the ground and thrown”. In the heavier-hit areas, like the city of Utrecht, such damage to roofs and walls is evident in the drawings of Saftleven. The provinces of Hol-land and Utrecht were almost completely deforested in the 17th century, probably explaining the lack of accounts of large-scale damage to forests, but the account of uprooting of all trees in the St Jans churchyard and elsewhere in and outside Utrecht resonate with this description.
Wurman and Alexander (2005, their Fig. 8) relate ob-served damage of a F4 tornado to obob-served 5 s wind gusts using Doppler measurements and theoretical estimates. Al-though they warn that damage may not be a simple function of peak wind gust and structural integrity, but that other fac-tors like the duration of intense winds may be critical facfac-tors as well, we use their estimates to relate the observed velocity data to damage survey F-scale estimates. Their analysis sug-gests that damage scaled between the F2 and F3 scale relates to 5 s wind gusts of approx. 85–90 m s−1.
There are insufficient grounds from the damage reports of the 1674 storm to related widespread damage to the stronger F4 and F5 ratings. The damage descriptions relating to the F4 rating are “well-constructed houses levelled”, “structures with weak foundations blown away some distance”, and “cars thrown and large missiles generated”. Although many houses have been severely damaged in the 1674 storm, the qualification above is too strong. Similarly, there is evidence that missiles were generated, but all these relate to planks or a piece of lead roofing which do not qualify as “large mis-siles”.
The Enhanced Fujita scale3is difficult to apply to the Eu-ropean situation of 1674 since most of the damage descrip-tions relate to the typical American 20th century situation (like automobile showrooms). However, there are some ele-ments in this scale which are more general. The uprooted de-ciduous trees scale 3 in the degree of damage rating, with as-sociated estimates of 91 mph (≈40 m s−1) 3 s wind gust. The large-scale destruction of wooden houses, the many accounts
3http://www.spc.noaa.gov/faq/tornado/ef-scale.html
Figure 8.Maximum observed hail size (one value per year, mini-mum value 2 cm) from Finland (Tuovinen et al., 2009) in relation to return times, using a Gumbel distribution.
of damage to roofs and walls and the drawings of Saftleven of destroyed stone houses scale 6 to 10 in the degree of damage rating for “one and two family residences”, giving an esti-mate of 122–200 mph (≈55–90 m s−1) wind gusts. With this estimate, the assumption is made that 17th century houses, of which many still exist in Dutch cities, were of comparable quality to the residences alluded to in the Enhanced Fujita scale.
Note that the Fujita scale relates to rotational winds and may not be directly applicable to straight-line winds. 4.2 Return period estimate
The severest damages caused by this storm are from the wind gusts and a return period estimate should be based on the strength of the wind gusts. However, a climatology of wind gusts related to downdrafts is not available in the Netherlands or surrounding countries. As an alternative, we turn to hail stones for an estimate of the return period.
There are frequent observations of severe hail and massive hail stones. Gottfried (1700) notes that the weight of the hail stones observed near Paris were “three and a half pound”. In Strasbourg (NE France) the size of the hail stones were as large as “a baby’s head” and weighed as much as 2, 3, 4, or even 7 pounds. The damage to the glass windows in this city amounted to NLG 16 000 (Gottfried, 1700), the equiva-lent of≈EUR 163 000 (Luiten van Zanden, 2010). Damage to windows in churches is also noted by Kooch (1674, stro-phe 3). The amount of hail in Frankfurt am Main was knee-deep (Gottfried, 1700).
The modern equivalent of the “pound” mentioned in these reports is difficult, and the weight of a pound varied from region to region and depended on the goods to be weighed (butter having for instance a special “butter pound”)4. This
makes the translation from these observations into modern metrics difficult. The size (∼diameter) is more useful, al-though Knight and Knight (2005) comment on the issues of quantifying hail size by diameter (given that severe hail is usually not very symmetric).
The largest hail observed during the 1674 event was the hail in northern France, estimated to be somewhere be-tween 15 and 20 cm. This account seems to be a single ob-servation and one source reported this. However, reports of extreme hail (both size and quantities) are mentioned by sev-eral sources for many other places, making the possibility to observe extremely large hail stones less unlikely. Never-theless, the uncertainty on this observation is considerable. Hail of this size (20 cm) has earlier been observed in South Dakota (USA)5, and weighted about 0.9 kg. During a hail storm in southwestern Germany on 6 August 2013, hail of up to 14 cm in diameter was observed (Punge and Kunz, 2016). The Netherlands has no climatology of hail, so the ac-counts of the size of hail stones cannot be compared to modern measurements. A climatology of severe hail, cover-ing the period 1930–2006 is available in Finland (Tuovinen et al., 2009). Although southern Finland is at a much more northerly latitude than the Netherlands, the summer climates are remarkably similar. The average daily maximum temper-atures for southern Finland and the Netherlands are 20.1 and 21.9◦C respectively and the number of summer days (days where the daily maximum temperature is≥25◦C) are 17.0 and 20.5 respectively, calculated over the 1981–2010 clima-tological period6. Tuovinen et al. (2009) have collected ac-counts of severe hail (diameter of 2 cm or more) by news-paper report, storm spotters, and eyewitness reports. Most of their cases (84 %) occurred from late June to early Au-gust, with the most severe hail occurring in late afternoon and early evening (14:00–20:00 LT). These severe cases oc-curred most often in western and southern Finland.
An estimate of the return times of severe hail can be tained by fitting a Gumbel distribution to the maximum ob-served hail size per year (one value each year). Figure 8 shows the plot of these data. The observations with the largest diameter (three observations of 8.0 cm) appear to de-viate a little from the straight-line fit in this Gumbel plot. This may be due to the perhaps somewhat approximate character with which severe hail is quantified. People often compare large hail to objects of similar size (like baseballs), meaning that these sizes appear more often in observational records (Knight and Knight, 2005).
Using the Finnish data as a proxy for the circumstances in the Low Countries, the return time of hail with a diame-ter between 15 and 20 cm is estimated to be more frequent than once every 103years and less frequent than once every 104years. Note that the uncertainty in these estimates, due to
5http://www.weather.gov/media/abr/vivian/
073010RecordHailVibianSD.pdf 6http://www.ecad.eu
the extrapolation of the hail size is large. These return periods should be regarded as cautious estimates only.
5 Comparison against a recently observed bow echo A modern – but much less devastating – equivalent to the summer storm of 1 August 1674 is the squall line with an em-bedded bow echo that occurred on 14 July 2010 and passed over Belgium, the westernmost part of Germany and the southeast of the Netherlands.
The most active part of this frontal system was part of a long squall line which extended into Switzerland and it caused severe wind damage in the Netherlands, particularly near the villages of Vethuizen, 85 km ESE of Utrecht, and Neerkant (60 km SSW of Vethuizen). The storm caused two casualties in Vethuizen.
The Vethuizen storm is described in some detail in this section based on an earlier technical report (Groenland et al., 2010), in terms of damage and meteorological interpretation, and the similarities between the 1674 storm and this modern equivalent are pointed out.
5.1 Damage survey
The progression of the squall line is shown in Fig. 11 with 30 min time steps. The first report of strong wind gusts was at 15:32 UTC at Maastricht Aachen airport (southernmost part of the Netherlands) with 31 m s−1. Somewhat later, a gust of 34.2 m s−1 was measured at the Volkel airbase after which the anemometer broke down due to a lightning strike.
An onsite survey was carried out by a team of the Royal Netherlands Meteorological Institute (Groenland et al., 2010) shortly after the event. This showed a destroyed farm with its tiles removed from the roof, the chimney broken off and part of the facade of the farm destroyed. The farmer re-ported heavy rains, obstructing his view through the win-dows, and a very short period (half a minute) in which the damage occurred. Near the farm poplar trees, aged between 40 and 70 years, were snapped or uprooted. Further down the road, a hotel lost its thatched roof but the tiles on a neighbour-ing buildneighbour-ing were not damaged. The two casualties died on the nearby camping site, where their caravans rolled over and were transported to the lake on the camping site (a distance of a few tens of metres). Large damage occurred to five power pylons in this area which were blown down. An analysis of the power company indicates that these pylons were blown down simultaneously and that a “domino” effect, where one falling pylon pulls down a second, was not present. The di-rection of the fall of all these pylons was in the didi-rection of the movement of the frontal system.
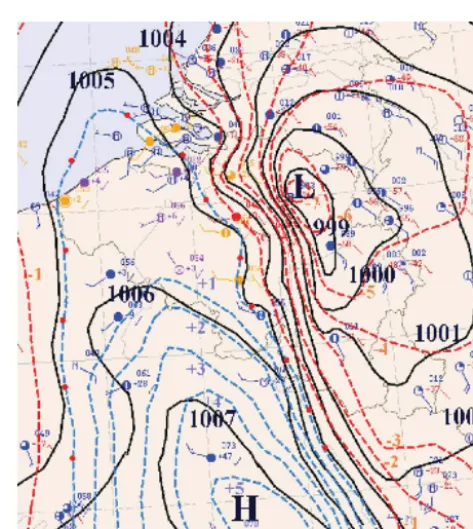
Figure 9.Weather chart of 14 July 2010, 18:00 UTC. The chart shows the low-pressure system south of Ireland and the cold front, displacing the warm continental air with cooler air from the Bay of Biscay, as a blue line with closed triangles.
in this area were also destroyed; one greenhouse lost all its glazing while another was detached from its foundations and moved for about 8 m. Observations of trees falling in other directions than the direction of the movement of the frontal system were made.
5.2 Synoptical analysis
European weather maps (Fig. 9) show a low-pressure area, of just below 990 hPa, south of Ireland, and in combination with a powerful ridge of high pressure, a southern flow over the Low Countries is generated. This replaced the warm con-tinental air, with temperature above 30◦C, with cooler air
from the Bay of Biscay. The enhancement of thermal con-trasts over western Europe fuelled the development a thermal low.
The centre of this heat low was present in Belgium at 15:00 UTC (Coordinated Universal Time, Fig. 10), with a pressure of 998 hPa. The strong air pressure gradient south-west of the centre is remarkable – as in the observed pres-sure drop of 7 hPa/3 h prior to the arrival of the cyclone and pressure increases of nearly 6 hPa/3 h after the passage of the centre in the area of the city of Reims (northern France). Less than 30 min later, the cyclone arrives in the Netherlands, passing in 6 h towards the eastern parts of the Netherlands. Figure 10 shows the synoptical observations of wind direc-tion, wind speed, cloud cover, pressure, and pressure change. The track of the frontal system was in the NNE direction and its speed decreased gradually. At 14:00 UTC, the speed was about 85 km h−1while at 17:00 UTC is was moving at 78 km h−1.
The radar image of 16:30 UTC (Fig. 11) coincides with the passage over the village of Vethuizen. The strongly de-veloped squall line is seen in this image. The red values re-late to precipitation with an intensity of over 30 mm h−1. On
Figure 10.Synoptic analysis of 14 July 2010 15:00 UTC. Isobars are solid black lines, dashed red and blue lines are isallobars, show-ing pressure drops and pressure increase respectively. Station obser-vations indicate wind direction and strength and the (partly) filled circles show the cloudiness.
Figure 11. Rainfall intensity from radar images on 14 July 2010, from 15:00 to 18:30 UTC. Red denotes precipitation intensity of over 30 mm h−1.
cause downdrafts and wind gusts which are held responsible for the observed damage.
The horizontal shear causes rotations which are sometimes referred to as gustnados.
A theoretical estimate of the maximum possible wind gust, under the most ideal circumstances, gives a value of 50 to 55 m s−1(about 180–200 km u−1). The characteristic spatial scales at which such high values occur are too small for the density of the observing network to be measured.
5.3 Similarities and differences between the 1674 and the 2010 events
From the meteorological perspective, many similarities can be observed between the 1674 and the 2010 situation. The direction of movement of the squall line, from SSW to NNE, is similar and matches the direction of movement of the strongest squall lines in the modern climatology of the Netherlands. The velocity of the squall line in the 1674
sit-uation is perhaps a little slower (≈60 km h−1) compared to the 2010 event (≈85 km h−1). Witness reports of the modern event indicate that the strongest winds passed in a time of 5–10 min, while it took 15–20 min. before the rains stopped. The time of passage of the squall line seems shorter in the 2010 event than the 1674 event. The similarity in the direc-tion of movement of the squall line between the 1674 and modern climatology makes it very likely that the 1674 case was associated with the passage of a cold front.
The theoretical maximum of wind gust strength in the 2010 event (≈50–55 m s−1) is somewhat smaller than the
maximum wind gust estimated during the 1674 event (max. 90 m s−1).
While both the difference in max wind gust and the speed at which the squall line passed will have contributed to the less extensive damage in the 2010 case as compared to the 1674 situation, the possible development of multiple seg-ments with a bow-echo structure along the squall line in the 1674 case will have made the area over which violent wind gusts develop much larger. However, the lack of sufficient de-tail in the observations prevents confirmation or reconstruc-tion of these structures.
6 Discussion and conclusions
Estimates of the number of people severely injured or dead due to this storm are lacking. There are anecdotes mentioning people getting injured, like hail stones bruising people caught in the fields (Kooch, 1674, strophe 72), or people getting hit by falling trees or other debris. Gottfried (1700) mentions the death of more than 1000 people blown in the water and drowned within a distance of less than “half a mile” from Amsterdam. The lack of estimate of the loss of life makes it seem that the impact of this storm was most profound in terms of material loss, but the human cost must have been extensive.
A cultural-historical perspective of this storm is provided by Hauer and Pfeifer (2011) and their study on the human dimension gives some clues how contemporaries dealt with such calamities. In this study, the damage is related to a single tornado rather than straight-line winds on a squall line associated with an active cold front. Although the evi-dence from the Pieterskerk and the Jacobikerk points to the presence of vortices embedded in the straight-line winds, the straight-line winds account for the largest part of the widespread damage in the city of Utrecht and in the Low Countries in general. A single tornado causing the collapse of the Dom cathedral is unlikely since this would produce a damage trail in the city much more confined that what is observed.
It has been argued that the nave of the Dom cathedral might have been more vulnerable because of the lack of fly-ing buttresses and because of havfly-ing a roof supported by a wooden structure rather than an overarching stone structure (den Tonkelaar, 1980). However, de Kam et al. (2014) ob-serve that in the Netherlands many churches still exist with-out an arched roof and apparently survived the centuries, like the St Bavo in Haarlem. Although the city of Haar-lem was just west of the western bookend vortex, meaning that the wind gusts there were not as strong as elsewhere, the more active part of the front passed over the St Jan in Gouda and the New Church in Amsterdam which have sim-ilar roofs as the nave of the Dom cathedral. The windows of
these churches were damaged due to hail and, in the case of the New Church in Amsterdam, the hail damaged the roof as well, but these structures remained largely intact during the storm. Similar to the Dom cathedral, the orientation of these churches have their choirs facing eastward (de Kam et al., 2014, 269–270), which means that the wind gusts hit these churches from the side as well.
A comparison with a modern bow-echo event from 2010 shows many similarities in terms of the meteorology. The severest of summer storm events in the past century in the Netherlands occurred in the early evening of 10 August 1925 in the town of Borculo (van Everdingen, 1925). Similar to the 1674 event, this event was initially related to a single tor-nado. The damage caused by the 1925 event can be traced from the southeastern part of the Netherlands in the NNE direction to the eastern parts of the Netherlands over an in-terrupted path several tens of kilometres wide. Areas with additional damage were found north and south of this path. Although at several places the characteristic cone associated with a tornado has been spotted, most of the damage of this event is related to downdrafts (Wessels, 1968). It is interest-ing that the confusion on the cause of the damage (tornado vs. straight-line winds) is commented on by Fujita and Waki-moto (1981) who indicate that “this type of damage has of-ten been reported as tornado damage” rather than as due to straight-line winds from a downdraft.
Although direct meteorological measurements of the events of 1 August 1674 are lacking (the earliest instru-mental weather observations were made in 1697), the me-teorological interpretation of the contemporary reports indi-cates that the widespread damage from northern France into Holland was caused by an exceptionally active cold front. Strong downbursts generate straight-line winds where the strongest wind gusts are estimated to have a speed of up to 90 m s−1. While the damages to the Dom cathedral and the Nicholaaskerk are in the direction of the movement of the front, embedded vortices in this front, due to horizon-tal shear, explain the direction of the fall of the towers of the Pieterskerk and the tower of the Jacobikerk which is not aligned with the direction of movement of this front. Esti-mates of the return period of this cold front, based on the size of the hail, indicate that this event is a very rare event with a return period much larger than once every thousand years.
7 Data availability
The Supplement related to this article is available online at doi:10.5194/nhess-17-157-2017-supplement.
Competing interests. The authors declare that they have no conflict
of interest.
Acknowledgements. The authors wish to thank René de Kam and
Frans Kipp for their enthusiasm and in-depth knowledge of the his-tory of Utrecht. Jari Tuovinen (FMI) is thanked for making available the hail climatology of Finland and Henk van den Brink (KNMI) is thanked for his assistance in making the Gumbel plot. Marja Goud (National Maritime Museum) is thanked for her information on the prams of North Holland.
Edited by: V. Kotroni
Reviewed by: A. De Kraker, P. Brohan, and one anonymous referee
References
Amsterdamse Courant: Amsterdamse Saturdaghse Courant, http://www.delpher.nl/nl/kranten/view?coll=ddd&identifier= ddd:010899153:mpeg21:p002 (last access: 4 January 2016), 4 Augustus 1674.
Buisman, J.: Duizend jaar weer, wind en water in de lage landen, in: IV (1575-1675), Uitgeverij Van Wijnen, Franeker, edited by: van Engelen, A. F. V., KNMI, De Bilt, 2000.
de Kam, R., Kipp, A. F. E., and Claessen, D.: De Utrechtse Dom-toren. Trots van de stad, Uitgeverij Matrijs, Utrecht, 2014. den Tonkelaar, J. F.: Het middenschip van de Dom vernietigd door
een tornado? De stormramp van 1 augustus 1674 meteorologisch verklaard, jaarboek Oud-Utrecht, Utrecht, 95–109, 1980. Fujita, T. T.: Proposed characterization of tornadoes and hurricanes
by area and intensity, Tech. Rep., vol. 91, sMRP research paper, University of Chicago, Chicago, 1958.
Fujita, T. T. and Wakimoto, R. M.: Five Scales of Airflow Associated with a Series of Downbursts on 16 July 1980, Mon. Weather Rev., 109, 1438–1456, doi:10.1175/1520-0493(1981)109<1438:FSOAAW>2.0.CO;2, 1981.
Gottfried, J. L.: Vervolgh op J. L. Gottfrieds Historische Kronyk. Tweede Deel Van’t Jaer 1637. Tot 1698, Pieter van der Aa, Lei-den, 1700.
Graafhuis, A.: “het Schricklijck Tempeest” van 1674 tussen Rijn en Lek, Tussen Rijn en Lek, 8, 1–20, 1974.
Graafhuis, A. and Snoep, D. P.: 1 augustus 1674 De Dom in Puin. Herman Saftleven tekent de stormschade in de stad Utrecht, cat-alogue of the (similarly named) exhibition organized by the Mu-nicipal Archives of Utrecht, Utrecht, 1974.
Groenland, R., Hemink, J., Kuiper, J., and Wever, N.: Het noodweer van 14 juli 2010 in Vethuizen, Neerkant en omgeving. Meteorol-ogisch onderzoek en achtergronden, Tech. Rep. publicatie 228, edited by: Groen, G., KNMI, De Bilt, 2010.
Haerlemsche Courant: Opregte Haerlemsche Courant, http: //www.delpher.nl/nl/kranten/view?coll=ddd&identifier=ddd: 010927319:mpeg21:p002 (last access: 4 January 2016), 4 Au-gust 1674.
Hauer, K. and Pfeifer, N.: Reporting on historical severe storms: Two examples of Utrecht (1674) and Abtenau (1796), Atmos. Res., 100, 580–585, doi:10.1016/j.atmosres.2010.08.007, 2011. Hollandsche Mercurius: Hollandsche Mercurius, https://books.
google.nl/books?id=phxbAAAAQAAJ&lpg=RA1-PA150&ots= cKVKKGHDPH&dq=Hollandsche+Mercurius+van+augustus+ 1674&hl=nl&pg=RA1-PA163#v=onepage&q&f=false (last access: 4 January 2016), August 1674.
Kipp, A. F. E.: Herman Saftleven en de Storm van 1674, doctor-aalscriptie bijvak Algemene Kunstgeschiedenis na 1200, Rijk-suniversiteit Utrecht, Utrecht, 1974.
Knight, C. A. and Knight, N. A.: Very large hailstones from Aurora, Nebraska, B. Am. Meteorol. Soc., 86, 1773–1781, doi:10.1175/BAMS-86-12-1773, 2005.
Kooch, G. J.: Archief Familie Alberdingk Thijm, arch. no. 520, inv. no. 120, Gemeentearchief Amsterdam, Amsterdam, 1674. Luiten van Zanden, J.: The prices of the most important
con-sumer goods, and indices of wages and the cost of living in the western part of the Netherlands, 1450–1800 (data supplied by Jan de Vries, Jan Pieter Smits and Arthur van Riel), http: //www.iisg.nl/hpw/brenv.php (last access: 4 January 2016), 2010. Perks, W.: Zes eeuwen molens in Utrecht, Het Spectrum,
Utrecht/Antwerpen, 1974.
Pfeifer, K.: On the Representation of an Early Modern Dutch Storm in Two Poems, Culture Unbound, 7, 433–454, 2015.
Punge, H. J. and Kunz, M.: Hail observations and hailstrom char-acteristics in Europe: A review, Atmos. Res., 176–177, 159–184, doi:10.1016/j.atmosres.2016.02.012, 2016.
Schutten, G. J.: Verdwenen schepen. De kleine houten beroepsvaar-tuigen, vrachtvaarders en vissersschepen in de Lage Landen, PhD thesis, Rijksuniversiteit Groningen, relation: http://www. rug.nl/, Rights: Uitgeversmaatschappij Walburg Pers, 2004. Stockhyzen, F.: Molens, C. A. J. van Dishoeck, Bussum, in Dutch,
English translation available at: http://www.let.rug.nl/polders/ boekje/ (last access: 4 January 2016), 1963.
Sweerts, H.: Pertinente Notitie van de Schade die geschiet is tot Utrecht, door’t schrikelik Tempeest, op Woensdag den eersten Augustus 1674, Nieuwe Stijl. (printed in Buisman, 2000), 1674. Tuovinen, J.-P., Punkka, A.-J., Rauhala, J., Hohti, H., and Schultz, D. M.: Climatology of Severe Hail in Finland: 1930–2006, Mon. Weather Rev., 137, 2238–2249, doi:10.1175/2008MWR2707.1, 2009.
van der Aa, A. J.: Aardrijkskundig woordenboek der Nederlan-den, Bijeengebracht door A. J. van der Aa onder medewerking van eenige Vaderlandsche Geleerden, Jacobus Noorduyn, Gor-inchem, 1839.
van Everdingen, E.: De cycloonachtige windhoozen van 10 augus-tus 1925, Hemel en Dampkring, 23, 305–316, 1925.
Wessels, H.: De zware windhozen van 25 juni 1967, Hemel en Dampkring, 66, 155–177, 1968.