IJEDR1904059 International Journal of Engineering Development and Research (www.ijedr.org) 332
Performance of vertically irregular multi-storey
structure with influence of angle under seismic
displacement demand by 2D ground motion
1Ashok Kumar, 2Ankush Kumar Jain 1M.tech. Student, 2Assistant Professor
Poornima University
_____________________________________________________________________________________________________
Abstract - The expectation from the structures, in terms of strength, energy conservation, and aesthetics, have been increased significantly and therefore new modern complex irregular buildings are coming into existence since the beginning of 2000. In order to analyse these irregular buildings, the methods should be more accurate so that any un-happening can be prevented. The aim of this study is to provide a better understanding of analysis of regular as well as irregular frame structure with storey displacement, storey drift and angle of incidence of earthquake under different conditions and limitations. For this study, we developed 3 models for regular and irregular building with similar floor plan, material and configuration. The first model is for regular building, the second model is for 1-stroey setback irregular building and the third model is for 2-storey setback irregular building. Each model was subjected to a real recorded ground motion at 0º, 30º, 45º, 60º, 90º, 120º, 135º, 150º and 180º of building in horizontal direction. A non-linear direct integration time history analysis performed using ETABS software. After dynamic analysis, obtained results shows displacement for each model building under the variation in incidence of angle of 2D ground motions. It can be seen from the obtained results that the displacement in direction of any type of building depends upon the frequency of input ground motions. Also, the response parameter demand increases and more than the allowable limit as per IS 1893:2002 due to variation in incidence of angle of earthquake and increase irregularity. The critical angle of incidence for various buildings is because of the change in geometry, stiffness and fundamental time period of building. The maximum values of the response parameter also depend on the orientation of columns of building. For the same loading in a particular direction, the irregular building has shown superior behavior in comparison to the regular frame.
keywords - Irregular Building, Regularity index, Time History Function, ETABS.
_____________________________________________________________________________________________________
I. Introduction - Buildings with varying floor areas throughout some part of height or full height. The floor area may increase towards the upper storey or the bottom storey, in simple words, the lateral dimension of the building is reduced along its height. With the plot area being constant, normally the floor area ratio of irregular buildings is lower than the regular buildings. The reasons behind the selection of irregular buildings are architectural aesthetics, more use of natural daylight and good circulation of air. Although the first irregular building came into existence in the early 2000s.
Figure 01 - Concept of Vertical Geometric Irregularity from IS 1893:2002[12]
The behavior of these multi-storey irregular buildings under the influence of seismic forces must be understood, as the damage from the earthquake starts at locations of structural weakness. Structural weakness may be present due to a number of factors like relative stiffness, mass, and strength of connected stories. Any discontinuity in these factors will cause significant damage to the concrete structure.
It is not fairly simple to define the actual irregularity present in any structure. But for this study, we are following some standard definitions described by IS 1893 to check the vertical irregularity present in the building. According to the code provision, vertical geometric irregularity will be present in the building if the ratio of the horizontal dimension of the adjacent storey of the lateral load resisting frame is more than 150%.
IJEDR1904059 International Journal of Engineering Development and Research (www.ijedr.org) 333 in upper floors. All these models are considered for a different angle of incidence of ground motion and the analysis result of each model is used to develop a relationship and prepare a comparison of the study.
These models floor and elevations plan are slightly similar to the models developed by Pradeep Sarkar for his research work “Vertical Geometric irregularities in stepped building frames”[06] except some changes in horizontal bays and floor to floor height. The each building model have 5-bays of 6m each in horizontal orthogonal direction. The storey height for each model from ground to first floor is assumed as 4.5m while for upper floor it is considered as 3.5m. So it makes a superstructure of 53.5m high. The top level of foundation assumed at 1.52m below ground level. So the total height of building is 55.02m.
The selection of flexural and compression members of structure have done on the basis of general requirement of standard code IS 13920: 1993. The membrane type slab element of 150mm thickness is considered for all the floor of each model.
The general requirements for flexural members as per the IS 13920: 1993 are shown below.[01] • The member with a width to depth ratio more than 0.3 is more satisfactory for frame structure.
Width / Depth ≥ 0.3 (Section 6.1.2) • The minimum width of member should be 200mm.
Width ≥ 200mm (Section 6.1.3)
The general requirement for compression members as per the IS 13920: 1993 are shown below.
• The minimum width of the column should not be less than the 300mm if the centre to centre span of beam exceeds 5m. Here Width = 300mm (Section 7.1.2)
• The ratio of small dimension to the long dimension of cross-section should not be less than 0.4. Shorter Dimension / Longer dimension ≥ 0.4 (Section 7.1.3)
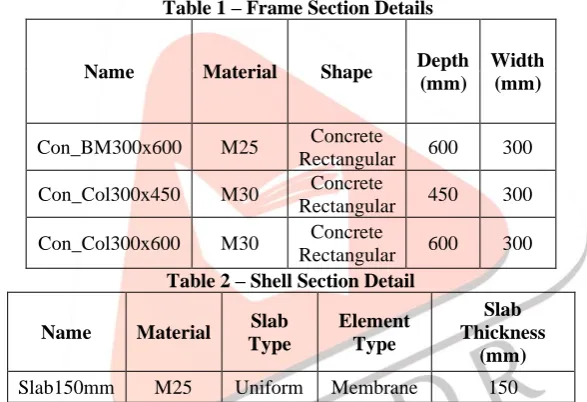
The details of frame sections and shell section defined in ETABS are shown in tabulated form below. Table 1 – Frame Section Details
Name Material Shape Depth
(mm)
Width (mm)
Con_BM300x600 M25 Concrete
Rectangular 600 300 Con_Col300x450 M30 Concrete
Rectangular 450 300 Con_Col300x600 M30 Concrete
Rectangular 600 300 Table 2 – Shell Section Detail
Name Material Slab Type
Element Type
Slab Thickness
(mm)
Slab150mm M25 Uniform Membrane 150
The material used for this study is reinforced cement concrete of different grade for different element. For flexural members (beam) and slab the grade of concrete is M25 while for the compression members the grade of concrete is M30.
Table 3 – Materials Properties
Name E
(Mpa) ν α (1/C)
G (Mpa)
Unit Weight (kN/m³)
Unit Mass (kg/m³)
Fc (Mpa)
M25 25000 0.2 5.50E-06 10416.7 24.9926 2548.538 25
M30 27386.1 0.2 5.50E-06 11410.9 24.9926 2548.538 30
3-dimensional models were prepared in ETABS for different type of building. Each building was subjected to real recorded time history loading at different angle in horizontal direction other than the principal axis of the building. The principle axis of models were assigned by keeping Z-axis upside along the height of building while the X and Y-axis in the horizontal plane of building with 90° (orthogonal) to each other. So we have total 3 ETABS models for analysis with a different name for a different building.
IJEDR1904059 International Journal of Engineering Development and Research (www.ijedr.org) 334 3. Model 3 – Model S2
Model – R Model – S1 Model – S2
Figure 02 – ETABS Models Elevation
Each floor of each model was assumed to act as semi-rigid diaphragm. When the building is subjected to lateral loading, the semi-rigid diaphragm will generate a more accurate distribution of forces to the lateral load resisting system. And all the floor element will behave homogeneously as one node and it will give better storey displacement results.
(i) Dead and Live Load - Self-weight is considered as Dead Load in the Program. By default, Concrete density is taken as 24.9926 KN/M3. Also, a dead load of 2 KN/M2 for floor finishes is applied on all the floors of each and every case of the three types of buildings being considered. A live load of 4 KN/M2 is applied on the all the floors except on the roof storey, on the roof a live load of 2 KN/M2. For brick masonry, a uniformly distributed load of 9.6 KN/M on the beam element of ground floor level, a U.D.L. of 7.14 KN/M on the beam element of all remaining floor levels except the roof level. This loading is defined under the Super-imposed load type.[10,11]
(ii) Seismic Loading - In order to define seismic load pattern, the building is assumed to be situated in Zone III, the respective zone factor is 0.16, soil condition is assumed to be medium type, importance factor is taken as 1, response reduction factor is taken as 5 as per the codal provision of IS 1893:2002.[12]
The Fundamental natural time period for regular typed moment-resisting framed structure without masonry infills can be determined by the empirical formula provided by IS 1893:2002.
T = .075 h0.75 (for RC framed structure) sec. 7.6.1 Where, h = height of superstructure
But in the present study, we also consider the irregular framed structure, so in order to calculate the actual fundamental time period of the irregular type framed building we have used the correction factor defined by the “Pradeep Sarkar”[06]. Correction factor depends upon the proposed regularity index by the “Pradeep Sarkar”[06]. Regularity index is the ratio of 1st mode participation ratio of irregular and similar regular building. The 1st mode participation ratio is calculated by static analysis of regular and irregular framed buildings.
Regularity Index (η) = Ґ1/ Ґ1 (ref.)
Where Ґ1 = 1st mode participation factor for irregular building. Ґ1(ref.) = 1st mode participation factor for similar regular building.
Correction factor for fundamental time period of irregular building by using regularity index is given below:
IJEDR1904059 International Journal of Engineering Development and Research (www.ijedr.org) 335 Regularity index for Model-S1 and S2 are 0.92 and 0.81, and the correction factor for time period by considering the regularity index for Model-S1 and S2 are 0.87 and 0.76 respectively.
Fundamental time period for irregular building is:[06] T = 0.075h0.75 x k
So the fundamental time period according to the empirical formula given by IS 1893:2002 and modified formula for Model-R, S1 and S2 are 1.48sec, 1.29sec and 1.13sec respectively.
P-∆ Analysis: In the present study we have used the non-iterative mass-based P-∆ effect for faster computation, in which the additional moment contribution to the overturning and torsional moment due to the vertical loads acting at increasing lever arms caused by the lateral deflection of building.[04]
Mass source can be defined as the mass contribution due to the specified load patterns in the analysis. Mass participation for this particular mass source in case of dead and masonry is 100 % and in the case of live load, it is 25 %.
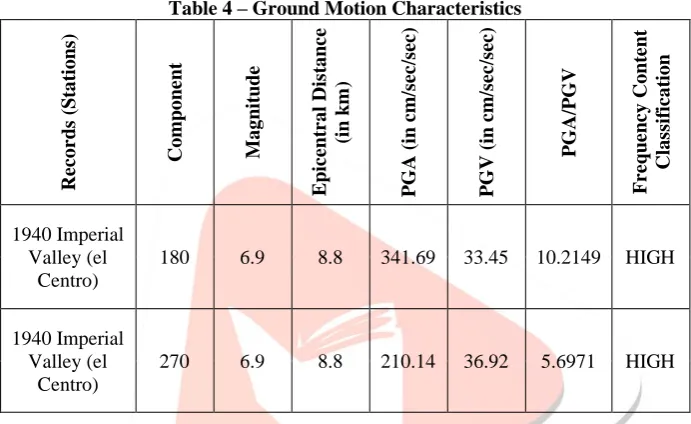
(iii) Time History Function - In time history analysis we have taken unscaled real recorded seismic data from Imperial Valley
Earthquake May 18, 1940. In the present study, we have considered only two translational components of earthquake data for
bi-directional dynamic analysis. The ground motion characteristics based on frequency content are shown below:[13] Table 4 – Ground Motion Characteristics
R ec or d s ( S tat io n s) C om p on en t M agn it u d e E p ic en tr al D is tan ce (in k m ) P G A ( in c m /s ec /s ec ) P G V ( in c m /s ec /s ec ) P G A /P G V F re q u en cy C on te n t C la ss if ic at io n 1940 Imperial Valley (el Centro)
180 6.9 8.8 341.69 33.45 10.2149 HIGH
1940 Imperial Valley (el
Centro)
270 6.9 8.8 210.14 36.92 5.6971 HIGH
In this study, the building is at a significant distance from the location of the earthquake that is referred in time history analysis. The spectrum of the building site cannot be same at any condition to the recorded spectra of earthquake data referred, so if we use the unscaled data directly, the response of the structure may be small or large depending on the spectrum of the earthquake data.
For matching the recorded ground motion data with the building site, a target response spectrum curve for zone factor 0.16, medium soil condition and for damping ratio of 5% as specified by the IS 1893:2002 is defined in ETABS. The real recorded data is matched with the response spectrum curve in specific time domain.
The matched acceleration time history and response spectrum curve are shown below:
Graph 01 – Acc. vs Time Graph (Match-X component 180º) -0.2 -0.1 0 0.1 0.2 0 0
.4 0.8 1.2 1.6 2 2.4 2.8 3.2 3.6 4 4.4 .84 5.2 5.6 6 6.4 6.8 .27 7.6 8 8.4 8.8 9.2
A cc elera ti ion (m/ sec 2) Time (sec)
IJEDR1904059 International Journal of Engineering Development and Research (www.ijedr.org) 336 Graph 02 – Acc. vs Time Graph (Match-Y component 270º)
(iv) Load cases - we have considered linear static for load defined above, but for the dynamic analysis with real recorded ground motion data we have considered non-linear direct indirect time history analysis.
Load cases used for the study are as follows:
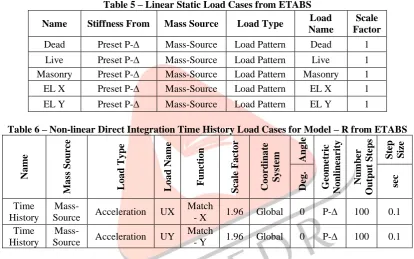
Table 5 – Linear Static Load Cases from ETABS
Name Stiffness From Mass Source Load Type Load Name
Scale Factor Dead Preset P-∆ Mass-Source Load Pattern Dead 1
Live Preset P-∆ Mass-Source Load Pattern Live 1 Masonry Preset P-∆ Mass-Source Load Pattern Masonry 1 EL X Preset P-∆ Mass-Source Load Pattern EL X 1 EL Y Preset P-∆ Mass-Source Load Pattern EL Y 1
Table 6 – Non-linear Direct Integration Time History Load Cases for Model – R from ETABS
N am e M as s S ou rc e L oad T yp e L oad N am e F u n ct io n S cal e F ac tor C oor d in at e S ys te
m An
gl e G eom et ric N on li n ear it y N u m b er O u tp u t S te p s S te p S iz e D
eg. sec
Time History
Mass-Source Acceleration UX
Match
- X 1.96 Global 0 P-∆ 100 0.1 Time
History
Mass-Source Acceleration UY
Match
- Y 1.96 Global 0 P-∆ 100 0.1
(v) Angle of Incidence of Loading - As defined above the main objective of the present study is to analysis the regular and irregular structure for incidence of angle of ground motion data. As shown in table 6 the angle of loading is 0° and the data is only for Model – R. Similarly each model was assigned the dynamic loading by changing their angle is incidence and scale factor. The angle of incidence varying as 0°, 30°, 45°, 60°, 90°, 120°, 135°, 150° and 180°. And the response of each model for different angle of incidence was observed and comparison have been made to establish a relationship for angle of incidence and irregularity.[02]
III. Result and Discussion - The results obtained from the analysis were due to only time history load combination. The time history load combination is maximum and minimum in each horizontal direction at each time step. The maximum time history load combination is a positive value and it is the maximum (addition) of all the maximum values of analysis case. While the minimum time history load combination is a negative value and it is the maximum of all minimum values of analysis case. So response due to larger value of each of minimum load combination in comparison of maximum load combination is checked in X and Y - Axis below.
(i) Model – R Analysis Result - Model – R has the most regular shape and geometry in comparison to the other two models. With the angle of incidence of earthquake varying from 0 to 180 in each model. Results shown here includes graphs for displacement under the influence of loads in X and Y axis as loads are defined in only these two directions.
Maximum displacement was observed under the angle of incidence 45̊ on the Model-R building in X-axis due to minimum time history load combination as shown in graph 03. Maximum displacement was observed under the angle of incidence 30̊ on the Model-R building, and least displacement was observed when the angle of incidence was 180̊ in Y-axis due to minimum time history load combination as shown in graph 04.
-0.2 -0.1 0 0.1 0.2 0 0
.4 0.8 1.2 1.6 2 .42 2.8 3.2 3.6 4 4.4 .84 5.2 5.6 6 6.4 6.8 7.2 7.6 8 8.4 8.8 9.2
A cc elera ti ion (m/ sec 2) Time (sec)
IJEDR1904059 International Journal of Engineering Development and Research (www.ijedr.org) 337 Graph 03 – Model – R: Storey Displacement under Minimum Time History Load Combination in X-axis
Graph 04 – Model – R: Storey Displacement under Minimum Time History Load Combination in Y-axis
(ii) Model – S1 Analysis Result - Model – S1 have the irregularity of setback of one storey. Less irregular shape and geometry in comparison to the S2 model. With the angle of incidence of earthquake varying from 0 to 180 in each model. Results shown here includes graphs for displacement under the influence of loads in X and Y axis as loads are defined in only these two directions.
Graph 05 – Model – S1: Storey Displacement under Minimum Time History Load Combination in X-axis
Maximum displacement was observed under the angle of incidence 180̊ on the Model-S1 building, and least displacement till was observed when the angle of incidence was 150̊ as shown in graph 5.
0 20 40 60 80 100 120 140 160
D
is
pl
ac
em
ent
(
m
m
)
Storey
0 30 45 60 90
120 135 150 180
0 50 100 150 200 250
D
is
pl
ac
em
en
t
(m
m
)
Storey
0 30 45 60 90
120 135 150 180
0.00 20.00 40.00 60.00 80.00 100.00 120.00 140.00 160.00
D
is
pl
ac
em
ent
(
m
m
)
Storey
0° 30° 45° 60° 90°
IJEDR1904059 International Journal of Engineering Development and Research (www.ijedr.org) 338 Graph 06 – Model – S1: Storey Displacement under Minimum Time History Load Combination in Y-axis
The graph above shows how changing the angle of incidence of an earthquake affects the displacement throughout the building storeys under the influence of minimum time history in Y-direction. Non – linearity can be easily seen between for the variation of displacement at different angle of incidences of an earthquake. Maximum displacement was observed under the angle of incidence 135̊ on the Model-S1 building, and least displacement was observed when the angle of incidence was 90̊.
(iii) Model – S2 Analysis Result - Model – S2 have the most irregular shape and geometry in comparison to the other two models. With the angle of incidence of earthquake varying from 0 to 180 in each model. Results shown here includes graphs for displacement and the influence of loads in X and Y axis as loads are defined in only these two directions.
Graph 07 – Model – S2: Storey Displacement under Minimum Time History Load Combination in X-axis
Graph 08 – Model – S2: Storey Displacement under Minimum Time History Load Combination in Y-axis
Maximum displacement was observed under the angle of incidence 150̊ on the Model-S2 building, and least displacement till 10th storey was observed when the angle of incidence was 60̊. For height storeys above 10th storey, displacement values were increasing for the angle of incidence of 135̊ as shown in graph 07.
Maximum displacement was observed under the angle of incidence 150̊ on the Model-S2 building, and least displacement was observed when the angle of incidence was 60̊. A similar increase in displacement with increase in storey height is observed. While the model building was considered as semi-rigid diaphragm as shown in graph 08.
(iv) Displacement Comparative Analysis of the test models - For model-R, the maximum displacement was seen at an angle of incidence 45̊. For Model-S1, the maximum displacement was seen at an angle of incidence 135̊. For Model-S2 the maximum
0.00 50.00 100.00 150.00 200.00 250.00 300.00
D
is
pl
ac
em
ent
(
m
m
)
Storey
0° 30° 45° 60° 90°
120° 135° 150° 180°
0.00 20.00 40.00 60.00 80.00 100.00 120.00 140.00 160.00
D
is
pl
ac
em
en
t
(m
m
)
Storey
0° 30° 45° 60° 90°
120° 135° 150° 180°
0.00 50.00 100.00 150.00 200.00 250.00 300.00
D
is
pl
ac
em
ent
(
m
m
)
Storey
0° 30° 45° 60° 90°
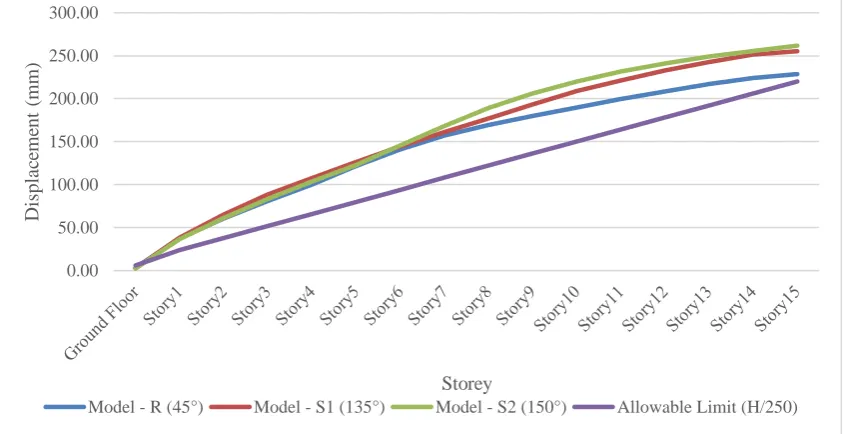
IJEDR1904059 International Journal of Engineering Development and Research (www.ijedr.org) 339 displacement was seen at an angle of incidence 150̊. The allowable limits of displacement of storeys as per IS 1893:2002 is H/250, Where H is the height of the particular storey from ground level.
Graph 09 – Comparison of Maximum Displacement between Three Test Models
All the test models have shown higher displacement under the influence of time history minimum load combination than the allowable limits as per the IS 1893:2002.[12]
Table 7 – Storey Displacement under Minimum Time History Load Combination in Y-direction for All Models Displacement in Y-Axis (in mm)
Time History Minimum
Storey Model - R (45°)
Model - S1 (135°)
Model - S2 (150°)
Allowable Limit (H/250)
Ground Floor 3.32 2.76 2.64 6.08
Storey1 38.07 38.82 36.98 24.08
Storey2 60.46 65.21 61.34 38.08
Storey3 80.85 88.49 83.60 52.08
Storey4 100.39 107.93 103.53 66.08
Storey5 121.47 126.14 122.65 80.08
Storey6 141.09 144.53 145.69 94.08
Storey7 157.21 161.14 168.20 108.08
Storey8 169.72 176.73 189.14 122.08
Storey9 180.05 193.37 205.84 136.08
Storey10 190.02 208.90 219.87 150.08
Storey11 199.87 221.49 231.52 164.08
Storey12 208.23 232.95 241.02 178.08
Storey13 217.20 242.99 249.27 192.08
Storey14 224.41 251.38 255.66 206.08
Storey15 228.70 255.31 261.77 220.08
IV. Conclusions - An in-depth detailed study, analysis of the three test models all together came to an end a conclusion can be made for the comparison and outcomes of the research study work. This study was performed on three test models (Model – R, Model – S1 and Model – S2) in ETABS under the influence of earthquake with angle of incidence 0º, 30º, 45º, 60º, 90º, 120º, 135º, 150º and 180º to understand the behavior of variation of storey displacement and storey drift throughout the building height.
Here measure conclusions have been made after in-depth comparative analysis of the three test models:
• For all the 3 Models maximum displacement was in Y-axis due to the low frequency of ground motion for 270º component of earthquake.
• For all the 3 Models maximum displacement was in Y-axis due to the orientation of columns.
• Depending upon the 3D modelling approach and angle of incidence, the variation in displacement and drift demand will occur due to the fundamental time period of building which thus depends on the geometry of the building. • The effect of variation of the angle of incidence in terms of displacement is more in the case of regular building as
compared to irregular building. But the maximum displacement was in irregular building Model –S2.
• Each and every model have shown different behavior and the main cause was the variation in the angle of incidence of earthquake.
0.00 50.00 100.00 150.00 200.00 250.00 300.00
D
is
pl
ac
em
ent
(
m
m
)
Storey
IJEDR1904059 International Journal of Engineering Development and Research (www.ijedr.org) 340 • Looking at all the results, maximum displacement was in Model – S2, due to the regular shape and geometry Model -
R was having the least displacement values. Severe values of displacement were found in all the angles of incidence except 0º, which is predominantly specified by the IS 1893:2002 for the analysis of structure.
V. Future Scope -
• Future work can be performed to find out the behavior of the structure with different shapes with influence of angle of incidence due to 2D or 3D component of earthquake.
• More detailed study can be done for finding the seismic behavior due to the seismic loading of various frequency. • Experimental analysis can be performed to make a relationship between analytical and experimental approach.
VI. References -
[1] Bureau of Indian Standards. Ductile Detailing of Reinforced Concrete Structures Subjected to Seismic Forces: Code of
Practice. IS-13920, 1993.
[2] C. Cantagallo, G. Camata, E. Spacone, “The Effect of the Earthquake Incidence Angle on Seismic Demand of Reinforced Concrete Structures”. 15 WCEE LISBOA 2012.
[3] C.J. Athanassiadou “Seismic Performance of R/C Plane Frames Irregular in Elevation”. Engineering Structures, 2008, 30:1250–1261.
[4] Carl F. Neusst, Bruce F. Maison, “Analysis for P-∆ Effects in Seismic Response of Buildings”. Computers & Structure 1984 Vol. 19, No. 3:369-380.
[5] Khoshnoudian, Faramarz, and Mehdi Poursha. "Responses of three dimensional buildings under bi-directional and uni-directional seismic excitations." In Proceedings of the 13th World Conference on Earthquake Engineering, pp. 1-6. 2004. [6] Pradip Sarkar, A. Meher Prasad, Devdas Menon, “Vertical Geometric Irregularity in Stepped Building Frames”.
Engineering Structures 2010, 32:2175-2182.
[7] Prajwal, T. P., Imtiaz A. Parvez, and Kiran Kamath. "Nonlinear Analysis of Irregular Buildings Considering the Direction of Seismic Waves." Materials Today: Proceedings 4, no. 9 (2017): 9828-9832.
[8] Sanyogita, Babita Saini, “Seismic Analysis of Vertical Irregularities in Buildings”. Springer Nature Switzerland AG 2019:537-546.
[9] Shaikh Abdul Aijaj Abdul Rahman, and Ansari Ubaidurrahman Salik. "Seismic Response OF Vertically Irregular RC Frame with Mass Irregularity." IJRSR (ISSN: 0976-3031) Volume 9 (2018):24317-24321.
[10]Standard, Indian. "Code of Practice for Design Loads (other than earthquake) for Buildings and Structures." Part II, Imposed
loads (second revision), IS-875-1987. Published by Bureau of Indian Standards, New Delhi-110002 (1987).
[11]Standard, Indian. "Code of Practice for Design Loads (other than earthquake) for Buildings and Structures." Part I, Dead
loads (second revision), IS-875-1987. Published by Bureau of Indian Standards, New Delhi-110002 (1987).
[12]Standard, Indian. "Criteria for Earthquake Resistant Design of Structures." Bureau of Indian Standards, Part 1 (1893).
![Figure 01 - Concept of Vertical Geometric Irregularity from IS 1893:2002[12]](https://thumb-us.123doks.com/thumbv2/123dok_us/8187344.1367353/1.595.187.387.514.601/figure-concept-vertical-geometric-irregularity.webp)