Available online at: www.ijcncs.org
E-ISSN 2308-9830 (Online) / ISSN 2410-0595 (Print)
Evaluation of BER and PAPR by using Different Modulation
Schemes in OFDM System
J.P. Panwar1 and Dr.Y.K.Jain2
1
Department of Technical Education, Haryana, India
2
Prof. Mewar University, Rajasthan
E-mail: [email protected], 2pykjain [email protected]
ABSTRACT
There are various issues related to OFDM such as dispersion (ICI), external interference (crosstalk) and nonlinearities (PAPR). OFDM suffers from a high Peak to Average Power Ratio (PAPR), caused by the addition of a large number of independently modulated sub-carriers in parallel at the transmitter. When subject to a non-linear power amplifier, these signals may undergo significant spectral distortion, leading to interference both in-band and out-of-band and an associated degradation in system performance. In this paper, the main focus is on the comparative performance evaluation of OFDM system in terms of PAPR and BER. Later in this paper, simulation result shows the PAPR and BER performance to observe the effect of IFFT size on PAPR without any reduction technique, with clipping technique and with companding technique for different modulation schemes such as BPSK, QPSK and 16PSK with 256 subcarriers.
Keywords:Orthogonal Frequency Division Multiplexing (OFDM), Inverse Fast Fourier Transform (IFFT), Signal-to-Noise Ratio (SNR), Bit Error Rate (BER).
1 INTRODUCTION
Mobile cellular communications has become the pervasive technology for the 21st century. With the advent of social media, mobile gaming as well as the prevalence of the mobile computing devices such as smart phones and tablets, consumers are increasingly demanding higher data speed and greater coverage area. Along with more spectrum allocations, the evolution of the air interface, which forms the backbone of mobile wireless communications, paramount to meet the growing demand [1].
Long Term Evolution represents a major advance in cellular technology. LTE constitutes the latest step towards the 4th generation (4G) of radio technologies designed to increase the capacity and speed of mobile communications. LTE [2] is con-siderably faster than exiting 3G networks like GSM, HSPA+, CDMA and WiMAX. The de-sign targets of LTE is to provide a peak data rate of at least 100 Mbps in the downlink and 50 Mbps in the uplink when operating in a bandwidth of 20 MHz.
The high data rates requirement of the LTE standard will be met through advanced modulation techniques such as Orthogonal FDM (OFDM), Single Carrier FDMA (SC-FDMA), Multi-carrier CDMA (MC-CDMA) etc. [3.
The transmit signals in an OFDM system can have high peak values in the time domain since many subcarrier components are added via an IFFT operation. Therefore, OFDM systems are known to have a high PAPR, compared with a Single-carrier system. The PAPR problem is more important in the uplink since the efficiency of power amplifier is critical due to the limited battery power in a mobile terminal [4]. In this paper we first explain mathematical model of OFDM System.
2 BASIC PRINCIPAL OF OFDM SYSTEM
OFDM systems are implemented using a combination of fast Fourier Transform (FFT) and Inverse Fast Fourier Transform (IFFT) blocks that are mathematically equivalent versions of the DFT and IDFT, respectively, but more efficient to implement. These mathematical operations are widely used for transforming data between the time-domain and frequency-domain [5]. These transforms are interesting from the OFDM perspective because they can be viewed as mapping data onto orthogonal subcarriers.
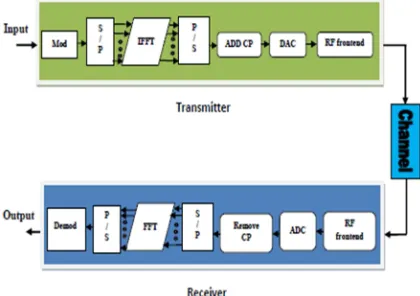
A basic OFDM system is described in Figure 1. Here an input data symbols are supplied into a channel encoder that data are mapped onto BPSK/QPSK/QAM constellation.
The data symbols are converted from serial to parallel and using Inverse Fast Fourier Transform (IFFT) to achieve the time domain OFDM symbols. Time domain symbols can be represented as:
= { } = ∑ 0 ≤ ≤ − 1
(1)
Where, is the transmitted symbol on the subcarriers and N is number of subcarriers.
Time domain signal is cyclically extended to prevent Inter Symbol Interference (ISI) from the former OFDM symbol using cyclic prefix (CP).
Fig. 1. A basic diagram of OFDM Transceiver
The Digital to Analog Converter (DAC) is used to convert the baseband digital signal into analog signal. Then, the analog signal is preceded to the Radio Frequency (RF) frontend. The RF frontend performs operations after receiving the analog signal. The signal is up converted to RF frequencies using mixer and amplified by using Power Amplifier (PAs) and then transmitted through
antennas. At the receiver side, the received signal is down converted to base band signal by RF frontend.
The analog signal is digitized and re-sampled by the Analog to Digital Converter (ADC). The ADC is used to digitize the analog signal and re-samples it. In the figure, frequency and time synchronization block are not shown because of simplicity. Cyclic prefix is removed from the signal in frequency domain. This step is done by the Fast Fourier Transform (FFT) block. The received symbols in the frequency domain can be represented as [5]:
( ) = ( ) ( ) + ( )(2)
where, Y (k) is the received symbol on the subcarrier, H (k) is the frequency response of the channel on the same subcarrier and W (k) is the additive noise added to subcarrier which is generally assumed to be Gaussian random variable with zero mean and variance of . Thus, simple one tap frequency domain equalizers can be employed to get transmitted symbols. After FFT signals are de-interleaved and decoded to recover the original signal.
Mathematical Description of OFDM Signal
OFDM consists of multiple carriers. Each carrier can be presented as a complex waveform like [5, 6]:
s (t) = A (t)e[ ∅ ] (3) where ( ) is amplitude of the signal ( ) and
∅ ( ) is phase of the signal ( ).
The complex signal can be described by
s (t) = ∑ A (t)e[ ∅ ] (4)
This is a continuous signal. Each component of the signal over one symbol period can take fixed values of the variables like:
∅ (t) ⇒ ∅ A (t) ⇒ A
where n is the number of OFDM block.
T is the time interval and the signal is sampled by
1⁄ then it can be represented by:
s (kT) = ∑ A e[( ∆ ) ∅ ](5)
Let = 0 then the signal becomes:
s (kT) = ∑ A e[( ∆ ) ∅ ]
(6)
The signal is compared with general Inverse Fourier Transform (IFT):
g(kT) = ∑ G e[ / ] (7)
Here, ( ) is time domain signal. Equation (1.6) and (1.7) are equivalent if
Here, is symbol duration period.
The OFDM signal can be defined by Fourier Transform. The use of Fast Fourier Transform (FFT) can obtain frequency domain OFDM symbols and Inverse Fast Fourier Transform (IFFT) can obtain time domain symbols. These can be written as:
Fast Fourier Transform
X(k) = ∑ x(n)e ( ⁄ ) (9) Inverse Fast Fourier Transform
X(n) = ∑ X(n)e( ⁄ ) (10) Where, 0 ≤ ≤ − 1
3 MODULATION SCHEMES
We used different modulation schemes such as QPSK, 32-QAM, 64-QAM and so on. After that pilots are inserted either to all subcarriers with a particular period or uniformly between the information data sequence. Thus, we get the data sequence of length M, where M is number of subcarriers [7]. Further, M-IFFT block is used to transform the data sequence of length M into time domain signal, where M represents the FFT size which must be equal to number of subcarriers. Following IFFT block, guard interval insertion technique with Cyclic Prefix (CP) is implement to avoid the inter block interference (IBI)[8]. The OFDM baseband signal then will pass through the Rayleigh fading channel. Constructive and destructive nature of multipath components in flat fading channels can be approximated by Rayleigh distribution if there is no line of sight which means there is no path between transmitter and receiver. The Rayleigh distribution [9] is basically the magnitude of the sum of two equal independent Orthogonal Gaussian random variables and the probability density function (PDF). At receiver, CP is removed first, and then sent to DFT block to convert the signals into frequency domain. Following FFT block, channel estimation is being implemented. In order for the receiver to obtain the original bits, it requires to take into account the unknown changes in the channel. Channel estimation block i.e. Minimum Mean Square Estimation (MMSE) block will estimate the unknown changes with the help of pilot symbols inserted before IFFT block. Pilot symbols are then
extracted and the estimated data is send to the signal de-mapper block where binary information data will be obtained back. During the process some of data bits are corrupted due to presence of unwanted noise in the channel, thus the error is obtained in the form of Bit Error Rate (BER)[10, 11, 12]. PAPR is also obtained by this simulation with the help of ComplementaryCumulative Distribution Function (CCDF)[13, 14, 15].
4 SIMULATION RESULT
4.1 4BER Performance of OFDM System
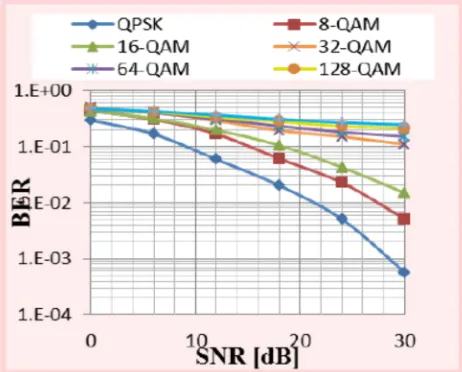
To obtain BER performance of the OFDM system, the data is generated randomly and then modulated by different modulation schemes such as QPSK, 8-QAM, 16-QAM, 32-QAM, 64-QAM, 128-QAM, and 256-QAM. We calculated the BER with respect to different SNR for OFDM system. In all the figures 2 to 5 presenting BER performance, horizontal axes indicate the Signal-to-Noise Ratio (SNR) in dB and vertical axes is the BER over 1000 iteration.
Fig. 2. BER Performance of OFDM system using
different Modulation schemes for M= 32
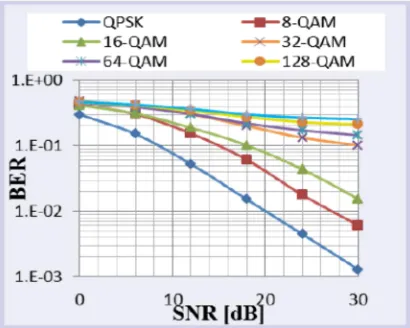
Fig. 3. BER Performance of OFDM system using different Modulation schemes for M= 64
These results shown above are for M = 32, where M = number of subcarriers. Similarly, BER performance for M = 64 and 128 are shown in the figures 4 and 5 respectively. In both figures, it is observed that as we increases the SNR, BER decreases for each modulation techniques. Among all modulation techniques, we again find out that OFDM provides best BER results for QPSK modulation, followed by 8-QAM and 16-QAM and average BER performance is obtained for rest of the modulation techniques.
Fig. 4. BER Performance of OFDM system using different Modulation schemes for M= 128
Fig. 5. BER Performance of OFDM system using QPSK for M= 32, 64,128
Since results obtained from figure 2, 3 and 4 shows QPSK is the best modulation technique among all these modulation techniques, therefore, we performed a BER performance comparison for OFDM system for 32, 64, and 128 subcarriers using QPSK as only shown in figure 5. It is clear from the figure 5 that BER results for M = 32, 64, 128 are quite similar. At the end of the section, it can be concluded that when the constellation size increases the BER also increases and further, the BER performance is almost independent of the number of subcarriers except at very high SNR.
4.2 PAPR Evaluation for BPSK, QPSK and
16PSK modulation scheme
Fig. 6. Plot of PAPR Vs IFFT size for BPSK modulation scheme
OFDM symbols were transmitted for both type of channels (multipath and AWGN). Now different values of PAPR are observed by changing the IFFT size.
It is observed in the figure6, the maximum value of PAPR is 20.2 dB when IFFT size is 64 for BPSK modulation scheme, without any reduction technique. In clipping technique, with the increase in value of IFFT size, PAPR also increases and the range of PAPR size is 4.43 dB to 15.2 dB. On the other hand, in companding technique, with the increase in IFFT size, PAPR decreases and the range of PAPR is 8.4 dB to 9.2 dB. Therefore, it is concluded that for BPSK modulation when the IFFT size ( up to 512) is small then the clipping technique is best and for large IFFT size companding technique is best.
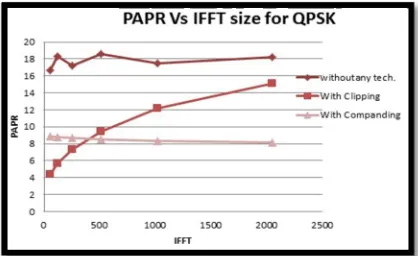
Fig. 7. Plot of PAPR Vs IFFT size for QPSK modulation scheme
It is observed in the figure 7, the maximum value of PAPR is 16.7 dB when IFFT size is 64 for QPSK modulation scheme, without any reduction technique. In clipping technique, with the increase in value of IFFT size, PAPR also increases and the range of PAPR size is 4.38 dB to 15.15 dB. On the
other hand, in companding technique, with the increase in IFFT size, PAPR decreases and the range of PAPR is 8.1 dB to 8.9 dB.
Fig. 8. Plot of PAPR Vs IFFT size for 16PSK modulation scheme
It is observed in the figure 8, the maximum value of PAPR is 16.9 dB when IFFT size is 64 for 16PSK modulation scheme, without any reduction technique. In clipping technique, with the increase in value of IFFT size, PAPR also increases and the range of PAPR size is 4.3 dB to 15.1 dB. On the other hand, in companding technique, with the increase in IFFT size, PAPR decreases and the range of PAPR is 8.3 dB to 7.1 dB. In clipping technique, when IFFT size is 64, then the PAPR value is reduced to 4.3 dB. In companding technique, When IFFT size is 2048, then the PAPR value is reduced to 7.1 dB.
Therefore, By comparing all three graphs of different PAPR reduction techniques, for different modulation schemes, it is concluded that for small IFFT size (up to 512) is small then the clipping technique is best and for large IFFT size companding technique is best.
5 CONCLUSION
In order to analyse the effect of different modulation schemes also on PAPR values, simulation was carried out. It was observed that QPSK and 16PSK modulation schemes are better than the BPSK. The value of PAPR without any reduction technique is 16.8 dB for QPSK and 16.9 dB respectively and 20.2 dB for BPSK. Also clipping technique gives better results as compared to companding technique by 5.1 dB in terms of PAPR. However, companding technique gives better results as compared to clipping technique in terms of BER.
6 REFERENCES
[1] A. Ghosh, R. Ratasuk and TIM,
“LTE-Advanced: Next-Generation Wireless
Broadband Technology,” IEEE Wireless Communication, vol. 17, no. 3, pp. 10–22, Jun. 2010.
[2] S. Jimaa, Y. Chen, “LTE- A an overview and future Research Areas, ” IEEE 7th international conference on Wireless and
Mobile Computing, Networking and
Communications (WiMob ), Wuhan, ISSN: 2160-4886, pp: 395-399, Oct. 2011.
[3] H. Rohling, T. May, K. Bruninghaus and R.
Grunheid, “Broad-Band OFDM Radio
Transmission for Multimedia applications”, Proceeding IEEE, vol. 87 no. 10, pp. 1778-1789, Oct. 1999.
[4] T. Hwang and C. Yang, “OFDM and Its Wireless Applications: A Survey,” IEEE Transactions on Vehicular Technology, vol.58, no.4, pp: 1663-1694, May 2009.
[5] Y. S. Cho, J. Kim, W. Y. Yang and Chug- Gu
Kang, “MIMO – OFDM Wireless
Communication,” John Wiley & Sons (Asia) Pvt. Ltd, Singapore, IEEE 2010.
[6] H. Sari, G. Karam and I. Jeanclaude, “An Analysis of Orthogonal Frequency Division Multiplexing For Mobile Radio Applications,” IEEE Conference on Vehicular Technology, vol. 3, pp. 1635 – 1639, Stockholm, Jun.1994. [7] T. Jiang and Y. Wu, “An Overview: Peak-to-Average Power Ratio Reduction Techniques for OFDM Signals,” IEEE Transactions on Broadcasting, vol.54, no.2, pp.257-268, Jun. 2008.
[8] S. Coleri, Mustafa Ergen et al. “Channel Estimation Techniques Based on Pilot Arrangement in OFDM Systems,” IEEE Transaction on Broadcasting, vol. 48, no. 3, pp. 223-229, Sept. 2002.
[9] M.X. Chang and Y.T. Su, “Performance Analysis of Equalized OFDM Systems in Rayleigh Fading,” IEEE Transactions Wireless Communication, vol. 1, no. 4, pp. 721–732, Oct. 2002.
[10]G. L Ren, H. Zhang and Y. L. Chang, “ A complementary clipping transform technique for the reduction of peak-to-average power ratio of OFDM system,” IEEE Transaction Consumer Electronics, vol. 49, no. 4, pp. 922– 926, Nov. 2003.
[11]T. G. Pratt, N. Jones, L. Smee and M. Torrey, “OFDM link performance with companding for PAPR reduction in the presence of nonlinear
amplification,” IEEE Transaction
Broadcasting, vol.52, no. 2, pp. 261-267, Jun. 2006.
[12]T. Jiang and G. X. Zhu, “Nonlinear companding transform for reducing peak-to-average power ratio of OFDM system,” IEEE Transaction Broadcasting, vol. 50, no. 3, pp. 342–346, Sept. 2004.
[13]J. Armstrong, “Peak-to-average power reduction for OFDM by repeated clipping and frequency domain filtering,” Elect-ronics Letters, vol. 38, pp. 246-247, Feb. 2002 [14]L. Chen and H.U. Xuelong, “Research on Peak
to Average Power Ratio Reduction of an OFDM Signal,” IEEE International Conference of Neural Networks and Signal Processing, vol. 8, pp. 978-982,June 2008.