Image Fusion Using Double Density Discrete
Wavelet Transform
1
Jyoti Pujar 2 R R Itkarkar
1,2
Dept. of Electronics& Telecommunication Rajarshi Shahu College of Engineeing, Pune-33
Abstract - Image fusion is the process of combining two or more images of the same scene to form the fused image retaining important features from each image with extended information content. There are two approaches to image fusion, namely Spatial Fusion and Transform fusion. Transform fusion uses transform for representing the source image at multi scale. Due to the compactness, orthogonality and directional information, the Discrete Wavelet Transforms and its un-decimated version are used for image fusion. These transforms can be implemented using perfect reconstruction Finite Impulse Response filter banks which are either symmetric or orthogonal. To design filters to have both symmetric and orthogonal properties, the number of filters is increased to generate M-band transform. Double density Discrete Wavelet Transform is an example of M-band DWT and consists of one scaling and two wavelet filters. In this paper, an approach for DDWT based image fusion is designed using statistical property of wavelet filters in representing the sharpness and its performance is measured in terms of Root Mean Square Error, Peak to Signal Noise Ratio.
Keywords - Image Fusion, Discrete Wavelet Transform (DWT), Finite Impulse Response Filter, M-Band Transform
and Double Density Discrete Wavelet Transform (DDWT).
1. Introduction
Wavelet Transforms (WT) is a new development in the area of mathematics. WT allow time-frequency localization. The studies of WT have attracted many researchers from various fields to apply them for their applications. The design of WT has a vast development in the field of image fusion both in theory and practice. Image fusion is the process of combining two or more images of the same scene to form the fused image, retaining important feature from each image with extended information content. There are two approaches to image fusion based on the domain in which the fusion process is carried out. They are named as spatial fusion and multiscale transform fusion. In spatial fusion, the pixel values from the source images are directly manipulated to form the pixel of the fused image. It has been found that the spatial fusion methods perform well and at the same time they will reduce the contrast of features uniquely present in the source images.
Better results were obtained if fusion takes place at multiscale in the transform domain. In recent years, multiscale transform has been recognized as a very useful approach to analyze the information content of images for the purpose of image fusion. The pyramid transform was very useful to represent the source image in pyramids at multiscale. Pyramid transform based fusion methods construct the pyramid representation of the fused image from the pyramid representations of the source images. The fused image is then obtained by taking an inverse pyramid transform. Inclusion of blocking effects in the regions where the multi-sensor data are different and lack of flexibility are the main disadvantages of pyramid transform based techniques. Due to these disadvantages, approaches based on wavelet transform were introduced. Due to the compactness, orthogonality and directional information, the Discrete Wavelet Transforms (DWT) can effectively extract salient features at different levels of decomposition. They also minimize structural distortions.
DWT decomposes the signal into low frequency and high frequency channels (Sub bands) using one scaling filter and one wavelet filter. It is named as Two Band or Two Channel wavelet transform. DWT is a non redundant and compact representation of signal in transform domain. This compact representation is due to the down sampling process after filtering during analysis and up sampling process before filtering during synthesis. The down sampling and up sampling process causes shift variant in standard DWT. The Undecimated DWT (UDWT) addresses the issue of shift invariance. It becomes shift invariant by suppressing the down sampling process during analysis and up sampling process during synthesis. DWT and UDWT can be implemented using perfect reconstruction Finite Impulse Response filter banks. These filters can be either symmetric or orthogonal, but not both simultaneously .
M-band wavelet transforms are having more flexible tiling of the time frequency plane. They provide more detailed information of narrow band high frequency components in frequency responses. Double density Discrete Wavelet Transform (DDWT), being an example of M-band DWT, consists of one scaling and two wavelet filters to decompose the signals into one low frequency and two high frequency channels. In this paper, an approach for DDWT based image fusion is designed using statistical property of wavelet filters in representing the sharpness and its performance is measured in terms of Root Mean Square Error (RMSE), Peak to Signal Noise Ratio (PSNR).
2.
Double
Density
Discrete
Wavelet
Transform
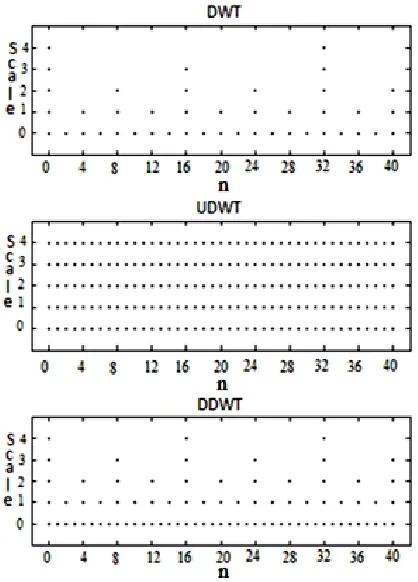
The sampling of the time and frequency plane provided by the critically sampled DWT, Undecimated DWT and DDWT is illustrated by the idealized diagram in the first, second and third panel of Fig.1 respectively. In the time and frequency plane of DWT, the distance between adjacent points increases by a factor of two when moving from one scale to the next coarser scale.
Figure 1:Time frequency plane of DWT,UDWT,DDWT
For the case of UDWT, the distance between points is constant regardless of scale. For DDWT, each scale is represented by twice as many points as in DWT. The number of points in the diagrams indicates the
redundancy incurred by each of the transforms. UDWT is the most redundant with a redundancy factor that depends on level of decomposition. This high redundancy makes UDWT as wavelet frame. Frames are shift invariant and provide more degrees of freedom for design. DDWT is redundant by a factor of two and has closer spacing between adjacent points. This makes it less shift sensitive than DWT. Selection of filter bank structure is the first step in the implementation of wavelet transform.
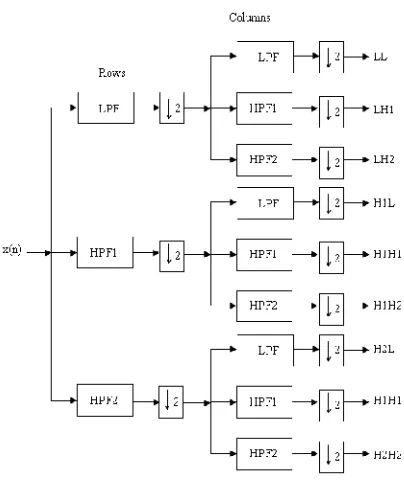
The two channel filter bank used in the implementation of DWT exactly matches the strategy for sampling the time and frequency plane illustrated in the third panel of Fig.1, if the down sampling and up sampling process in the high pass channel is removed. This filter bank is called over sampled filter bank because the total rate of the sub band signals exceeds the input rate by 3/2. DDWT is implemented by recursively applying this filter bank on the low pass sub band signal. But, there are no finite length HPF and LPF filters for perfect reconstruction for the above mentioned filter bank structure.
So, the over sampled filter bank shown in Fig.2 is used to construct DDWT with finite impulse response (FIR) filters. In this figure, the low pass scaling filter is denoted as h0(n) and high pass wavelet filters as h1(n) and h2(n).
Fig.2. Filter Bank structure of DDWT
Fig. 3 2D DDWT
3. Sharpness Representation of Wavelets
In this section, the sharpness of images in wavelet domain is studied by comparing the distributions of the wavelet coefficients of the sharper image and the blurred image respectively. For this study, the cameraman image available in MATLAB software package is taken as sharper image. This sharper image is convolved with 7 × 7 window averaging filter to generate blurred image. DDWT is applied to both the images and the histogram of their low frequency and high frequency sub bands are plotted. From the histograms, it is inferred that the distribution of low frequency sub bands are same whereas it is different for high frequency sub bands of sharper and blurred image. This difference motivates to use different fusion rules for low frequency and high frequency sub bands. Also, the distribution of high frequency wavelet coefficients of the blurred images is narrower than the distribution of sharper image. And blurred image have more wavelet coefficients nearer to zero and less wavelet coefficients with large magnitudes compared with sharper image. This motivates to use statistical model to evaluate the sharpness of the image using the distribution of wavelet coefficients.
4. DDWT Based Image Fusion
This section discusses DDWT based image fusion to form a clear image from two blurred images. The structure of proposed methodology is shown in Fig.5. In the first step, DDWT is applied to the source images. It decomposes images into low frequency and high frequency sub bands. In each sub band, every pixel is
compared using activity measure. The activity measure is based on the fusion rule. A fused wavelet coefficient map is then obtained by selecting the pixels from the source image that shows greater activity. The inverse wavelet transform is applied to obtain the fused image. Since, low and high frequency sub bands have different information, it is decided to use different fusion rules to fuse low and high frequency sub bands.
High frequency sub band consists of edge and directional information and the spreading of the wavelet coefficients distribution of the blurred image is narrower than that of a sharper image, the proposed approach selects information from the source image that gives wider spreading wavelet coefficients distribution. The low frequency sub bands contain the average image information. Larger absolute wavelet coefficients correspond to sharper brightness changes, the absolute maximum value is used as activity measure to fuse low frequency sub bands.
4.1 Image Fusing using DDWT
Figure 4: Block Diagram
wavelet transform is applied to obtain the fused image. Since, low and high frequency sub bands have different information, it is decided to use different fusion rules to fuse low and high frequency sub bands. High frequency sub band consists of edge and directional information and the spreading of the wavelet coefficients distribution of the blurred image is narrower than that of a sharper image, the proposed approach selects information from the source image that gives wider spreading wavelet coefficients distribution.
The low frequency sub bands contain the average image information. Larger absolute wavelet coefficients correspond to sharper brightness changes, the absolute maximum value is used as activity measure to fuse low frequency sub bands.
5. Fusion Scheme
For Lower subbands- Larger absolute wavelet coefficients correspond to sharper brightness changes, the absolute maximum value is used as activity measure to fuse low frequency sub bands
LSB=abs max(CL1(i,j), CL2(i,j))
For higher subbands-Simple Average Method: resultant fused HSB is obtained by taking the average intensity of corresponding pixels from both HSB of the input images.
HSB=(CH1(i,j), CH2(i,j))/2
where CL1(i,j), CL2(i,j) are lower subband coefficients of 1st image, and
CH1(i,j), CH2(i,j) are higher subband coefficients of 2nd image,
6. Evaluation Criteria
The evaluation measures are used follows,
1 The Root Mean Square Error (RMSE) is the difference the between reference image R and fused image F
2 The Peak Signal to Noise Ratio (PSNR) between the reference image R and fused image F is Ratio between the maximum possible power of a signal and the power of corrupting noise, expressed in dB.
7. Results
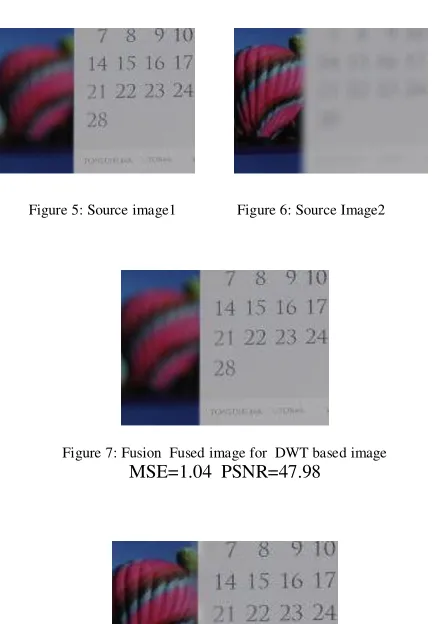
Figure 5: Source image1 Figure 6: Source Image2
Figure 7: Fusion Fused image for DWT based image
MSE=1.04 PSNR=47.98
Figure 8: Fused image for Proposed Methodology
MSE=0.0685 PSNR=64.55
8. Conclusion
This paper presents an efficient method of multi focus image fusion using DDWT. This method evaluates the sharpness measure in wavelet domain using distribution of the wavelet coefficients. A study is also carried out to find the optimum level of decomposition of DDWT for this statistic based fusion of multi focused images in terms of various performance measures. The results show that third or fourth level of decomposition of DDWT provides computationally efficient and better qualitative and quantitative results. Hence using this fusion method one can enhance the image with high geometric resolution.
References
[1] K.P. Soman and K.I. Ramachandran, “Insight into
Wavelets – From theory to Practice”, 2nd Edition,
[2] H. Li, B.S. Manjunath and S.K. Mitra, “Multi-Sensor Image Fusion Using The Wavelet Transform”,
Proceedings of the IEEE International Conference on
Graphical Models and Image processing, Vol. 57, No.
3, pp. 235–245, 1995.
[3] Zhou Wang and Alan C. Bovik, “A Universal Image Quality Index”, IEEE Signal Processing Letters, Vol. 9, No.3, pp. 81-84, 2002.
[4] I.W. Selesnick, “The Double-Density Dual-Tree DWT”, IEEE Transactions on Signal Processing, Vol. 52, No. 5, pp. 1304- 1314, 2004.
[5] Jing Tian and Li Chen, “Adaptive Multi Focus Image Fusion Using A Wavelet Based Statistical Sharpness Measure”, Signal Processing, Vol. 92, No. 9, pp. 2137– 2146, 2012.
[6] P.J. Burt and R.J. Kolczynski, “Enhanced Image Capture through Image Fusion”, Proceedings of the
Fourth International Conference on Computer Vision,
pp. 173-182, 1993.
[7] P.J. Burt and E. Adelson, “The Laplcian Pyramid as a Image Codec”, IEEE Transactions on
Communications, Vol. 31, No.4, pp. 532-540, 1983.
[8] S. Mallat, “Wavelet Tour of Signal Processing”, Academic Press, 1998.
[9] Rick S. Blum and Yang Jin zhong, “Image Fusion Methods and Apparatus”, US Patent, WO/2006/017233, 2006.
[10] Z. Zhang and R.S. Blum, “Region Based Image Fusion Scheme for Concealed Weapon Detection”,
Proceedings of the 31st Annual Conference on
Information Sciences and Systems, pp. 168-173, 1997.
[11] Marta Mrak, Sonja Grgic and Mislav Grgic, “Picture Quality Measures in Image Compression Systems”,
The IEEE Region 8th EUROCON 2003 Computer as a Tool, Vol. 1, pp 233-236, 2003.
[12] Jing Tian, Li Chen, Lihong Ma and Weiyu Yu, “Multifocus Image Fusion Using A Bilateral Gradient Based Sharpness Criterion”, Optics Communications, Vol. 284, No. 1, pp. 80-87, 2011
[13] Oliver Rockinger and Thomas Fechner, “Pixel-level image fusion: The case of Image sequences”,
Proceedings of SPIE, Vol. 3374, pp 378-388, 1998.
[14] N.G. Kingsbury and J.F.A. Magarey, “Wavelet Transforms in Image Processing”, Proceedings of First European Conference on Signal Analysis and