PLANT LEAF DISEASES DETECTION AND CLASSIFICATION
USING MACHINE LEARNING
Vijeta Shrivastava1, Pushpanjali2, Samreen Fatima3, Indrajit Das4
1.INTRODUCTION
Plant diseases have impacted society and its economy. Cultivating countries like India where around 60-70% of population relies upon agriculture sector. Plant diseases often cause serious loss of vegetables and crops. These plant diseases can also affect human health by the mean of secretion of toxic metabolites. Farmers require diverse knowledge for selecting suitable seeds and proper pesticides for plants. The study of plant disease involves observation of visual patterns on the plants. Detection of plant disease is an important part of cultivation as failure will affect quantity and quality of product and human health [1]. Plant diseases are of various types and caused by organisms like virus, bacteria and fungus but most plant diseases around 85% are caused by fungal or fungal-like organisms. In early days, experts were required for detection of plant diseases manually; manual detection is a tough job because it requires lots of experience, immense knowledge and excess amount of time. The disease detection technique using image processing with machine learning can be used instead of manual detection [2, 3, 4]. Image processing is a technique which analyses and manipulates digitized image in order to extract some required information. It is a kind of signal dispensation where we can take input as an image and output may be image or characteristics related with that image. Generally plant disease symptoms are seen on the stem, fruits and leaves. So, we considered using plant leaf for detection of disease symptoms. This plant disease detection technique has several steps involving image acquisition, image filtering, image segmentation, feature extraction and classification. This paper confers technique of recognition and detection of plant disease using image processing and machine learning.
The remaining sections of the paper are as follows. Section II, discusses about the review of some existing research work towards the detection of plant diseases and its classification. Section III, describes our own proposed method which is adopted. In section IV, the experimental results are discussed and shown using our output results. And last section describes the conclusion.
2.LITERATURESURVEY
Over the decades, different researchers have worked in the space of plant disease detection and they have used and formulated a stack count that surveys the implementation of their proposed methodologies and plans. In this section, we have propelled a few summaries of such existing studies and techniques.
Researchers Sanjay B. Dhaygude et al. [2] have proposed a detection algorithm to detect agriculture plant leaf disease. This algorithm is a vision based detection algorithm. The algorithm comprises of four steps that includes conversion of RGB (red, green, blue) image into HSV (Hue saturation value) color transformation structure as HSV is a good color descriptor then the green pixels are concealed and then removed using the threshold value. After that for texture analysis by color co-occurence
1 Department of Information Technology, Meghnad Saha Institute of Technology, Kolkata, India 2 Department of Information Technology, Meghnad Saha Institute of Technology, Kolkata, India 3 Department of Information Technology, Meghnad Saha Institute of Technology, Kolkata, India 4 Department of Information Technology, Meghnad Saha Institute of Technology, Kolkata, India
Abstract- Indian economy highly depends on agricultural productivity. Plant diseases detection has a major role in improving the production rate, as plant diseases causes serious effect on plant productivity and quality. Manually detection of infected plants requires immense knowledge about plant diseases, enormous time and huge amount of work. Hence, this can be done using image processing plant disease detection technique and machine learning. Generally plant disease symptoms are seen on the stem, fruits and leaves. So, we considered using plant leaf for detection of disease symptoms. This disease detection technique involves image acquisition, image filtering, segmentation, feature extraction and classification. This paper is focused towards the design of an optimal and more accurate way for the detection of plant diseases from leaf image and if it confirms the presence of disease then it is focused on evaluating its type among Alternaria Alternata, Anthracnose, Bacterial Blight and Cercospora Leaf Spot. We have experimentally performed this process and found that this process gives us almost accurate result as the minimum accuracy was 95.774 percent and maximum was 99.874 percent. It detects the disease by which plant is affected considering the affected region and disease is recognized precisely despite of having low affected region.
Keywords – Alternaria Alternata, Anthracnose, Bacterial Blight, Cercospora Leaf Spot, Anisotropic diffusion filter, K-means clustering, Support Vector Machine
Plant Leaf Diseases Detection And Classification Using Machine Learning 234
matrix, the picture is sectioned, and then extraction of the useful segments are done. After that by comparing the texture parameter with a texture parameter of a normal leaf, disease on the plant leaf is detected.
Researchers Arti N.Rathod et al. [5] have discussed method for disease detection using image processing and Neural network technique by converting RGB image to CIELAB model which is a device independent color model to classify color consistent with the human vision where L stands for brightness. After that segmentation of image is done using a technique called K- mean technique, then the green pixels are concealed and removed and the texture features statistics are calculated. After passing those features to neural network, the neural network improves the rate of recognition of the final classification process.
Researchers Niket Amoda et al. [6] have described the solution to detect diseased plant leaves by image processing technique. RGB captured image of leaves are changed to other shading or color model because of its range, then the changed pictures are sectioned and for portioning the input image, clustering techniques are used, then the features of leaves for the segmented objects that are infected are calculated and after that classification is done based on the result of feature extraction. Researchers Savita N. Ghaiwat et al. [7] have proposed a detailed study on the detection as well as classification of a diseased plant leaf. The paper provide an overview of different classification techniques used for identification of ailments or diseases in a plant leaf and finds the appropriate classification method for certain application as every classification methods have its own focal points and in addition drawbacks. Some of the procedures or techniques include K-Nearest neighbor, applied to classify similar and dissimilar data into more than one classes by recognizing the nearby neighbors, Fuzzy logic which is used to handle uncertainty, ambiguity and vagueness., Artificial neural network for recognizing leaf diseases, and SVM (support vector machine) to identify diseases even before specific symptoms visible .
Researchers Kiran R. Gavhale et al. [8] have proposed image processing technique for detecting diseases in leaves of the plants. Some of the techniques to detect the unhealthy or diseased plant leaves are Back propagation neural network (BPNN) by which user can identify the species of infected leaves and can acquire solutions for its control. Support vector machine (SVM) is used to identify diseases even before specific symptoms visible and K-nearest neighbor (KNN) in which classification is done by recognizing the nearby neighbors.
Researchers Daisy Shergill et al. [9] have defined a technique that can identify unhealthy or diseased leaves by capturing the image of a plant leaf and then extracting the features from the captured image. The captured image is converted to gray image because the range of RGB is 0 to 255 which is not possible to implement the applications and then the gray image is evolved and by applying various comparison techniques, it recognizes the presence of disease and the type of it.
Researchers S.Singla et al. [10] have described integrated traditional methods which include Back propagation neural network (BPNN). These traditional methods are although slow, but give accurate responses or results. This paper also include SVM (Support vector Machine) to identify diseases even before specific symptoms visible and particle swarm optimization (PSO) for the detection and classification of diseased or unhealthy plant leaf.
Researchers A.K Mishra et al. [11] have presented an image segmentation and classification technique based on a genetic algorithm for detecting the plant leaf diseases with very less computational efforts .Genetic algorithm gives a number of optimum solution so different image segmentation results can be obtained at the same time. Detection of diseases in plant leaves using some programmed method is beneficial as it diminishes an expansive or broad work of monitoring in big farms of crops or yields and it detects the symptoms of diseases at very early stage.
3.PROPOSEDMETHODOLOGY
Fig.1 Proposed Method
3.1 Plant Leaf Image Filtering
In the filtering of image, we subdue undesired distortion of original image and magnify some image features important for further processing. To expel the unwanted clamor in the captured image, here we use Anisotropic Diffusion Filtering method.
3.2 Anisotropic Diffusion Filtering [12]
Anisotropic diffusion filter, proposed by Persona and Malik [12], is a strategy for expelling noise from input pictures. This strategy is utilized for smoothing the picture by saving required edges and structures. The essential thought is simply to modify the smoothing level in a region based on the edge structure in the area. Homogenous portions are highly smoothed and solid edge areas are scarcely smoothed (to save the structure).
3.3 K-means clustering [13]
This clustering strategy is utilized to segment the leaf image into different clusters. In case if one cluster contains the excess illness for a situation then the leaf is contaminated by in excess of one disease. The segmenting of leaf image is finished by limiting the total values of the squares of the separation between the leaf image and corresponding cluster. The algorithm for K-means clustering:
1) Select the value of K. K means the number of cluster/groups i.e. the image is divided into K number of clusters. 2) Every pixel of image is allocated to the cluster with the goal that it diminish the separation between the pixel and the
center of the cluster.
3) By figuring normal of the considerable number of pixels in the cluster, again process the cluster centers. Repeat steps 2 and 3 until convergence is obtained.
3.4 Feature Extraction
Feature plays a very vital role in the region of image processing. Feature is a chunk of information which is applicative for solving the computational task. Feature extraction is a specific form of dimensionality reduction which is used in image processing for extracting features like color, texture, morphology, edges etc.
3.5 Gray Level Co-Occurrence Matrix Method
Feature extraction for unique feature of the image both color and texture are considered. The RGB model is not suited for representing colors in terms of human interpretation. So, it requires conversion of RGB image into HIS model as color objects in image can be easily described by its hue, saturation and intensity.
For extracting textural feature from image Gray Level Co-Occurrence Matrix (GLCM) is used. Contrast, energy, homogeneity, entropy and correlation are some of the GLCM texture features extracted from the segmented image. GLCM is a tabulation of how often different amalgamation of gray level co-occur in an image or image section.
3.6 Classification using Support Vector Machine
Plant Leaf Diseases Detection And Classification Using Machine Learning 236
has the sequent training set X = {xi, where i=1, 2, 3...ℓ} and ℓ N is the amount of discernment. Assume that training information is mapped into feature space F, i.e.
X F (1)
Training sample X (xi in F.
If there is a function which takes the amount for tumor and for non-tumor, after that in F, the data can be divided from the source with the maximal margin. So just the tumor information is deemed and the object function is detailed as:
0 , ) ( . . . , 1 2 1
min
, ,
i i i i i T R b R F W b x W t s b vl W W t (2)W = the typical vector of hyperplane which depict the decision limit. b= depicts the threshold of function.
і= the slack variable which is condemned in the target function.
= regularization term, a client characterized parameter which controls the trade off and demonstrates the fraction of samples that ought to be acknowledged by the depiction.
Appropriate W and b are to be found to limit (2). Here for every one of the disparity compels in eq. (2), the positive Lagrange coefficients, і and і (for i=1, 2, 3,..,.ℓ), was presented. This gives the accompanying Lagrange frame
) ) ( . ( 1 2 1 ) , , , , ( i i i i i i i i i T b x W b vl W W b W L
(3)where , and are one-column vectors displaying і, і and і, respectively. To minimize eq. (3), let its gradient, with respect to W, band і, individually, be equal to zero, that is
) ( 0 ) ( i i i i i i i x W x W
l
(4) 1 0
1
i i i i bl
(5) l l l l And i i i i i 1 1 0 1
(6)
Replacing (4)-(6) into (3), we get
) ( ). ( ) , ( 1 , 1 0 . . ) , ( 2 1 min , j i j i i i i j i j i j i x x x x k l t s x x k
(7)Equation (7) can be further written in a more compressed matrix form
) , ( 1 , 1 0 . . 2 1 min , , j i j i T i j i T x x k e l t s Q
(8)
ji j jk x x
b ( , ) (9)
Where xi = any one of the support vectors.
The tumor part can be classified, when the optimal values of the parameters are obtained, according to the following decision function
) ) , ( sgn(
)
(
i
i
ik x x b x
f
(10)The data comparing to x are resolved as tumor data applicants. If not, they are viewed as non-tumor zones. The learning capacity of one-class SVM exudes from the “kernel trick” [17]. This trick is performed by different choice of kx,y introduced in (7). Notice that in the definition of one-class SVM, the mapping is just relegated verifiably by part kx,y. An adequate bit ought to be depicted, i.e., an appropriate bit can delineate target information into a limited circularly formed territory in the element space and blueprint the items outside the information limit. With the "kernel trick", one-class SVM can manage nonlinear multimode data dispersion [17].
4.EXPERIMENTALRESULTS
The experiments were carried out on the platform of core i5 with 2 GHz processor and 8 GB RAM running under Windows 10 operating system. The algorithm is done by Matlab 2017b. We downloaded the open SVM toolbox and applied it to the leaf images classification. The programs can be run or tested on any computer platforms where Matlab is available.
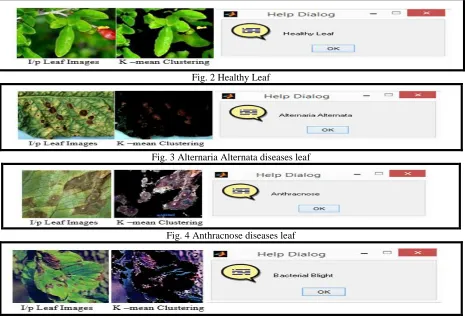
We have performed our methodology to test each and every possible case. Healthy and unhealthy both types of leaves were tested and recognized. Unhealthy leaves were further considered for determining the type of disease the plant is suffering from. The methodology first takes a picture as input then enhances it and then clustering is done, after performing all these processes its gives us the affected region and accuracy as our output with various types of feature parameter values.
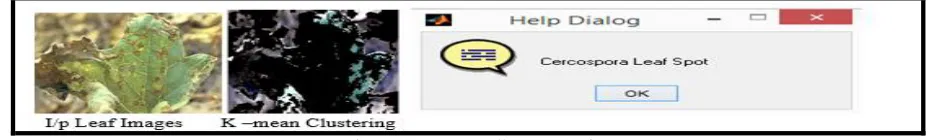
Fig. 2 shows the experimental result of a healthy leaf. When we give a picture of healthy leaf as an input it shows us a message that the leaf is healthy. Fig.3, fig.4, fig.5 and fig.6 shows us the different types of diseases determined by this methodology. Every time it takes an input and displays a message that the plant is affected by which disease. Each figure has three parts, first part is an input image, second part is a clustering image and third part is the message which pops on screen after classification is done and says which type of diseases it is.
Fig. 2 Healthy Leaf
Fig. 3 Alternaria Alternata diseases leaf
Fig. 4 Anthracnose diseases leaf
Plant Leaf Diseases Detection And Classification Using Machine Learning 238
Fig. 6 Cercospora diseases leaf
In Table I, the feature parameters like Entropy, RMS, Smoothness, Skewness, IDM, Correlation, Energy, Homogeneity, etc. that we have used to classify the plant leaf into healthy leaf and diseased leaf, and diseased leaf further into Alternaria Alternata, Anthracnose, Bacterial Blight and Cercospora Leaf Spot for 10 leaf images. Each type of image is examined for two times to see the accuracy of the method. Additionally the corresponding values for the factors have been noted for the result.
After that we have done an extensive performance analysis of our proposed algorithm. The fig.7 shows the variation of our outputs. First part, showing the varying percentage of the affected region of plant leaves. The region is varying from 0 for healthy leaf to 17.487 for unhealthy leaf. The detection is efficient as disease is detected accurately despite of having low affected region. Second part, showing the accuracy variation of the method. The accuracy was within the range of 95.77 to 99.87 which indicates the method is effective and useful.
Table I. List of Features for Detection of type of leaf diseases and healthy leaf
Leaf
Images Mean
Standard Deviatio n
Entropy RMS Variance Smoothne ss
Kurtos is
Skewne
ss IDM Contrast
Correlatio
n Energy
Homogenei
ty Leaf Type
Leaf Images 1
35.9274 64.0484 3.24063 8.3612
9 3443.43 1
3.7072
8 1.50846 255 0.757261 0.898844
0.4424
33 0.928486
Healthy Leaf
Leaf Images 2
51.2352 68.8943 4.43569 10.166
9 3725.79 1
2.5022 7
0.96975
8 255 1.01861 0.878348
0.2811
7 0.884952
Healthy leaf
Leaf Images 3
14.8439 47.8117 1.70988 5.5747
7 2150.7 1
15.597
8 3.63201 255 0.0788756 0.978321 0.7625
89 0.974878
Alternaria Alternata
Leaf Images 4
14.1802 48.1803 1.3683 4.3202
2 1635.76 1
15.724
8 3.66911 255 0.470481 0.864935
0.7962
3 0.959025
Alternaria Alternata
Leaf Images 5
30.5324 59.6242 3.06109 8.2271
1 3344.44 1 6.3781 2.0451 255 0.930867 0.832831
0.5074
07 0.888949
Anthracnos e
Leaf Images 6
40.9801 63.318 3.80912 9.3333
2 3320.66 1
4.2776
4 1.47828 255 0.98102 0.838466
0.3884
15 0.881297
Anthracnos e
Leaf Images 7
32.046 66.6028 2.29203 7.141 4217.12 1 5.1792
2 1.88061 255 1.48286 0.785504
0.5841
37 0.927109
Bacterial Blight
Leaf Images 8
41.5783 63.6384 4.0978 9.5171
5 3234.2 1
3.7795
7 1.39292 255 1.15299 0.773023
0.4089
97 0.893386
Bacterial Blight
Leaf Images 9
33.8015 62.1935 3.28929 8.3955
4 3440.22 1
5.0936
4 1.7953 255 1.20657 0.811376 0.4694 0.894594
Cercospora Leaf Spot
Leaf Images 10
28.757 52.4431 3.85904 9.2673
8 2442.26 1
8.7947
7 1.5653 255 0.498085 0.877636
0.4530
99 0.926901
Fig. 7 Graph representation of output
5.CONCLUSION
The detection of plant disease is important in agriculture sector to increase the cultivation yield and yield quality. This can be implemented using image processing technique and machine learning. In this paper we have performed leaf disease detection technique with the help of some feature extraction algorithm for extracting the features of the leaves and classification techniques using SVM to classify different diseases of the plants. This technique gives us the percentage of affected region, accuracy of classification and also calculates feature parameters. The performance of this methodology can be concluded as efficient because the accuracy was minimum 95.774 percent and maximum was 99.874 percent. The error rate of this technology can be ignored because its maximum value was 4.226%. It also detects disease from leaves even having small affected region. By using this method we can accurately identify the various plant diseases.
6.REFERENCES
[1]. S. B. Patil, and S. K. Bodhe, “Leaf disease severity measurement using image processing,” Int. J. Eng. Technol., vol. 3, pp. 297–301, Oct. 2011.
[2]. S.B.Dhaygude and N.P.Kumbhar, “Agricultural plant Leaf Disease Detection Using Image Processing”, International Journal of Advanced Research in
Electrical, Electronics and Instrumentation Engineering, Vol : 2, Issue : 1 January 2013.
[3]. S. Arivazhagan, R. Newlin Shebiah, S. Ananthi, S. V. Varthini “Detection of unhealthy region of plant leaves and classification of plant leaf diseases
using texture features” Agric Eng Int: CIGR Journal, 15(1): 211-217, 2013.
[4]. A.H.Kulkarni, A. Patil “Applying image processing technique to detect plant diseases”, International Journal of Modern Engineering Research, Vol.2,
Issue.5, Sep-Oct. 2012 pp-3661-3664
[5]. A.N.Rathod, B. Tanawal and V. Shah, “ Image Processing Techniques for Detection of Leaf Disease”, International Journal of Advanced Research in
Computer Science and Software Engineering, Vol: 3, Issue: 11, November 2013 .
[6]. N. Amoda and S. Naikwadi, “ advances in image processing for detection of plant diseases ” , International Journal of Application or Innovation in
Engineering & Management , Vol: 2, Issue : 11, November 2013.
[7]. S. N. Ghaiwat and P. Arora, “Detection and Classification of Plant Leaf Diseases Using Image processing Techniques: A Review”, International Journal of Recent Advances in Engineering & Technology, Vol : 2, Issue : 3, 2014, ISSN : 2347 – 2812.
[8]. K. R. Gavhale and U. Gawande, “An Overview of the Research on Plant Leaves Disease detection using Image Processing Techniques,” IOSR Journal
of Computer Engineering, vol : 16,Issue : 1, 2014.
[9]. D.Shergill, A.Rana, H.Singh, “Extraction of rice disease using image processing”, International journal of Engineering Sciences and Research
Technology.
[10].P. Kaur, and S. Singla, “A review on plant leaf disease detection techniques,” International Journal of Innovation in Engineering and Technology”, vol
: 7,Issue : 8,2016.
[11].V. Singh and A. K. Mishra, “Detection of plant leaf diseases using image segmentation and soft computing techniques,” Information Procedure in
Agriculture.
[12].P. Perona and J. Malik, “Scale-space and edge detection using anisotropic diffusion”, IEEE Transactions on Pattern Analysis and Machine Intelligence,
Volume: 12, Issue: 7, Jul 1990, pp. 629-639, ISSN: 0162-8828.
[13].S. Na, L. Xumin, G.Yong, “Research on K – means Clustering Algorithm: An improved K- means Clustering Algorithm”, 3rd International Symposium
on Intelligent Information Technology and Security Informatics, 2010.
[14].N Zhang, “Feature Selection based Segmentation of Multi-Source Images: Application to Brain Tumor Segmentation in Multi-Sequence MRI”, Ph.D.
Thesis, L’Institut National des Sciences Appliquées de Lyon 2011.
[15].Z.Q. Bian and X.G. Zhang. Pattern Recognition [M]. Beijing: Tsinghua University Press, 2000.
[16].B. Schölkopf and A. J. Smola, Learning with Kernels Support Vector Machines: Regularization, Optimization and Beyond. Cambridge, MA: MIT,
2002.
[17].J. Zhou1, K. L. Chan1, V. F. H. Chong, S. M. Krishnan , “Extraction of Brain Tumor from MR Images Using One-Class Support Vector Machine”,