Abstract—Local governments in Korea are facing increasing calls to predict climate change impacts and prepare corresponding adaptation countermeasures. However, efforts to analyze climate change impacts are mostly at the macroscopic level due to limited data acquisition and an inability to analyze the climate change phenomenon. This study developed a grid-unit climate change impact assessment model in consideration to urban infrastructure to enable more specific impact analyses to be conducted and for the establishment of response measures.
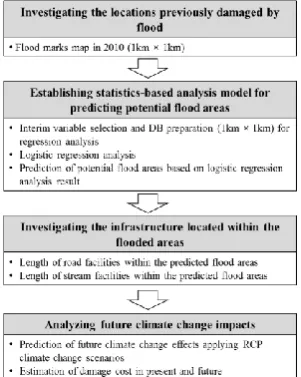
The assessment methods consist of four parts: 1) Investigating the locations previously damaged by floods; 2) establishing a statistics-based analysis model to predict potential flood areas, 3) investigating the presence of infrastructure located within a flooded area; and 4) analyzing future climate change impacts.
Through the developed assessment model, more concrete climate change impacts on an urban infrastructure was identified at the level of 1km× 1 km resolution. In addition, it was found that minimizing the surface flow by maintaining sewage pipe lines and expanding green infrastructures were effective.
Index Terms—Climate change effects, urban infrastructure, RCP climate change scenario, urban planning.
I. INTRODUCTION
Most urban areas in Korea are densely populated. Therefore, there are limited green spaces and the impermeability is extremely high, leading to high flood risks. Flood damage, which accounts for more than 90% of the damage caused by all natural disasters, occurs mostly in urban areas (National Emergency Management Agency, 2009). This in turn can be harmful to human life and health and greatly impair the economy while paralyzing urban systems. Moreover, the intensity and frequency of natural disasters are increasing due to climate change, while losses by disasters are also increasing. For the past 100 years (1911-2010), the average global temperature rose 0.75 °C, while the average temperature in Korea rose by 1.8 °C. This is believed to be responsible in part to extreme weather conditions, such as heat waves and torrential rainfalls, with increasing frequency and intensity.
According to the Korea Meteorological Administration
(KMA, 2011) scenario, the average temperature of the Korean Peninsula is expected to rise by 5.0 °C, and precipitation is expected to increase by 20.4% by the end of the 21st century, with corresponding damages also expected to increase.
For these reasons, cities urgently need to adapt themselves to climate changes. Each local government in Korea has established plans to predict climate change impacts and prepare corresponding adaptation countermeasures in their urban plans since 2011. However, most of the climate change impact assessments have data covering large areas due to limited data acquisition and therefore, more specific evaluations which consider spatial characteristics of local government are needed. In response, this study developed a grid-unit climate change impact assessment model to enable more specific impact analyses to be rendered and for the establishment of response measures on the local government level.
II. LITERATURE REVIEW
As climate change adaptation has become a major issue around the world, efforts to evaluate the impact of climate change have been attempted worldwide. In particular, since infrastructure, which is greatly influenced by climate change, is a core component in maintaining human life, it is considered to be important in many vulnerability evaluations.
Climate change impact evaluations on infrastructure have been conducted on water resources such as streams; transportation facilities including roads, railroads, harbors, and airports; and supply facilities, including water and sewage systems, and oil and gas pipelines [1], [2]. The disasters triggered by climate change include floods caused by rainfall (torrential and localized heavy rain), wind damage caused by gales and tropical cyclones, seawater flooding due to sea level rise, and earthquakes [1].
The Federal Emergency Management Agency (FEMA) of the United States established disaster management policies and institutions for reducing the damages caused by climate change. By establishing HAZUS-MH (Hazards United States Multi-Hazard), which is capable of predicting natural disasters such as floods and tropical cyclones, the damage caused by climate change is being constantly analyzed and monitored [3]. In addition, the United Kingdom developed the UK Climate Projection 2009 (UKCP09) scenario and is actively utilizing it to study climate change impacts of the central office groups and large cities [4].
The Victoria State Government in Australia [2] analyzed future climate change impacts for each type of infrastructure.
A Climate Change Impact Assessment of Urban
Infrastructure by a Grid-Based Flood Model Focusing on
Stream and Road Facilities
D. Lee, K. Oh, and B. Park
Manuscript received November 12, 2016; revised February 4, 2017. D. Lee is with the Research Institute of Spatial Planning and Policy, Hanyang University, Seoul, Korea (e-mail: [email protected]).
The suggested variables known to influence the infrastructure were solar radiation energy, heat waves, flood levels, storms, and the intensity of precipitation. The types of infrastructure being affected by these variables were classified into drainage systems, buildings, roads, power supply facilities, railroads, parks, etc. The developed impact evaluation model was applied to establish specific response measures, including the state government policies and management plans for infrastructure to reduce damage based on the analysis results.
Similarly, there have been numerous efforts around the world to assess climate change impacts on infrastructure but these efforts are mostly macroscopic in nature due to limited data acquisition and an inability to effectively analyze the data. Trials on a microscopic level to estimate climate change effect have been recently considered but the studies are still in their initial stages.
III. STUDY METHOD
To evaluate the influence of floods on infrastructure, the major causes and locations of flood damage should be identified in advance. The hydraulic-hydrological model, which is used in the field of hydraulic engineering, requires climate data based on time. While this study aims to predict climate impacts in the future, the climate change scenario provided by the national government is mostly on a daily basis. Therefore, the conversion of each variable into a time unit is hindering the process. In addition, since the acquired weather information are distributed unevenly across the entire area by a resolution of 1 km × 1 km in each time and zone, it can increase the uncertainty of the assessment because of the difficulty in determining the time and zone to be converted. Therefore, this study developed an impact evaluation model by applying a statistical method. The impact evaluation was conducted following the four steps in Fig. 1.
Fig. 1. Climate change impact assessment methods of urban infrastructure.
A. Investigating the Locations Previously Damaged by
Floods
The information that identifies the exact locations of both damaged roads and stream facilities in the past have yet to be
established. While the exact locations of the damaged road and stream facilities cannot be confirmed, the damaged infrastructure due to flooding can be indirectly confirmed by using the flooding mark, which identifies the locations that were once flooded. Considering such limitations, the flooding risk areas were predicted in advance, and the scale of the infrastructure included in the hazard area was analyzed to evaluate the impact. The flooding mark of the study area was used to distinguish the flooded area at the same resolution as a grid unit of the climate scenario (1 km×1 km).
Fig. 2. The study area of Seoul, Korea.
B. Establishing a Statistics-Based Analysis Model to
Predict Potential Flood Areas
This study derived the factors and influential relationships influencing flooding through a logistic regression analysis and analyzed the potential flood area by the developed regression model. The logistic regression analysis is a type of categorical data modelling approach comprised of both nominal scale and ordinal scale dependent variables and is used when the value of the dependent variable is a binominal coefficient, which is either 0 or 1. Therefore, in this study, the logistic regression analysis was applied to determine whether flooding occurs at each grid. The interim variables affecting flood occurrence were selected from literature reviews and were also prepared at a resolution of 1 km×1 km for the regression analysis (Table Ⅰ).
C. Investigating the Infrastructure Located within the
Flooded Areas
In this study, a climate change impact evaluation was conducted for both transportation facilities (road and railroad) and stream facilities (rivers and streams), for which damage by flooding was relatively large during the past 10 years. The length of stream and road facilities that were included within the grid of the potential flood area, as derived from the logistic regression model, were confirmed by a GIS (Geographic Information System) overlapping analysis.
D. Analyzing Future Climate Change Impacts
6.0 assumes that the GHG reduction policy will be applied insufficiently compared with RCP 4.5. Finally, RCP 8.5 assumes that the current GHG emission levels will be maintained, which is also known as the BAU (Business As Usual).
Meanwhile, since the physical and social changes in 2040 and 2090 of the study area are difficult to predict, it was assumed that the study areas maintain their current states. Only the predicted future climate for each RCP scenario was different for the analysis. In addition, based on the estimated damage in past disaster records, the damage scale for each time point was predicted by converting each damaged length into the damage cost.
IV. CASE STUDY
A. The Study Area
In this study, the assessment model was applied to the city of Seoul, where a disaster management plan is urgently required (Fig. 2). Seoul is the largest city in Korea with an area of 605 km2, and a population of about 10 million. Large-scale, localized torrential rainfalls in 2010 and 2011 caused an estimated damage of $2.2 million to the city infrastructure.
B. Statistics-Based Model for Analyzing Potential Flood
Damage Area
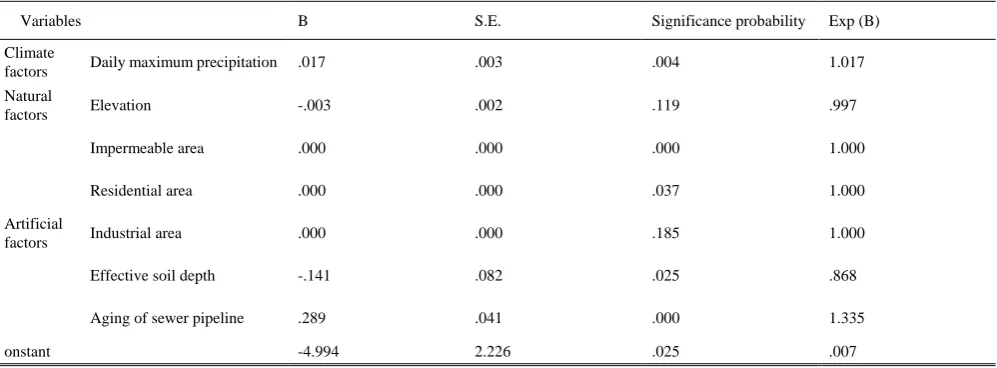
As a result of the logistic regression analysis, seven interim variables were found to influence the flooding. The age of the sewage pipelines was significant when predicting the flooded areas that occurred during June to September precipitation events, while the influences of impermeable area, green area, and river improvement rate were found to be less significant.
TABLEI:INTERIM VARIABLES FOR LOGISTIC REGRESSION ANALYSIS
Categories Variables Effects on Flood Reference
Climate Factors
Annual precipitation Risk of exposure to torrential rainfall increases as the annual precipitation increases
[1], [5]
Daily maximum precipitation Higher probability of damage due to the torrential localized rainfall
[5], [3]
3-day accumulated maximum precipitation Continuous localized rainfall increases runoff, and lead to heavy damage
[2], [6]
Precipitation between June and September Summer season shows much flood damages due to tropical cyclones, the rainy season, etc.
[5], [6]
Days with precipitations more than 100mm Days with more than (70mm/6h) precipitation can increase damage due to increased rainwater runoff
[1], [5]
3-day period precipitation of more than 150mm
Continuous localized rainfall increases runoff and leads to heavy damage
[1], [5]
Natural Factors
Slope High slope reduce the time for the water to reach the lowland [5], [3] Elevation Lowland receives more damage [5], [3] Stream area Risk of flooding increases as the area increases [5], [3] Effective soil depth Capability to hold water differs by the depth of soil,
Runoff decreases as the soil depth increases
[7], [8], [3]
CN (curve number) Used to calculate the runoff for each soil type, considering the hydrological conditions of the soil
[7], [8]
Artificial Factor
River improvement Ratio of areas where necessary repairs and maintenance are finished, river improvement prevent flood damages
[2]
Sewer capability Insufficient capacity increases the risk of flooding [2], [3], [4] Impermeable area More impermeable area increases the peak discharge, which
increases the flood damage
[9], [2], [3]
Land uses
(residential, commercial, industrial, green)
More residential, commercial, and industrial area increases the peak discharge
Green areas offset the above to reduce flood damage
[9], [2], [3]
Percentage of sewerage Risk of flooding increases as the distribution of sewers is reduced [2], [3], [4] Rainwater and detention area The water inside the area and the lowland runoff can be
temporarily stored before discharging into the stream
[2]. [3], [4]
While a negative relationship was revealed between the elevation, the rainwater, and detention pond area, their influences were not significant. Flooding occurred less frequently as the elevation increased and as the detention storage increased. However, their influences were found to be minor (Table Ⅱ).
Meanwhile, based on the flooding mark, the area with
and southwest were underestimated. This is because the precipitation from June to September, which triggered the floods, was relatively less than the precipitation in the other
areas. Moreover, during the data conversion, as the flooding mark was converted onto the 1 km×1 km grid unit, more areas were classified as areas that experienced flooding.
Fig. 3. Prediction results of the flood area.
Fig. 4. The impact assessment results on road and stream facilities (Left: Road, Right: Stream). TABLEⅡ:LOGISTIC REGRESSION ANALYSIS RESULT
Variables B S.E. Significance probability Exp (B) Climate
factors Daily maximum precipitation .017 .003 .004 1.017 Natural
factors Elevation -.003 .002 .119 .997
Artificial factors
Impermeable area .000 .000 .000 1.000 Residential area .000 .000 .037 1.000 Industrial area .000 .000 .185 1.000 Effective soil depth -.141 .082 .025 .868 Aging of sewer pipeline .289 .041 .000 1.335 onstant -4.994 2.226 .025 .007 Chi-square of model (degree of freedom), significance probability: 19.313(8), 0.000
Hosmer-Lemeshow chi-square of test point (degree of freedom), significance probability: 2.211 (4), 0.697 TABLEⅢ:PREDICTION OF THE FUTURE DAMAGE COST Scenario 2040 (USD1,000) 2090 (USD1,000)
Roads Streams Roads Streams RCP 2.6 135,843 13,315 246,745 22,000 RCP 4.5 497,512 45,859 357,535 34,558 RCP 6.0 135,965 13,315 447,265 37,491 RCP 8.5 181,306 14,250 202,091 19,202
C. Investigating Infrastructure within Flooded Areas
Fig. 4 shows the impact assessment results on road and stream facilities. As the area with over 65% probability of
located in an area that was expected to be flooded in the model.
D. Future Climate Change Impacts
The damage cost was calculated based on past records that contained damaged length information and damage cost
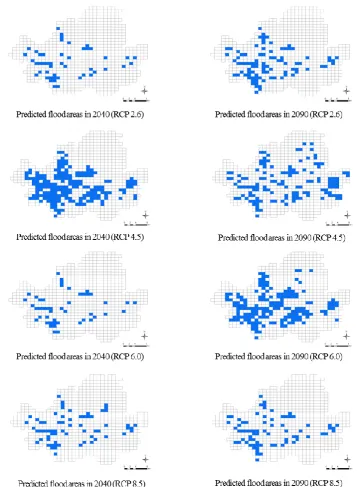
information. Except for the RCP 4.5, in all the scenarios, the damage did not increase much for 2040. However, the damage increased significantly in 2090. Among the four scenarios, RCP 6.0 was found to show the highest increase in damage (Fig. 5).
Fig. 5. Predicted flood areas (blue grids) as climate changes.
Results from RCP 8.5 were expected to predict the highest damage; however, since the future precipitation, derived from the RCP scenario did not increase significantly, it was not the highest (Table Ⅲ)
V. CONCLUSIONS
In this study, a grid-unit climate change impact evaluation model was developed to determine specific impacts and establish response measures at the level of a local government. Subsequently, the potential flooding area and
the damage of infrastructure due to flooding were confirmed. By applying RCP scenarios, the impact of future climate change was multilaterally analyzed. Meanwhile, through the regression model analyzed in this study, it was found that minimizing the surface flow by maintaining sewage pipe lines and expanding green infrastructures including urban parks, and green spaces can be effective. Such results can be used as primary information to establish climate change adaptation policies in local governments.
became high as the road or stream lengths were longer regardless of the flooded area within the grid, leading to partial overestimation. Secondly, although climate change impacts were assessed by applying multiple climate change scenarios, there is yet a level of uncertainty because the assessment applied a single model. Therefore, in the further studies, more specific climate change scenarios and the application of a multilateral model should be considered for mutual comparisons to reduce uncertainty.
ACKNOWLEDGMENTS
This work was supported by Development of Economic Assessment Technique for Climate Change Impact and Adaptation Considering Uncertainties (Korea Ministry of Environment, Project No. 2014001310010)
REFERENCES
[1] S. F. Balica, N. G. Wright, and F. van der Meulen, “A flood vulnerability index for coastal cities and its use in assessing climate change impacts,” Natural Hazards, vol. 64. pp. 73-105, 2012. [2] S. D. Brody “Identifying the impact of the built environment on flood
damages in Texas,” Disasters, vol. 32. pp. 1-18, 2007.
[3] B. Gersonius, R. Ashley, A. Pathirana, and C. Zevenbergen “Climate change uncertainty: Building flexibility into water and flood risk infrastructure,” Climate Change, vol. 116. pp. 411-423, 2013. [4] S. Pauleit and F. Duhme, “Assessing the environmental performance of
landcover types for urban planning,” Landscape and Urban Planning,
vol. 52. pp. 1-20, 2000.
[5] J. Tratalos, R. A. Fuller, P. H. Warren, R. G. Davies, and K. Gaston, “Urban form, biodiversity potential and ecosystem services,”
Landscape and Urban Planning, vol. 83,pp. 308-317, 2007.
[6] V. Whitford, A. R. Ennos, and J. F. Handley, “City form and natural process: Indicators for ecological performance of urban area and their application to Merseyside, UK,” Landscape and Urban Planning, vol. 57, pp. 91-103, 2002.
[7] Infrastructure and Climate Change Risk Assessment for Victoria,
CSIRO, Maunsell Australia Pty Ltd., 2007, pp. 1-77.
[8] Technical Manual of Multi-hazard Loss Estimation Methodology
Flood Model, Department of Homeland Security Federal Emergency
Management Agency.
[9] UK Climate Change Risk Assessment: Government Report, TSO,
Ireland, 2012, pp. 1-43
D. Lee a researcher at the Research Institute of Spatial Planning & Policy, Hanyang University, Seoul, Korea. He received his doctorate degree in Urban Planning at Hanyang University for his research, flood mitigation capability of urban green infrastructures. Since 2013, he has been working as a part-time instructor in the Department of Urban Planning and Engineering at Hanyang University.
His recent works involve developing a landscape ecological assessment system applying GIS analysis. Mr. Lee is currently researcher of a national R&D project, developing the urban thermal environmental planning and design system for adapting climate change. His research interests include urban environmental planning, landscape ecology, GIS and spatial analysis, and climate change adaptation.
K. Oh a professor in the Department of Urban Planning and Engineering at Hanyang University in Seoul, Korea, where he conducts courses on environmental planning, urban design, landscape analysis, GIS and urban spatial analysis, and climate change adaptation. He completed both his undergraduate and graduate work in landscape architecture at Seoul National University and Cornell University, respectively. He received his Ph.D. in environmental planning at the University of California, Berkeley. Professor Oh was a visiting professor for the Center for Advanced Spatial Analysis at the University College London, U.K.
His recent works involve investigating the carrying capacity of the urban environment and assessment systems. He is also developing planning approaches to ubiquitous and smart cities. Professor Oh is currently the principal investigator of a national R&D project, developing the urban thermal environmental planning and design system for adapting climate changes.
B. Park is a Ph. D. candidate in the Department of Urban Planning at Hanyang University in Seoul, Korea. He received his master’s degree in urban planning at Hanyang University for research on improving the land suitability assessment system II. He is currently a researcher of a national R&D project, developing the urban thermal environmental planning and design system for adapting climate change. His research interests include urban environmental planning, landscape ecology, GIS and spatial analysis, and climate change adaptation.