International Journal of Mechanical & Mechatronics Engineering IJMME-IJENS Vol:15 No:06 9
Abstract— The manufacturing process of drilling is considered the most efficient method for opening holes in a variety of materials. The present research aims to study the effects of the drilling parameters such as cutting speed, feed rate and tool diameter used on the prediction of the total thrust force and the thrust force due to the cutting action of the tool’s main cutting edges. The experiments were carried out by varying the drilling parameters and the output responses were mathematically modeled based on the response surface methodology. The analysis of variance was used to verify the adequacy of the mathematical models. The most significant input variables were recognized and the 3D response surfaces were plotted.
Index Term— Al7075, drilling, response surface methodology,
thrust force.
I. INTRODUCTION
DRILLING is the most commonly used machining operation in a variety of materials. The quality of the drilled holes is significantly affected by the developed thrust force.
A number of researchers have been applying the response surface methodology (RSM) to different manufacturing environments. RSM is a tool for determining the cause and effect relationship between responses and input variables [1]. The basic steps involved can be summarized as follows:
Designing of a set of experiments for adequate and reliable measurement of the response.
Determining the mathematical model with the best fitting.
Finding the optimum set of experimental factors that maximize/minimize the response.
Represent the effects of the variables on the response using 2D or 3D plots.
This research has been co-financed by the European Union (European Social Fund – ESF) and Greek national funds through the Operational Program "Education and Lifelong Learning" of the National Strategic Reference Framework (NSRF) - Research Funding Program: ARCHIMEDES III. Investing in knowledge society through the European Social Fund.
The paper was submitted in June 2015
P. Kyratsis is with the Technological Education Institute of Western Macedonia, Department of Mechanical Engineering and Industrial Design, Kila Kozani, GR50100, Greece (e-mail: [email protected]).
N. Taousanidis is with the Technological Education Institute of Western Macedonia, Department of Mechanical Engineering and Industrial Design, Kila Kozani, GR50100, Greece (e-mail: [email protected]).
A. Tsagaris is with the Technological Education Institute of Thessaloniki, Department of Automation Engineering, P.O. Box 141, GR57400, Thessaloniki, Greece (e-mail: [email protected])
K. Kakoulis is with the Technological Education Institute of Western Macedonia, Department of Mechanical Engineering and Industrial Design, Kila Kozani, GR50100, Greece (e-mail: [email protected]).
II. REVIEW OF LITERATURE
Onwubolu et al. presented a mathematical model for correlating the interactions of speed, feed rate and drill diameter on the axial force and torque, acting on the cutting tool during drilling. They implemented the response surface methodology with a three-level full factorial design. The results proved that the model can be used for optimization purposes in order to minimize both the axial force and torque [2].
Li et al. drilled a 15mm thick recombinant bamboo and considered the spindle speed, feed rate and diameter for the measurement of both the thrust force and torque. Mathematical models were developed resulting that the main influence on the thrust force came from the spindle speed and feed rate, while for the torque, the diameter of the tool and the spindle speed were the most significant parameters. High spindle speed with low feed rate minimized the thrust force [3].
Krishnaraj et al. investigated the thrust force and surface roughness of plain carbide drill with drill parameters (drill diameter, spindle speed and feed rate) in drilling carbon fibre reinforced plastic (CFRP) laminate/aluminum stack. Taguchi method and the L27 orthogonal array were used together with
the analysis for variance (ANOVA). Feed rate and diameter were the most significant drill parameters. In addition, when the feed increases the circularity increases as well [4].
Prakash and Planikumar studied the use of Taguchi and response surface methodology for predicting the surface roughness in drilling medium density fiberboard (MDF) material by physical vapor deposition TiN coated carbide step drill bits. The drilling parameters used were the spindle speed, feed rate and drill diameter. The effect of these parameters on the surface roughness was evaluated and discussed in details. A second order model was established for calculating the surface roughness from the cutting parameters. Validation experiments were performed in order to examine the accuracy of the proposed models [5, 6].
Sundeep et al. examined the drilling behavior of austenitic stainless steel (AISI316) and optimized the process parameters using L9 orthogonal array from the Taguchi methodology.
Spindle speed, feed rate and drill diameter were used as input parameters, while the lowest thrust force and highest metal
Drilling Mathematical Models Using the
Response Surface Methodology
Fig.1. Workload flow chart removal rate (MRR) of the drilling process were the targets to
be achieved. ANOVA was used and the analysis indicated that cutting speed dominates on surface roughness and metal removal rate [7].
Garg and Goyal considered the surface roughness optimization with cutting conditions (cutting speed, feed rate, wet and dry cutting, depth of hole) using face centered design. The experiments were conducted based on the design of experiments (DOE) and analyzed by the ANOVA in order to identify the minimum surface roughness [8].
Reddy at al. studied the effect of the mechanical properties of aluminum alloys, cutting speed, feed rate and the point angle on diametric error and the thrust force using the Taguchi method. Al6061, Al6351 and Al7075 were selected as the workpiece materials for the experiments. The ANOVA and the signal-to-noise ratio were employed in order to analyze the effect of the drilling parameters. The results indicated that feed rate and cutting speed minimize significantly both the diametric error and the thrust force [9].
The present paper aims in determining the effects of the cutting parameters on the total thrust force and the thrust force due to the tool’s main cutting edges, when drilling an Al7075 workpiece with HSS tools and to calculate reliable mathematical models using the response surface methodology. This results in separating the cutting action of the chisel edge with the cutting action of the main cutting edges. The ANOVA was used to verify the adequacy of the mathematical models. The most significant input variables were recognized; and finally, the 3D response surfaces were plotted.
III. EXPERIMENTAL WORK
A series of experiments were performed on a HAAS VF1 CNC machining center with continuous speed and feed control within their boundaries. The specimen used was an Al7075 plate. The plate was 150mmx150mmx10mm in size. A Kistler type 9123 four components dynamometer was used and the signal was processed by a type 5223 multichannel signal conditioner and type 5697 data acquisition unit (Fig. 1).
The drill tools used were made by Bosch and commercially available. They were HSS-R (DIN 338) twist drills with diameters of 6, 8, 10, 12 and 14 with 118deg. point angle. The feed rates of 0.20, 0.40 and 0.60mm/rev were used together with cutting speed values of 10, 40 and 70m/min.
In order to achieve the separation of the thrust force due to the main cutting edges from the total thrust force, two series of experiments were conducted. The first series involved the direct drilling of the workpiece and the acquisition of the total thrust force (sum of the forces due to the main edges and the chisel edge). In the second series, the workpiece was preshaped with an additional hole in the middle, with diameter equal to the chisel edge of the tool used. Following this strategy, when drilling was performed, the effect of only the tool’s main edges was measured.
International Journal of Mechanical & Mechatronics Engineering IJMME-IJENS Vol:15 No:06 11
TABLEI
PROCESS PARAMETERS AND THEIR LIMITS
Factor Notation Unit Levels
Tool diameter D mm 6-8-10-12-14
Feed rate f mm/rev 0.20-0.4-0.60
Cutting speed V m/min 10-40-70
IV. PROPOSED MATHEMATICAL MODELS
The response surface methodology is an extremely versatile tool when used for modeling problems in which output is influenced by several input variables. The aim is to find the correlation between the output and the input variables. The mathematical models use the least square fitting in order to finalize the model [10]. In the present study, a full factorial approach was followed and 90 experiments were conducted as described earlier. This provides a comparatively accurate prediction of both the total thrust force and thrust force due to the main cutting edges. A polynomial mathematical model was used in order the total thrust force and the thrust force due to the main cutting edges to be calculated. These models follow the form given in the equation below.
3 2 23 3 1 13 2 1 12 2 3 33 2 2 22 2 1 11 3 3 2 2 1 1 0 X X b X X b X X b X b X b X b X b X b X b b Y where:
Y is the response i.e. thrust force,
Xi stands for the coded values for i= D, V, f, and
b0,…,b34 represent the regression coefficients.
Using the data illustrated in Figs. 2, 3 and 4 as well as the aforementioned mathematical model, the following equations form the final mathematical models proposed for the calculation of the total thrust forces (in N) and the thrust force due to the main cutting edges (in N) respectively:
Vf Df DV f V D f V D
FZ Total
51 . 2 306 456 . 0 196 0166 . 0 28 . 6 686 96 . 4 6 . 32 134 2 2 2 _ and Vf Df DV f V D f V D
FZ main
77 . 5 56 223 . 0 455 0229 . 0 17 . 3 172 38 . 4 3 . 42 341 2 2 2 _ where:
D is the tool diameter in mm,
f is the feed rate in mm/rev,
V is the cutting speed used in m/min and
the tool/workpiece materials are HSS/Al7075.
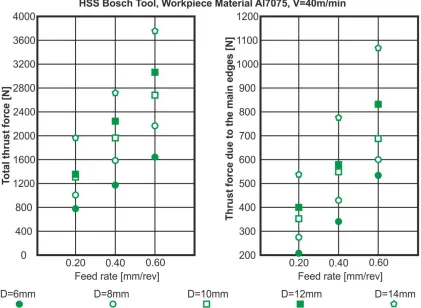
Fig. 3. Experimental results when drilling Al7075 with HSS tool (V=40m/min)
International Journal of Mechanical & Mechatronics Engineering IJMME-IJENS Vol:15 No:06 13
The adequacy of the models is provided at a 95% confidence level (level of significance of 5%). The analysis of variance has been performed to justify the validity of the models developed. The ANOVA table consists of a sum of squares (SS) and degrees of freedom (DF). The sum of squares is usually contributed from the regression model and residual error, in other words, it is decomposed into the sum of squared deviations due to each factor and the sum of squares due to error. Mean square (MS) is the ratio of sum square to the degree of freedom and the F-ratio is the ratio of mean square of regression model to the mean square of residual error.
According to the methodology, the calculated values of the F-ratio of the developed models (Tables II and III), are significantly increased compared to the tabulated value of the F-table for 95% confidence level (443.82 for the total thrust force and 250.04 for the thrust force due to the main cutting edges). The P-values are 0.000, which proves the highest correlation, hence both the mathematical models are adequate at a 95% confidence level.
The validity of the fit of the models can also be proved, by the adjusted correlation coefficient (R-sq (adj)), which provides a measure of variability in observed output and can be explained by the factors along with the two factor interactions. This coefficient is 98.9% and 98.1% for the total thrust force and the thrust force due to the main cutting edges respectively. As a result the models appear to have adequate predictive ability.
In addition, the significant terms of the models, when a level of significance of 5% is used, are those with a P-value less than 0.05. In the case of the total thrust force, these factors are: D2 (P=0.002), D*V (P=0.019) and D*f (P=0.000), while for the thrust force due to the main cutting edges, the significant terms are: D (P=0.009), V (P=0.001), D2 (P=0.000), D*V (P=0.003), D*f (P=0.000), V*f (P=0.000).
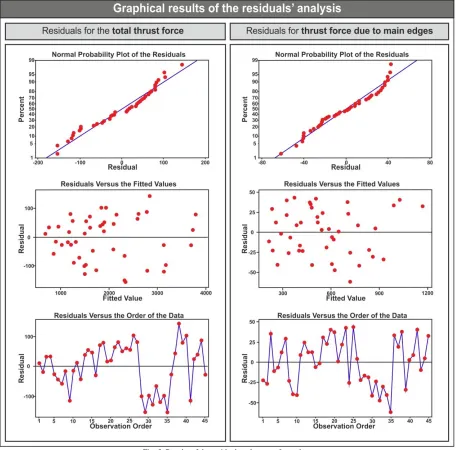
The accuracy of the models has been checked by the residual analysis, and it is essential that the residuals are normally distributed in order for the regression analysis to be valid. The normal probability plots of the residuals for both the total thrust force and the thrust force due to the main cutting edges calculated are depicted in Fig. 5. The graphs show that:
The residuals closely follow straight lines (approximately linear patterns), denoting that the errors are normally distributed.
Both the scatter diagrams of the total thrust force and the thrust force due to the main cutting edges residuals versus the fitted values depict that the residuals are evenly distributed on both sides of the reference line
The residuals versus the order of the data depict that the residuals are evenly distributed on both sides of the reference line.
TABLEII
ANOVATABLE FOR THE TOTAL THRUST FORCE (FZ_TOTAL)
Source of variation for FZ_TOTAL
DF SS MS F P
Regression 9 29669345 3296594 443.82 0.000 Residual
error 35 259971 7428 Total 44 29929316
R-sq(adj) 98.9%
Predictor Coef. SE Coef. T P
Constant 133.90 254.00 0.53 0.602
D -32.56 40.90 -0.80 0.431
V 4.956 3.352 1.48 0.148
f 686.3 630.20 1.09 0.284
D2 6.280 1.919 3.27 0.002
V2 0.01663 0.03028 0.55 0.586
f2 -195.80 681.30 -0.29 0.775
D*V -0.4564 0.1854 -2.46 0.019
D*f 306.12 27.82 11.01 0.000 V*f -2.508 3.212 -0.78 0.440
TABLEIII
ANOVATABLE FOR THE THRUST FORCE OF THE MAIN EDGES (FZ_MAIN)
Source of variation for FZ_MAIN
DF SS MS F P
Regression 9 2348851 260983 250.04 0.000 Residual
error 35 36532 1044 Total 44 2385383
R-sq(adj) 98.1%
Predictor Coef. SE Coef. T P
Constant 340.87 95.23 3.58 0.001
D -42.31 15.33 -2.76 0.009
V -4.381 1.256 -3.49 0.001
f -171.70 236.2 -0.73 0.472
D2 3.1726 0.7195 4.41 0.000
V2 0.02289 0.01135 2.02 0.051
f2 455.00 255.4 1.78 0.084
D*V 0.22278 0.06951 3.20 0.003
D*f 56.00 10.43 5.37 0.000 V*f 5.767 1.204 4.79 0.000
The analyses proved that the prediction models sufficiently explain the relationship between the total thrust force and the thrust force due to the main cutting edges with the independent variables respectively. These mathematical models could be used with high level of confidence from researchers and industry engineers in order to predict the total thrust force and the thrust force due to the main cutting edges expected within the limitations presented in the current research.
Fig. 5. Results of the residual analyses performed
by substituting the values of the tool diameter, feed rate and cutting speed within the ranges selected in the experimental investigation. The response surface plots of FZ_Total and FZ_Main
are depicted in Fig. 6. They are analyzed through the RSM prediction models by generating 3D response surface plots and it is observed that:
At higher values of tool diameter both the thrust force and thrust force due to the action of the main cutting edges increase significantly.
At increased values of feed rate they similarly increase.
When the cutting speed increases, the total force has a limited amount of change. It is only when the feed rate is increased together with the cutting speed that the total force has a small but observable decrease.
When the cutting speed increases, the thrust force due to the main cutting edges increases significantly. The same becomes more obvious when both the feed rate and cutting speed increase.
V. CONCLUSIONS
International Journal of Mechanical & Mechatronics Engineering IJMME-IJENS Vol:15 No:06 15
Fig.6. Response surfaces for the total thrust force and the thrust force due to the main cutting edges
ACKNOWLEDGMENT
This research has been co-financed by the European Union (European Social Fund – ESF) and Greek national funds through the Operational Program "Education and Lifelong Learning" of the National Strategic Reference Framework (NSRF) - Research Funding Program: ARCHIMEDES III. Investing in knowledge society through the European Social Fund.
REFERENCES
[1] R.H. Myers, D.C. Montgomery, C.M. Anderson-Cook “Response Surface Methodology: Process and Product Optimization Using Designed Experiments”, 3rd Edition, Wiley, New York, 2009.
[2] G.C. Onwubolu, S. Kumar. (2006). Response surface methodology-based approach to CNC drilling operations. Journal of Materials Processing Technology. 171, pp. 41-47.
[3] R. Li, M. Ekevad, J. Wang, X. Guo, P. Cao. (2014). Testing and modeling of thrust force and torque in drilling recombinant bamboo. Bioresources. 9(4), pp. 7326-7335.
[4] V. Krishnaraj, R. Zitoune, F. Collombet. (2012). Study of multi-material (CFRP/Al) using Taguchi and statistical techniques. Usak University Journal of Material Sciences, 2, pp. 95-109.
[5] S. Prakash and K. Planikumar (2010). Modeling for prediction of surface roughness in drilling MDF panels using response surface methodology. Journal of Composite Materials, DOI: 10.1177/0021998310385026. [6] S. Prakash, J.L. Mercy, K. Goswami. (2014). A systemic approach for
evaluating surface roughness parameters during drilling of medium density fiberboard using Taguchi method. Indian Journal of Science and Technology. 7(11), pp. 1888-1894.
[7] M. Sundeep, M. Sudhahar, T.T.M. Kannan, P.V. Kumar, N. Parthipan. (2014). Optimisation of drilling parameters on austenitic stainless steel (AISI 316) using Taguchi’s Methodology. International Journal of Mechanical Engineering and Robotics Research. 3(4), pp. 388-394. [8] S. Garg, R.K. Goyal. (2015). A study of surface roughness in drilling of
AISI H11 die steel using face centered design. International Journal for Innovative Research in Science and Technology. 1(12), pp. 464-474. [9] A.S. Reddy, G.V. Kumar, C. Thirupathaiah. (2013). Influence of the
cutting parameters on the hole diameter accuracy and the thrust force in drilling of aluminum alloys. International Journal of innovative Research in Science, Engineering and Technology. 2(11), pp. 6442-6450. [10] D.C. Montgomery “Design and analysis of experiments”, John Wiley