Spectral Analysis of Misalignment in Machines
Using Sideband Components of Broken Rotor Bar,
Shorted Turns and Eccentricity
I. Ahmed*
1, M. Ahmed
2, K. Imran
1, M. Shuja. Khan**
1,T. Akram
1, M. Jawad
11 Department of Electrical Engineering, COMSATS Institute of Information Technology, Lahore, Pakistan
2 Department of Electrical Engineering, University of South Asia, Lahore, Pakistan
Email: *[email protected], **[email protected]
Abstract - This paper inspects the misaligned motors by using diagnostic medium such as current, flux and instantaneous power signal. Misalignments in machines can cause decrease in efficiency and in the long-run it may cause disastrous failure because of unnecessary vibration, stress on motor & bearings and short-circuiting in stator and rotor windings. The measurements have been performed at full-load to detect the misaligned motors and considered the fault frequencies characteristics of shorted turn, broken rotor bar (BRB) and eccentricity using current, flux and instantaneous power spectrums. Experimental study demonstrates that eccentricity fault frequency components (f1±fr) from the flux spectrum are
more helpful for the purpose of detecting misalignment in machines as compared to any other side band components of shorted turn and broken rotor bar fault frequencies of current, flux and instantaneous power signals.
Index Term
--
Misalignment, Shorted turn, broken rotor bar, Eccentricity, Spectrum1. INTRODUCTION
The basis of any condition monitoring depends on understanding the electric, magnetic and mechanical behavior of a machine in both the healthy and faulty state [1]. An induction machine is highly symmetrical and the presence of any kind of fault modifies its symmetry and produces changes in the measured sensor signals, or more precisely, in the magnitude of certain fault frequencies [2]. Misalignment phenomenon is one of main causes for economic losses in industry. That is due to the fact that it reduces the machine’s life and causes a decrease in motor arrangement efficiency, and misaligned machinery is more prone to failure due to increased load on bearing, seals and coupling.[3] [4]. In most of the cases, misalignment in motor exhibits the combination of both types of misalignment [5].
Offset Misalignment which is the amount by which the alignment of driver and driven shaft are out of parallel alignment and Angular Misalignment which is the amount by which the alignment of driver and driven shaft are
skewed as shown in Fig. 1.
Fig. 1. Types of Motor Misalignment [5].
“A proper shaft alignment is inevitable because it reduces excessive axial and radial forces on the most vulnerable parts of a machine system such as the bearings, seals, and couplings [6]”. Maintenance strategies are changing from periodic inspection strategies to condition-based predictive maintenance strategies due to changes in manufacturing world [7]. “Timely and accurate information about incipient faults in online machines will greatly enhance the development of optimal maintenance procedures. [8]” Some benefits of a functional predictive maintenance, include [9]
an increase in the availability and safety of the plant and workers
improvements in the quality of products and maintenance processes
an improvement in the quality of the available information about machine failures, maintenance activities, and support services in the design and improvement of future machines
a reduction in maintenance costs.
sidebands exist even in healthy motors, hence making it difficult to determine whether the measured sideband amplitude corresponds to a faulty motor or not. Moreover the amplitude of these sidebands varies significantly as a function of the load on the motor. Therefore, it is important to know what magnitude of the characteristics fault frequency components indicates the severity of different faults in motors.
Detection of eccentricity fault has been dealt with in [11]. The aim of this paper is to describe experimental results from healthy and faulty motors by examining broken rotor bar, shorted turn and eccentricity of different severities. Tests have been performed at different levels of loading and the current, flux and instantaneous power spectra have been analyzed individually.
2. EXPERIMENTAL SETUP
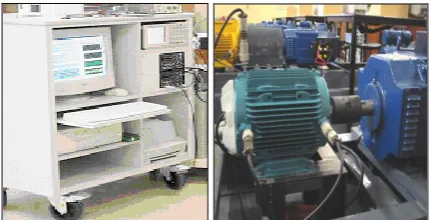
On-line condition monitoring has been used to assess the actual condition of a machine using measurements taken whilst the machine is operating. Some of the common techniques have been described in [12]. The characteristic fault frequencies of different faults are detected from the processed signals. In this study, a customized MATLAB program is developed to detect these fault frequencies efficiently. The fault frequency characteristics that relate to different fault conditions are analyzed in the different sensor signals, (voltage, current, flux, and instantaneous power). This helps to better understand the relationship between fault type and severity versus the amplitudes of the characteristic fault frequencies. The experimental work was conducted using the test rig and data acquisition system as shown in Fig. 2.
Fig. 2. Data-acquisition hardware (left) and motor/load test set-up (right).
Table I
Technical information for the induction motors used in the testing
Performance Data Value
Rated voltage (V) 415
Rated frequency (Hz) 50
Rated current (A) 4.8
Power (kW) 2.2
Number of Poles 4
Rated speed (rpm) 1415
Rated torque (Nm) 14.8
Number of rotor slots 32
Power factor at full-load 0.81
Table II
Technical information about the DC machine used in the testing
Performance Data Value
Rated shaft power (kW) 5.5
Rated speed (rpm) 1500
Rated armature voltage
(V) 220
Rated armature current
(A) 28
Rated field current (A) 0.65
The tests were conducted on a set of healthy and faulty three-phase induction motors (T-DF100LA, manufactured by Brook Crompton), which were loaded by a dynamometer consisting of a 5 kW separately excited DC machine, using a variable-resistance bank. The detailed technical specifications of the induction motors under test are shown in Table I. The induction motor under test was mechanically coupled to a separately excited DC machine, which was loaded using a variable-resistance bank. The wiring diagram of the AC and DC systems is shown in Fig. 4. The specifications of the DC machine used as a load in the testing are shown in Table II.
During the tests, the two current sensors for line currents, two voltage sensors for line voltages, one axial leakage flux sensor, two vibration sensors: drive-end horizontal (DEH) and drive-end vertical (DEV), and one speed sensor that is directly connected to the shaft of motor,
were used. The position of the sensors in the test
arrangement is shown in Fig. 3. The axial leakage flux measurement was taken with a circular search coil of comparable diameter to the motor, which is mounted concentrically with the shaft on the rear of motor.
For reliability and consistency of the flux
measurements, a fixed position for the flux coil is defined. The vibration sensors were screw-mounted to the motor housing to achieve the highest measurement bandwidth. Measurements of the input stator currents and voltages were taken using a custom-built measurement box that was located between the auto-transformer and the test motor.
VA VB VC
Induction Motor
5 kW DCgenerator
5kW DEV Vibration Sensor Axia l F lux S ens or L ow -pa ss fil ter Da ta a cquis it ion sys tem Speed Sensor M ains s upply S ignal pr oc es sing Current Sensor Se Sensor Voltage Sensor Se Sensor PC DEH Vibration Sensor
Fig. 3. The block diagram of the test set-up including the positions of the sensors.
The speed sensor was directly attached to the motor shaft to obtain the running speed of motor as shown in Fig. 2.
selectable cut-off frequencies of 100 Hz for the 400 Hz sampling frequency and 2 kHz for the 8 kHz sampling frequency. Table III illustrates the specifications of the sensors used for measurements in this study.
The data-acquisition software used for data collection was written using Lab VIEW. For this study, a custom written program developed in MATLAB has been used to identify the fault frequencies from the current, flux and instantaneous power spectra.
There are number of factors which can affect the accuracy of the measurements. Some of these factors are the rigidity of the foundation of the test motor and the accuracy of the shaft alignment. The motors must have a firm and rigid foundation to eliminate soft foot problems and to reduce vibration [4]. There are number of cost benefits of precision alignment. It can help to reduce operating cost by reducing energy costs.
Table III Sensor Specifications
Signal Device Band
width I/P Range
O/P Gain
Voltage Differential
Amplifier
30 Hz ±600V 100
V=1 V
Current Hall-effect
sensor
50 KHz
±10A 10A
=1V
Flux 100 turns
search coil 10 kHz
±1V -
Vibration Piezoelectric Acceleromet er
20 Khz
±2g 1g=
1V
Speed Tacho-meter - - -
Precision alignment also results in increased
maintenance savings through reduced parts consumption and reduced overtime. To eliminate alignment faults, the motors were installed on the test rig using a precision laser alignment tool and a torque wrench (Norbar set at the recommended value of 35 Nm for ideal mounting) as these two tools were used to ensure the accuracy and the repeatability of the mounting as well as to introduce the misalignment faults in machines.
During the measurements the sensors were sampled simultaneously and two different sampling rates used in this study are as follows:
Low-frequency measurement with a 400 Hz sampling
frequency that gives a Nyquist frequency of 200 Hz, and 100 second sampling time, which allow very high-resolution frequency analysis (40,000 data points, 0.01 Hz resolution).
High-frequency measurement at 8000 Hz sampling
frequency with a sampling time of 5 seconds (40,000 data points, 0.2 Hz resolution).
3. DETECTION OF MISALIGNMENT USING BROKEN
ROTOR BAR SIDEBAND AND COMPONENTS Non-invasive sensor quantities such as current, flux and instantaneous power spectrum have been analyzed to detect the misalignment of the motor by taking into consideration the characteristic fault frequencies of broken rotor bar (BRB).
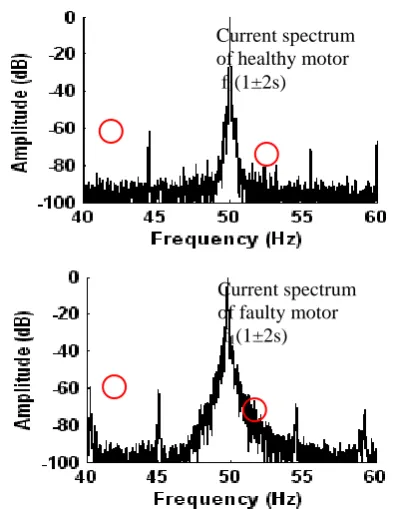
Fig. 4. Comparison of current spectra from a healthy machine with a misaligned machine at full-load.
Fig. 5. Comparison of flux spectra from a healthy machine with a misaligned machine at full-load.
I n d u c t i o n
m o t o r
Flux spectrum of healthy motor f1(1±2s)
Flux spectrum of faulty motor f1(1±2s)
Current spectrum of healthy motor f1(1±2s)
Fig. 6. Comparison of instantaneous power spectra from a healthy machine with a misaligned machine at full-load.
Comparison of the frequency spectrums of the stator current, axial flux and instantaneous power signals for a healthy motor to the misaligned motor are shown in the Fig. 4, 5 and 6. The circles in each diagram indicate the broken rotor bar sidebands at full-load. The noise levels are about 90 dB, -65 dB and –80 dB respectively.
It can be concluded from figures above that variation in the sideband components of broken rotor bar fault frequency due to misalignment are clearly visible in the frequency spectrum of healthy and misaligned motor in the current when compared to the sideband components in the flux and instantaneous power spectra. However, variations in the sideband amplitudes between the healthy and faulty motor were found to be less than 4 dB, which is not significant.
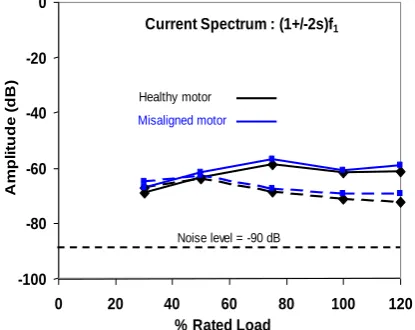
Due to misalignment fault, changes in the amplitudes of BRB fault frequencies from current signal at different level of load tests were found to be (< 3 dB) as shown in Fig. 7 below. This variation is small because the misalignment developed in the machines for the experiment is small.
The difference in the sideband amplitudes from the flux spectrum was found to be about 3 dB. This variation was not clearly visible due to inconsistent decrease/increase and some overlap in the amplitudes of sideband components between the healthy and misaligned motor under different load tests as shown in Fig. 8.
-100 -80 -60 -40 -20 0
0 20 40 60 80 100 120
% Rated Load
A
m
p
li
tu
d
e
(
d
B
)
Noise level = -90 dB
Current Spectrum : (1+/-2s)f1
Healthy motor
Misaligned motor
Fig. 7. Comparison of variation in sideband amplitudes verses % of rated load of a healthy motor with misaligned motor from current spectrum.
-100 -80 -60 -40 -20 0
0 20 40 60 80 100 120
% Rated Load
A
m
p
li
tu
d
e
(
d
B
)
Noise level = -65 dB
Flux Spectrum : (1+/-2s)f1
Healthy motor
Misaligned motor
Fig. 8. Comparison of variation in sideband amplitudes verses % of rated load of a healthy motor with misaligned motor from flux spectrum.
-100 -80 -60 -40 -20 0
0 20 40 60 80 100 120
% Rated Load
A
m
p
li
tu
d
e
(
d
B
)
Noise level = -80 dB
Instt. Power Spectrum : fp+/-4f2
Healthy motor
Misaligned motor
Fig. 9. Comparison of variation in sideband amplitudes verses % of rated load of a healthy motor with misaligned motor from instantaneous power
spectrum.
Fig. 9 shows the change in the amplitudes of BRB fault frequency components due to misalignment in machine were approximately more than 10 dB when compared to the healthy motor. Furthermore, they are clearly visible in the spectrum under different load tests. It has been observed from the above results that instantaneous power is more useful detecting the misalignment fault when compared with current and flux signals.
Instt. Power spectra of healthy motor (fp±4f2)
4. DETECTION OF MISALIGNMENT USING SHORTED-TURN SIDEBAND COMPONENTS
Fig. 10, 11, 12, 13, 14 and 15 compare the effects of the misaligned and healthy machines using the
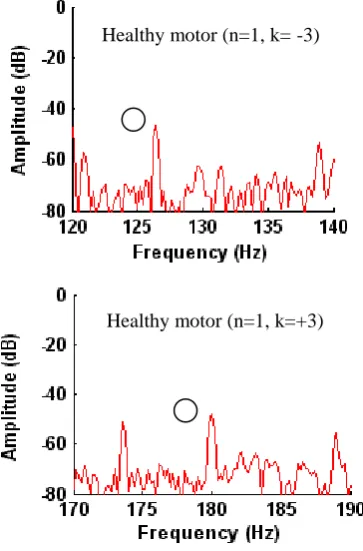
Fig. 10. Current spectrum from a healthy machine at full-load.
the shorted turn (ST) sideband components of the stator current, axial flux and instantaneous power signals at full-load for n=1 and k=±3.
The variations in the sideband amplitude between the healthy and misaligned motor were found to be less than 4 dB in current, flux and instantaneous power spectrum. Current spectrum shows more variations at k=±1 and 3. In contrast, there is hardly any variation in flux spectrum as indicated in Fig. 17.
Fig. 11. Current spectrum from a misaligned machine at full-load.
Fig. 12. Flux spectrum from a healthy machine at full-load.
Fig. 13. Flux spectrum from a misaligned machine at full-load. Healthy motor (n=1, k= -3)
Healthy motor (n=1, k=+3)
Faulty motor (n=1, k=-3)
Faulty motor (n=1, k=+3)
Healthy motor (n=1, k= -3)
Healthy motor (n=1, k=+3)
Faulty motor (n=1, k= -3)
Fig. 14. Instantaneous Power spectrum from a Healthy machine at full-load.
Similarly instantaneous power shows some variations at k=±1 (Fig. 18). Therefore, the variations in the sideband amplitude developed in current spectrum are useful for estimating the misaligned faults in machine. However, it is more reliable to detect the misalignment in machines using eccentricity fault frequency components because the effect of misalignment is more sensitive to the flux signal.
Fig. 15. Instantaneous Power spectrum from a misaligned machine at full-load.
-100 -80 -60 -40 -20 0
-3 -1 1 3
K
A
m
p
li
tu
d
e
(
d
B
)
healthy motor faulty motor
Current Spectrum : f1[(n/p)(1-s)+/-k)]
noise level = - 90 dB
Fig. 16. Comparison of variations in sideband amplitudes versus % of rated load of healthy motor with misaligned motor from current spectrum
-100 -80 -60 -40 -20 0
-3 -1 1 3
K
A
m
p
li
tu
d
e
(
d
B
)
healthy motor faulty motor
Flux Spectrum : f1[(n/p)(1-s)+/-k)]
noise level = - 65 dB
Fig. 17. Comparison of variations in sideband amplitudes versus % of rated load of healthy motor with misaligned motor from flux spectrum.
-100 -80 -60 -40 -20 0
-3 -1 1 3
K
A
m
p
li
tu
d
e
(
d
B
)
healthy motor
faulty motor
Instt. Power Spectrum : fp[(n/p)(1-s)+/-k)]
noise level = - 90 dB
Fig. 18. Comparison of variations in sideband amplitudes versus % of rated load of healthy motor with misaligned motor from instantaneous
power spectrum.
5. DETECTION OF MISALIGNMENT USING ECCENTRICITY
SIDEBAND COMPONENTS
Figures 19, 20, 21, 22, 23 and 24 compare the sideband amplitude of the misaligned machine with a healthy motor using eccentricity fault frequencies from current, flux and instantaneous power spectrum versus % of rated load of full- load. It can be concluded from Figures 19 & 20 that changes in the amplitudes of eccentricity sideband components in the current spectra between healthy and faulty motor are clearly visible. The noise level is 90 dB.
Healthy motor (n=1, k= -3)
Healthy motor (n=1, k=+3)
Faulty motor (n=1, k= -3)
Fig. 19. Current spectrum from a healthy machine at full-load.
Fig. 20. Current spectrum from a misaligned machine at full-load.
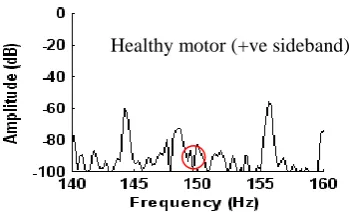
Fig. 21. Flux spectrum from a healthy machine at full-load.
Fig. 21 & 22 show that the amplitude of eccentricity fault frequencies from the flux spectrum for the healthy and faulty motor are high, when compared to the current spectrum. However, the affect of misalignment is small and hard to differentiate between the healthy and faulty motor. The noise level is 65 dB.
Fig. 22. Flux spectrum from a misaligned machine at full-load. Healthy motor (+ve sideband)
Healthy motor (-ve sideband)
Faulty motor (-ve sideband)
Faulty motor (+ve sideband)
Healthy motor (-ve sideband)
Healthy motor (+ve sideband)
Faulty motor (-ve sideband)
Faulty motor (+ve sideband)
Fig. 23. Instantaneous Power spectrum from a healthy machine at full-load.
Fig. 23 & 24 show that the amplitude of eccentricity fault frequencies from the instantaneous power spectrum between healthy and faulty motor are very small, when compared to the current and flux spectrums. The noise level is 90 dB.
It is concluded from misalignment eccentricity fault frequencies from Current, Flux and Instantaneous Power Spectrum that the maximum variations in the amplitude of
sideband components (f1±fr) between the healthy and
misaligned motor
Fig. 24. Instantaneous Power spectrum from a misaligned machine at full-load.
-100 -80 -60 -40 -20 0
0 20 40 60 80 100 120
% Rated Load
A
m
p
li
tu
d
e
(
d
B
)
Noise level = -90 dB
Current Spectrum : (f1+/-fr)
Healthy motor
Misaligned motor
Fig. 25. Comparison of variations in sideband amplitudes versus % of rated load of healthy motor with misaligned motor from current spectrum.
from the current spectrum were found to be less than 2 dB, which is small as shown in the Fig. 25.
Furthermore, the variation of the sideband amplitudes between healthy and misaligned motor at any load level are not consistent. Therefore, it is difficult for detecting the misalignment from current signal.
Fig. 26 demonstrates a measurable variation of less than 4 dB in the amplitude for the healthy and misaligned motor. It is concluded from Figure 14 that due to high amplitudes of fault frequency sideband components, it is preferable to use flux signal instead of stator current. The noise level is about – 65 dB.
-100 -80 -60 -40 -20 0
0 20 40 60 80 100 120
% Rated Load
A
m
p
li
tu
d
e
(
d
B
)
Noise level = -65 dB
Flux Spectrum : (f1+/-fr)
Healthy motor
Misaligned motor
Fig. 26. Comparison of variation in sideband amplitudes versus % of related load of healthy motor with misaligned motor from flux spectrum.
-100 -80 -60 -40 -20 0
0 20 40 60 80 100 120
% Rated Load
A
m
p
li
tu
d
e
(
d
B
)
Noise level = -85 dB
Instt. Power Spectrum : (fp+/-2fr)
Healthy motor
Misaligned motor
Fig. 27. Comparison of variation in sideband amplitudes versus % of related load of healthy motor with misaligned motor from instantaneous
power spectrum.
The investigation of the instantaneous power to detect the misalignment fault in machines shows small variations of less than 3 dB in the amplitudes of characteristic fault frequencies at any level of loading. It is thus difficult to detect the misalignment fault using instantaneous power signal as shown in Figure 27. The noise level is about –85 dB.
6. CONCLUSION
The measurements were taken at full-load to detect the misaligned motors and considered the fault frequencies characteristics of shorted turn, broken rotor bar and eccentricity using current, flux and instantaneous power spectrums. The investigation of the results concluded that the side bands of healthy and misaligned motors are Healthy motor (+ve sideband)
different in amplitudes at different level of load especially in flux and instantaneous power spectra. The variations in the side bands are visible as compared to current spectrum, which are sufficient to detect the misalignment in a motor. Among series of experiments performed, the best way of misalignment detection in a machine is found to be the use
of eccentricity fault frequencies (f1 ± fr) from the flux
signal. Therefore, among different presented techniques, eccentricity fault frequencies using flux signal is a promising approach when it comes to detect the misalignment problem in a machine.
ACKNOWLEDGEMENT
The authors would like to acknowledge their respective universities for providing adequate resources and environment for research.
REFERENCES
[1] M. L. Sin, W. L. Soong and N. Ertugrul, “On – Line Condition Monitoring and Fault Diagnosis – A Survey” Australian Universities Power Engineering Conference, New Zealand, 2003.
[2] W. T. Thomson and M. Fenger, “Current Signature Analysis to Detect Induction Motor Faults”, IEEE Industry Applications Magazine, pp. 26-34, July/August 2001.
[3] Manés F. Cabanas, Manuel G. Melero, Javier G. Aleixandre, J. Solares, “Shaft misalignment diagnosis of induction motors using current spectral analysis: a theoretical approach” International Conference on Electric Machines, ICEM 96, Vigo 10-12 September 1996.
[4] Hines, J. W., S. Jesse, J. Kuropatwinski, T. Carley, J. Kueck, D. Nower, and F. Hale, "Motor Shaft Alignment Versus Efficiency Analysis", P/PM Technology, October 1997, pp10-13.
[5] S. B. Chaudhury and S. Gupta, “Motor Misalignment Using Current Signature Analysis and Modified K-Mean Clustering Technique”, IEEE International Conference on Industrial Technology, 2006. (ICIT), pp 2331 – 2336
[6] V. Wowk, Machine Vibration: Alignment. New York: McGraw-Hill, 2000.
[7] P. N. Saavedra and D. E. Ramirez, “Vibration analysis of rotors for the identification of shaft misalignment. Part 1: Theoretical analysis,” in Proc. Inst.Mech. Eng. C—J. Mech. Eng. Sci., vol. 218, no. 9, pp. 971–985, 2004.
[8] Olufemi A. Omitaomu, Myong K. Jeong, Adedeji B. Badiru, and J. Wesley Hines” Online Support Vector Regression Approach for the Monitoring of Motor Shaft Misalignment and Feedwater Flow Rate”, IEEE Transactions on Systems, Man, and Cybernatics—Part C: Applications and Reviews, Vol. 37, No. 5, September 2007 [9] M. C. C. Moya, “The control of the setting up of a predictive
maintenance program using a system of indicators,” Int. J. Manag. Sci., Omega, vol. 32, pp. 57–75, 2004.
[10] Ahmed, I., Ertugrul, N., and Soong, W. L. "A Study on the Detection of Fault Frequencies for Condition Monitoring of Induction Machines." Australian Universities Power Engineering Conference, Tasmania, Australia, 26-29th September 2005.
[11] Intesar Ahmed, Manzar Ahmed, M. Shuja Khan, Kashif Imran, S. Junaid Akhtar, “Detection of Eccentricity Fault in Electrical Machines Using Current, Flux and Instantaneous Power Signals”, International Journal of Computer and Electrical Engineering IJCEE (Accepted for Publication in Vol.3; issue 1).
![Fig. 1. Types of Motor Misalignment [5].](https://thumb-us.123doks.com/thumbv2/123dok_us/1393681.1650827/1.595.319.538.225.441/fig-types-of-motor-misalignment.webp)