Payday Loan Pricing
Robert DeYoung and Ronnie J. Phillips
February 2009
Payday Loan Pricing
Robert DeYoung
University of Kansas
Visiting Scholar, Federal Reserve Bank of Kansas City
Ronnie J. Phillips
Colorado State University
February 2009
RWP 09-07
Abstract
We estimate the pricing determinants for 35,098 payday loans originated in Colorado
between 2000 and 2006, and generate a number of results with implications for public
policy. We find evidence consistent with classical price competition early in the
sample, but as time passed these competitive effects faded and the data become more
consistent with a variety of strategic pricing practices. On average, loan prices moved
upward toward the legislated price ceiling over time, consistent with implicit collusion
facilitated by price focal points. Large multi-store payday firms tended to charge higher
prices than independent single-store operators, but were less likely to exploit inelastic
demand near military bases and in largely minority neighborhoods. Of the three loan
pricing measures used in our analysis, the annual percentage interest rate (APR) favored
by regulators and analysts performed poorly.
Keywords: payday lending, price ceilings, strategic pricing
JEL Classification: G21, D14
The authors especially thank the Colorado Attorney General’s Office for access to their data. We also thank John Caskey, Emre Egungor, Mark Flannery, Jerry Hanweck, Don Morgan, Paul Pfenning, Katherine Samolyk, Victor Stango, Raymond Stroud, Jack Tatom, and seminar participants at the University of Kansas, the Federal Reserve Bank of Kansas City, and the Federal Reserve Bank of New York for their help and suggestions. The views expressed in this paper are those of the authors and do not necessarily reflect the views of the Federal Reserve Bank of Kansas City or the Federal Reserve System.
* DeYoung is the corresponding author: Department of Finance, University of Kansas, Summerfield Hall, 1300 Sunnyside Avenue, Lawrence, KS 66045, email: [email protected].
1. Introduction
Payday loans provide short-term liquidity for households with bank accounts and regular paychecks who have depleted, or choose not to tap, their other lines of credit. Payday lenders provide these households with immediate cash, charge no up-front fee, and in exchange receive collateral in the form of a post-dated personal check in the amount of the loan. After two weeks (or some similar period coinciding with their next pay date) borrowers can either repay the loan principal plus a finance charge or they can pay just the finance charge and refinance the principal with another payday loan. While payday loans are a very expensive form of credit—a typical $300 two-week loan might carry a $50 finance charge, which amounts to a 435% annual percentage rate (APR) of interest—they have become a popular alternative to other sources of small denomination personal credit such as checking account overdrafts or pawn loans.1 The U.S. payday loan industry has grown rapidly, from a few hundred payday loan “stores”
in the mid-1990s to well over 20,000 stores today (Snar 2002, Stegman 2007). Despite its growing market popularity, payday lending is barraged by third-party criticism. Consumer activist groups compare payday lending to loan sharking, and argue that serial refinancing by payday borrowers further impoverishes already financially vulnerable households. The industry is regulated at the state level, and regulatory policies range widely state-by-state. In 1998 just 19 states permitted payday lending, but the industry gained additional markets as state legislatures exempted payday lenders from existing usury ceilings; as of February 2008 eleven states prohibited payday lending, eight states allowed payday lenders to operate without any special regulations, and the remaining states permitted payday lenders to operate under a variety of regulatory constraints (Samolyk 2006, Flannery and Samolyk 2007, Nicholson 2008).
The high prices that households pay for payday credit, and the chronic nature of payday borrowing among many of these households, have been documented thoroughly both by policy advocates and academic researchers (see Section 2 below). But while these facts about loan price levels and repeat borrowing frequencies are important, they are incomplete inputs for informing good public policy; next to no attention has been paid to whether, how, and by how much payday loan prices vary across lenders and
across borrowers. Forming effective public policy requires a better understanding of payday loan price determination. For example, in an industry in which entry barriers are extremely low, do increased numbers of payday firms create competition that puts downward pressure on prices? Is there evidence that payday stores charge systematically higher prices to customers with more inelastic demand, such as repeat borrowers, borrowers in low income or minority neighborhoods, or military personnel? Did pricing patterns changed as the industry evolved from mostly small Mom-and-Pop operations to large multi-store payday loan corporations? How do regulatory pricing caps affect the pricing behaviors of payday lenders? And is the standard APR pricing measure the best metric for understanding payday loan prices, or do better pricing constructs exist? This study attempts to answer these and related questions about the determination of payday loan prices.
We examine the variation in finance charges across a sample of 35,098 payday loans originated in Colorado between 2000 and 2006. These data were compiled during compliance examinations conducted by the Colorado Office of the Attorney General at 610 payday stores operating in 117 different local markets and owned by 186 different payday lending companies. While these unique data were collected for purposes of regulatory compliance, and as a result pose some challenges when used in a research study, they nonetheless allow us to test a number of hypotheses which to date are unaddressed in the literature.2 We construct three different price variables from these data: the standard annual percentage rate (APR); a binomial variable indicating whether the loan carried the maximum finance charge allowed
by Colorado law (BINDING); and the difference in dollars between the regulatory maximum price and the
price that was actually charged (GAP). Because these three prices exhibit different statistical
distributions, we use ordinary least squares, logit, and Tobit estimation techniques, respectively, to test for pricing determinants. We observe these loan prices at different points in time but the data themselves are not longitudinal (i.e., we observe each loan only once, at its origination). We attempt to bring order to the data by clustering the standard errors on both the year in which the loan was made and on the payday firm that made the loan. Payday lenders operated in only about one-quarter of the local markets in Colorado
during our sample period, so we employ a Heckman correction procedure to control for selection bias related to geographic location; this procedure generates some interesting byproduct results, which we present and briefly discuss in the Appendix.
We find a number of statistically significant and economically meaningfully relationships linking payday loan prices to industry regulation, to local market conditions, and to numerous borrower and lender characteristics. The existence of a regulatory price ceiling, and how it appears to have influenced firms’ pricing behavior, is central to our findings. Upper limits on payday loan prices had just been established in Colorado at the beginning of our sample period, and the data show that payday loan finance charges gravitated systematically toward the price ceiling over time. This pattern is consistent with Schelling’s (1960) observation that firms in oligopolistic markets will implicitly collude around price and non-price focal points, and is similar to Knittel and Stango’s (2003) findings for state-imposed credit card interest rate ceilings. As this apparent implicit collusion become more complete, the average payday lender altered its pricing behavior. For example, early in the sample when finance charges were still loosely distributed below the price ceiling, loans originated in markets with a large number of payday firms carried lower prices. But later in the sample these competitive effects disappear and evidence consistent with strategic price behavior emerges. Lenders begin charging lower prices to first-time customers (higher prices to repeat borrowers); moreover, these discounts are largest in local markets with the fewest competing payday loan firms, a result that echoes the dynamic pricing strategy posited by Petersen and Rajan (1994) for loans to informationally opaque small business borrowers. Lenders also begin charging higher prices at stores in largely minority neighborhoods and at stores located near military bases, arguably local markets in which demand for payday loans should be relatively inelastic.3
The organizational form adopted by payday lenders is also central to our findings. On average, payday stores affiliated with multiple-location payday companies charged higher prices than single-store Mom-and-Pop payday lenders. But this result is far from uniform. On-the-one-hand, multi-store payday
3 Our data sample ends in December 2006, prior to federal legislation that limited interest rates on loans to military
firms were more likely than independent payday stores to charge lower prices to first-time customers and/or to charge higher prices on long-maturity loans that roll over less frequently. On-the-other-hand, multi-store firms tended to charge lower prices than single-store lenders near military bases and in minority neighborhoods; with higher franchise values at stake, these firms may have willingly absorbed small reductions in lending margins in order to reduce the headline risk associated with consumer advocate criticism (and the eventually possibility of regulatory intervention).
All of these findings are strong and consistent for two of our three pricing variables; the exception is the APR pricing measure, for which our regression results are generally weaker and sometimes economically counter-intuitive. APR is the yardstick used most often by industry critics to illustrate the high cost of payday credit, and it is frequently used to parameterize state laws and regulations that govern payday loan pricing. Given that the APR is the accepted standard for gauging payday loan prices, these weak results should give us pause.
The remainder of the paper is organized as follows. We briefly review the main institutional features of payday lending, as well as the extant academic literature on payday lending, in Section 2. In Section 3 we describe the regulatory environment facing payday lenders in Colorado, the strengths and weaknesses of the Colorado payday loan data, and the three different payday loan pricing measures used in this study. Section 4 presents our statistical testing methodologies, and Section 5 presents the variables we use to specify those tests. We analyze our test results in Section 6 and discuss the public policy implications of our findings in Section 7.
2. Payday Lending
Payday lending has been around since at least the early 1900s, when lenders would purchase workers’ future paychecks at a discount (Caskey 2005). This line of business was limited in scope, because lenders required soft information about the financial health of employers and the creditworthiness of employees in order to reduce the costs of adverse selection and moral hazard. A century later, advances in information and financial technologies have substantially mitigated these costs and permitted
much wider access to payday credit. An example is instructive: a payday borrower writes a post-dated personal check for $350 (the date on the check coincides with the direct deposit date of the borrower’s next paycheck), gives the check to a payday lender in exchange for $300 in cash, and pays no out-of-pocket fees. The lender approves the loan only after ascertaining the collateral value of the personal check (thus reducing adverse selection), using its access to inexpensive hard information from online consumer credit bureaus.4 The loan has three possible outcomes. The customer could pay off the loan
any time within two weeks, paying the lender $350 cash to redeem the check. Alternatively, the customer could extend the $300 loan for an additional two weeks by paying the lender the $50 finance charge. If neither of these events occurs, then the lender will deposit the personal check immediately upon payday; direct payroll deposit and swift electronic check clearing make it more likely that the check will clear before the borrower withdraws the payroll funds (thus reducing moral hazard costs).
The financial footprint of the payday loan industry is very small, but its demographic footprint is extensive. The aggregate principal of all outstanding payday loans at any given point in time totals less than $2 billion, about the same size of the lending portfolio of a large community bank; still, an estimated 9 to 14 million consumers borrow from payday lenders each year (Flannery and Samolyk 2006). Because the payday lending production function requires customers to have checking accounts, payday borrowers are not part of the large “unbanked” population that lacks access to mainstream financial services. Nevertheless, payday lenders are typically characterized as providers of “fringe” financial services, along with pawn brokers, check cashers, automobile title lenders, etc. Pawn shop revenues have declined as payday lenders have multiplied, perhaps indicating that consumers prefer the convenience of posting exact collateral in the form of a personal check to pawning physical collateral worth several times the loan amount.5
4 The online service most often used by payday lenders is Teletrack, which tracks consumer check-bouncing history
and payday loan defaults.
5 For example, the number of pawn shops in Ohio declined by 20 percent after the state authorized payday lending in
1995 (Burns 2008). The popularity of Ebay and other online marketplaces has also contributed to the decline of pawn shops.
The centrality of the bank account in the payday loan production function suggests that the closest competitive substitutes for payday loans are not the products offered by fringe financiers, but the overdraft protection offered by mainstream banks, thrifts, and credit unions. Most depository institutions offer some form on overdraft protection; for a fixed fee, the bank will cover (rather than bounce) a check written on an account with insufficient funds. The APRs on checking account overdrafts can easily exceed those on payday loans: for example, if a bank charges a $20 fee to cover a $100 overdraft, and the customer brings the account back to a positive balance after two weeks, the APR would be 520% (Caskey 2005). An exhaustive study on overdraft protection performed at the Federal Deposit Insurance Corporation (FDIC 2008) finds that the average APR on a two-week checking account overdraft is 1,067 percent. Faced with having to bounce several checks—and thus having to incur the fixed overdraft charge several times—a depositor with a low checking account balance might rationally decide to take out a payday loan that covers all of her expenses and generates just a single fee. Indeed, Elliehausen (2009) found that 80 percent of payday borrowers lacked sufficient funds in their checking accounts to meet their expenses, so by choosing a payday loan they avoided expensive account overdraft fees. Aside from this study, there is little systematic empirical evidence about the marginal financial choices of payday borrowers.
Payday lenders are licensed and regulated by the states in which they operate. Limits on loan size, number of loans, and loan prices vary substantially across the states. An unfortunate byproduct of this state-by-state approach is a lack of systematic data collection needed to support objective academic research. Studies prepared or supported by consumer advocacy organizations (e.g., Center for Responsible Lending, Consumer Federation of America) assail payday lenders for charging usurious prices, for preying on unsophisticated and economically disadvantaged consumers, and for creating a “cycle of poverty” among these borrowers; not surprisingly, studies prepared or supported by organizations affiliated with the payday loan industry (Consumer Credit Research Foundation, Consumer Rights League) typically find evidence to the contrary, and argue against further regulation of the
industry. The paucity of systematic, cross-state data can make objective confirmation or dismissal of such claims difficult.
A profile of the demand side of the industry has emerged in the academic literature; one typical study finds that payday customers tend to be young adults with high school educations, are married with children, and over half carry major credit cards (Caskey 2005). This profile, combined with the requirement that payday borrowers have bank accounts and receive steady income, suggests that payday demand is not driven by a lack of access to fundamental financial services. Although payday loans are marketed as short-term credit vehicles to help bridge gap between now and the next payday, a substantial numbers of borrowers remain in payday debt across several pay periods. For example, Elliehausen and Lawrence (2001) find that about half of the payday borrowers sampled from 19 payday firms had seven or more payday loans during the preceding twelve months; Chessin (2005) finds that over half of payday lenders’ loan volume in Colorado is from repeat customers; and Brown and Cushman (2006) report high rates of serial borrowing among U.S. servicemen. There is scant evidence about the expectations of payday borrowers. Bertrand and Morse (2009) survey payday borrowers and find some evidence of rational expectations: more than half of the surveyed borrowers expected to pay off their loans on time, but the mean borrower expected to refinance the loan one time. Nevertheless, the high frequency of repeat borrowing—combined with evidence that payday stores tend to locate in minority neighborhoods (Temkin and Sawyer 2004; King, Li, Davis, and Ernst 2005) and near military bases (Graves and Peterson 2005; Oron 2005) where low incomes and inelastic demand arguably make loan refinancing more likely—reinforces the perception (or demonstrates the reality) that payday lenders practice predatory behavior.
The profitability of payday lenders depends on repeat borrowing. An Ernst and Young (2004) study of 19 payday loan firms in Canada estimated that serving new customers accounts for 85 percent payday lender expenses; hence, margins on repeat loans are drastically higher than on new loans. Using data from two large payday lending firms, Flannery and Samolyk (2007) find that “high per-customer loan volume” helps payday lenders exploit store-level scale economies as well as offset high loan default
rates that account for 21 percent of total operating expenses.6 These production economics should influence payday lenders’ business strategies; in this vein, Stegman and Faris (2003) conclude that converting occasional payday borrowers into “chronic” borrowers is an important source of profits for payday lenders. Despite the high incidence of repeat business and the stratospheric APRs, however, there is little evidence that payday lending generates excess profits. Skiba and Tobacman (2007) find that, after adjusting for risk, market returns to publicly traded payday loan companies are similar to those of other financial firms. This finding is consistent with low barriers to entry in this industry: the payday loan production technology is well known, required financial capital is low (industry data suggest that the typical store has only about $100,000 of loans outstanding), and there are very few sunk costs. Market entry may make a competitive difference: Morgan (2007) finds a negative association between payday loan prices and the number of payday stores per capita (as well as the number of pawn shops per capita) in a cross-section of 37 U.S. cities.
Careful research on the social welfare effects of payday lending is just beginning, and so far the findings are mixed. Morse (2007) finds that the presence of payday lenders makes local communities more resilient to negative economic shocks such as natural disasters. Morgan (2007) finds that economically vulnerable households (those with uncertain income and/or low educational attainment) that live in states with unlimited access to payday loans are less likely to be denied credit, no more likely to miss loan payments, and no more likely to have high debt levels, when compared to households in other states. Morgan and Strain (2008) find higher incidences of bounced checks, consumer complaints about debt collectors, and Chapter 7 bankruptcy filings in states that banned payday lending (Georgia and North Carolina) compared to states that allowed payday lending. Zinman (2008) finds that the tightening of payday loan price regulations in Oregon in July 2007 caused a (short-run) deterioration in the overall financial conditions of Oregon households. Melzer (2007) also studies households in Oregon but finds harmful effects: households located close to Oregon’s borders with states where access to payday loans is
6 By comparison, in 2007 loan losses at U.S. commercial banks with assets less than $1 billion accounted for only
easy experienced higher rates of personal bankruptcy. Exploiting loan-level data from a single large payday loan company, Skiba and Tobacman (2008) also find higher rates of bankruptcy for households approved for payday loans; they also find a reduction in pawn broker debt among these households. Carrell and Zinman (2008) find “non-trivial” negative effects on job performance and readiness of U.S. servicemen with payday debt.
3. Data
In Colorado, payday lending is regulated under the Colorado Uniform Consumer Credit Code (CUCCC) as modified by the Deferred Deposit Loan Act (DDLA). The Act defines a “deferred deposit loan” as a consumer loan in which the lender advances money to the borrower and in return for a check written for the amount of the advance plus a finance charge. The lender may not cash the check until the specified loan term has expired. Loans cannot be larger than $500, the loan term cannot exceed 40 days, and the finance charge is capped at 20% of the loan principal up to $300 and 7.5% of the principal amount between $300 and $500. A loan can be “renewed” only once—although in practice loans can be refinanced repeatedly using “same day as payoff” loans in which lenders simply issue new loans to refinance existing loans. Written loan agreements are required, and include the borrower’s name, the transaction date, the amount of the loan, the finance charges expressed both in dollars and APR, and the following statement in large type: "A deferred deposit loan is not intended to meet long-term financial needs. A deferred deposit loan should be used only to meet short-term cash needs. Renewing the deferred deposit loan rather than paying the debt in full will require additional finance charges.” Applicable finance charges must be posted on signage at the point of sale, which is commonly known as a “payday store.”
Every payday loan store must be licensed by the State, whether the store is a free-standing “Mom and Pop” business or a branch location of a multi-store payday lending company. The State Attorney General’s Office periodically examines all licensed payday lenders for compliance with the DDLA and the CUCCC. Compliance exams began in July 2000 (shortly after the April 2008 enactment of the
DDLA), with most payday stores being examined every one-to-two years. At each compliance exam, information is recorded from the store’s 30 most recent loan transactions, including the amount, finance charge, and term of the loan; whether the loan was a new loan, a renewed loan, or a refinanced loan; and the frequency of customer borrowing from this lender over the past six-to-twelve months. This compliance exam information forms the core of our data.7
The raw compliance exam records contain information on 38,116 payday loans issued between July 2000 and December 2006. We exclude 3,018 loans with incomplete records or outlying values, leaving us with 35,098 useful records for our tests.8 The loans were made in 117 different local markets,
at 610 licensed payday stores owned by 186 separate payday companies. Of these 186 payday loan companies, 112 were “Mom-and-Pop” companies that operated just a single payday loan store, and 74 were multi-store companies that operated 498 payday loan stores between them. These payday loan stores operated in just 117 of the 476 Zip code areas in Colorado during our sample period; as discussed below, we take measures to control for selection bias potentially caused by the location decisions made by payday lenders.
We use the 5-digit Zip codes of the payday stores to define local geographic markets. Zip code areas are geographically smaller than the city-wide, MSA-wide, or county-wide areas typically used to test for competitive effects in banking markets; however, Zip code areas are geographically larger than the Census-tract areas typically used to test for demographic phenomena in lending markets. Thus, we are steering a middle ground. While the Zip code area around the payday store is an imperfect measure of local market geography, it has a number of attractive attributes for our purposes. First, because payday borrowers are unlikely to travel long distances to take out such low-value loans, small Zip code areas may
7 In July 2001, examiners began collecting demographic data such as borrower age, gender, martial status, monthly
income, and length and type of employment. Unfortunately, these demographic data cannot be merged with the pricing data from the compliance exams, because they are drawn from a different sample of loans. Chessin (2005) has studied these demographic data, and finds that the typical Colorado payday borrower is a thirty-six-year-old single woman, makes $2,370 per month, and has been employed as a laborer or an office worker for about three and one-half years.
8 Approximately half of the excluded loan records contained incomplete information. The other half of the excluded
loan records either (a) had loan principals exceeding legal limits, (b) were made to borrowers with multiple loans at the same payday store, and/or (c) had outlying values such as loan principals less than $100, loan terms less than 4 days or greater than 33 days, or loans with finance charges less than $5.
be more appropriate than large Metropolitan Statistical Areas (MSAs). Second, because efficient scale for payday loan stores is relatively small, a Zip code area can support multiple payday loan stores; in our data, the average Zip code area was home to 4.14 payday loan stores. Third, because we do not have demographic data for individual borrowers, and must instead observe demographic information at the market level, the small Zip code areas provide us with the variation in demographics necessary to test neighborhood-effect hypotheses. Finally, 5-digit Zip codes allow us to merge our payday loan records with databases on local demographics (demographic data from the U.S. Census Bureau) and commercial bank branches (the Summary of Deposits data from the Federal Deposit Insurance Corporation).
These data were collected by the State of Colorado with regulatory purposes in mind, not research methodologies, and as such they have a number of shortcomings for our purposes. First, loan outcomes (i.e., whether borrowers repaid, refinanced, or defaulted on their loans) are not included in the data. Second, repeat borrowers cannot be tracked across time, because neither borrowers nor their loans are tagged with identification numbers. Third, the lenders are tagged with anonymous lender identification numbers, so we cannot link these data to other payday lender databases. Fourth, there is no information about borrower demographics or location in our data, so we must make inferences based on the demographics of the ZIP Code areas in which the lenders are located. Fifth, we observe a sample of the loans written by each payday store, not the population of all loans, so we are unable to construct standard measures of market share or market concentration. Despite these imperfections, this remains a unique database that spans hundreds of lenders, thousands of borrowers, and scores of local markets; this richness provides an opportunity to test a variety of interesting and important hypotheses about payday loan pricing.
3.1. Measuring payday loan prices
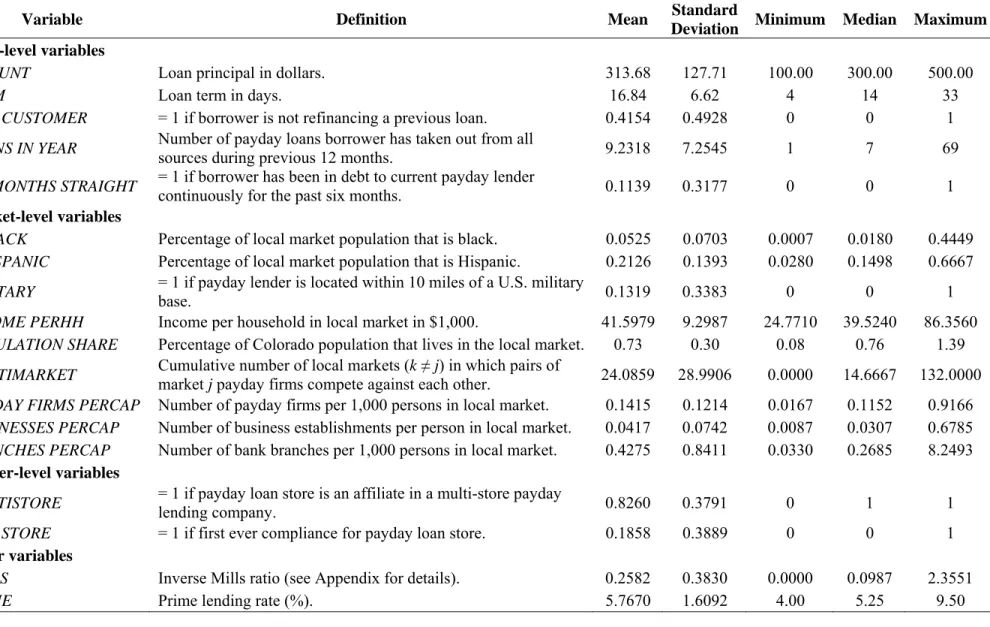
The three chief characteristics of a payday loan are the loan principal in dollars (AMOUNT), the
maturity of the loan in days (TERM), and fixed finance charge in dollars (CHARGE). Table 1 reports
definitions and summary statistics for these three variables. As discussed above, the usual way to express the price of a payday loan is the annual percentage rate (APR), calculated as follows: APR =
(CHARGE/AMOUNT)*(365/TERM). Colorado law places a ceiling on CHARGE (and thus on APR), so
we also construct two loan pricing measures that reflect this constraint. BINDING is a dummy variable
equal to one if CHARGE equals the maximum price allowed under Colorado law, and equal to zero for
loans that are priced below the legal ceiling.9
GAP is the difference in dollars between the maximum
legal price and the actual loan CHARGE, i.e., the pricing discount below the legal maximum.10 The
average payday loan in our data had a $314 principal, a $55 finance charge, a 17-day term to maturity, and an APR of 452%. About 94 percent of the loans were priced at the legal ceiling (BINDING=1). For
the loans priced below the legal ceiling, the average discount (GAP) to borrowers was $9.31. The
definitions and summary statistics for these three loan pricing measures are also reported in Table 1. As shown in Figure 1, the distributions of the three pricing measures evolved during the sample period. The percentage of payday loans carrying the maximum legal finance charge (BINDING=1)
increased systematically from 69 percent in 2000 to 97 percent in 2006; consistent with this, the annual mean values of GAP declined from $2.58 to $0.36. These measures indicate that payday lenders left less
‘money on the table’ over time. Moreover, the distributions around both of these mean values grew tighter over time. These are the qualitative patterns one would expect if the regulatory price ceiling was serving as a focal point, with payday lenders abandoning price competition and gravitating toward deterministic pricing rules over time. In contrast, the annual mean values of APR did not decline
systematically over time in a systematic fashion, and the confidence intervals around APR diminish much
less markedly. Thus, while APR is the pricing measure most often used in social and regulatory discourse
concerning payday lending, it does not necessarily capture systematic and meaningful movements in the finance charges set by payday lenders.
9 In practice, that data suggest that some lenders calculate the highest finance charge allowable under the law for a
given loan, and then round the actual finance charge up or down to the nearest whole dollar amount. Because of this, we set BINDING=1 if CHARGE is within $.50 (above or below) of the legal maximum price.
10 Because
GAP is likely to increase with the size of the loan, we also constructed a fourth pricing measure %GAP = GAP/AMOUNT. Test results from regressions using %GAP as the dependent variable (results not reported, but are
available upon request) were very similar, both statistically and economically, to those from regressions in which
4. Statistical methodology
The three payday loan pricing measures APR, BINDING and GAP are the dependent variables in
our regression tests, and each requires a different estimation technique. For the dummy variable
BINDING we use logit estimation; for the censored variable GAP we use Tobit estimation; and for the
two-tailed APR measure we use ordinary least squares. Note that we use the negative value of GAP in the
Tobit regressions, so that all three dependent variables increase with loan price. The data distributions for the two continuous pricing measures, GAP and APR, are displayed in Figure 2. Regardless of estimation
technique, we specify the baseline regression equation as follows:
loan price = f ( non-price loan terms, borrower payday loan history, payday lender characteristics, local market structure,
local market demographics, year dummies, month dummies) + ε (1)
where loan prices are observed at the individual loan level and ε is a disturbance term assumed to follow the appropriate distribution for the estimation procedure (logit, probit, OLS) at hand. The variation in the data is cross-sectional; although the loans were originated at various points in time between July 2000 and December 2006, each loan is observed only once in the data (at origination), which precludes us from tracking loans or borrowers across time. We include year dummies and month dummies to capture, respectively, systematic inter-temporal price movements and seasonal price variation. The right-hand side variables are observed variously at the loan level (e.g., non-price loan terms, borrower payday loan history), the lender level (e.g., payday lender characteristics), or the local market level (e.g., market structure, market demographics). While our specification of equation (1) is ad hoc, one can think of it as
a reduced form pricing model in which supply-side influences (e.g., market structure, payday lender characteristics) and demand-side influences (e.g., market demographics, borrower payday history) jointly determine payday loan prices. Definitions and summary statistics for the right-hand side variables can be
found in Table 2; we discuss these variables, as well as testable hypotheses related to these variables, in the section that follows.
We take two additional steps to improve estimation accuracy and statistical inference. First, we cluster the regression standard errors on both the origination year of the loan and on the payday lending firm that made the loan. The importance of allowing standard errors to vary across time is evident from the data displayed in Figure 1. Allowing regression standard errors to vary across firms is also important, because some firms may follow strict pricing rules while others may allow managers pricing discretion. Indeed, the data suggest that pricing practices vary considerably across firms: for example, the standard deviations of payday loan prices tend to vary substantially more across payday loan firms than within
payday loan firms.11 This by-firm, by-year clustering procedure results in 495 separate clusters in the
full-sample regressions.
Second, we perform a Heckman correction procedure to control for sample selection bias potentially arising from the geographic locations of payday lenders. Payday lenders are located in only 117 of the 476 Zip code areas in Colorado; these location decisions undoubtedly depended on local market characteristics, some of which (e.g., market demographics) are important test variables in our regressions. An inverse Mills ratio—generated from a binomial probit model estimated across the 476 Colorado Zip code areas; dependent variable equal to 1 for Zip code areas that contain payday stores, equal to 0 otherwise—is included on the right-hand side of equation (1) to control for this selection bias. We note that the first-stage probit model is estimated at the market level, while our main test regressions (1) are estimated at the loan level. Additional details regarding the Heckman correction are provided in the Appendix; although it is not our intention to perform a full-blown investigation of payday store location decisions, the Appendix contains the full results of the probit estimation along with a brief discussion of our findings.
11 We made the following calculations for the 172 payday lending firms that reported at least 25 loans in the data:
The standard deviation of mean BINDING across firms is 0.242, more than twice the average within-firm standard
deviation of 0.102. The standard deviation of mean GAP across firms is $2.44, about 80 percent larger than the
average within-firm standard deviation of $1.37. The exception is APR, where the across-firm standard deviation is
5. Variables and hypotheses
Definitions and summary statistics for the variables used to specify the right-hand side of equation (1) are displayed in Table 2. Some of these variables provide either direct or indirect tests of hypotheses related to payday loan pricing strategies (TERM, LOANS IN YEAR, SIX MONTHS
STRAIGHT, NEW CUSTOMER, NEW STORE, MILITARY, %BLACK, %HISPANIC, PAYDAY FIRMS
PERCAP, MULTIMARKET, MULTISTORE, and the YEAR dummies). The rest are control variables
included to absorb systematic variation in payday loan prices unrelated to our strategic pricing hypotheses
(AMOUNT, INCOME PERHH, POPULATION SHARE, BUSINESSES PERCAP, BRANCHES PERCAP,
PRIME, and the MONTH dummies).
Loan-level variables. The average payday borrower in our data had taken out 9 loans over the
past year (LOANS IN YEAR) and at the time of loan origination about 11 percent of the borrowers in our
data had been in payday debt for at least six months (SIX MONTHS STRAIGHT). The net impact of this
serial borrowing on payday loan prices is theoretically ambiguous. Repeat borrowing indicates strong demand for payday loans which lenders might exploit by charging higher prices. Such pricing behavior would be reflected in positive coefficients on LOANS IN YEAR, which measures chronic borrowing from
payday firms in general, and on SIX MONTHS STRAIGHT, which measures chronic repeat borrowing
from the current payday lender. On the other hand, serial payday borrowing is possible only if customers do not default on the earlier loans, so (ironically) serial borrowers identify themselves as low-credit risk customers and as such may pay lower prices that reflect low risk premiums. Moreover, serial borrowers generate the high per-customer loan volumes needed to exploit store-level scale economies (Flannery and Samolyk 2007) and payday lenders may shade prices to keep them coming back.
In contrast, about 41 percent of the loans in our data went to non-repeat customers, i.e., loans not used to rollover or refinance a previous loan with the same lender (NEW CUSTOMER). A negative sign
on NEW CUSTOMER could indicate that payday lenders offer discounts to attract first-time customers to
pricing strategies are more prevalent in concentrated local markets, where switching costs increase the chances of retaining repeat borrowers (Petersen and Rajan 1994), we also estimate an alternative regression specification in which NEW CUSTOMER is interacted with PAYDAY FIRMS PERCAP.
The average loan in our data carried a term of 17 days (TERM) and a $313 loan principal
(AMOUNT). Payday loans are discount loans—that is, holding price constant, lender revenue is
negatively related to loan maturity. Hence, we expect a positive association between loan prices and
TERM, as lenders should adjust the finance charge higher for loans that take longer to mature. We
include AMOUNT to control for loan size. All else equal, larger loans should carry higher finance
charges, although the convexity of the maximum payday loan pricing schedule in Colorado will dampen this positive relationship. Thus, we expect a negative relationship between loan size and loan prices expressed in percentage terms such as APR, but have no a priori expectation for loan prices expressed in
dollar terms such as GAP.
Market-level variables. The average local (Zip code area) Colorado market in which payday
lenders operated held about 0.7 percent of the total Colorado population (POPULATION SHARE), and the
average household income in these markets was $41,598 (INCOMEPERHH). All else equal, demand for
retail goods and services increases with population; thus, we expect loan prices to increase with
POPULATION SHARE. Controlling for population, we expect loan prices to decrease with
INCOMEPERHH, because payday lending could be considered an inferior good. About 5% and 21% of
the populations in these local markets were black (%BLACK) and Hispanic (%HISPANIC), respectively,
and about 13% of our sample markets were located within 10 miles of a U.S. military base (MILITARY).12
Controlling for income levels, the coefficients on %BLACK, %HISPANIC, and MILITARY will reflect the
joint impact of (a) reduced access to non-payday credit sources in some of these neighborhoods, (b) demand inelasticity fostered by reduced access to mainstream credit and/or other intrinsic demand-side
12 The values of these demographic variables are observed from the 2000 U.S. Census; hence, our regression
estimates will capture variation in loan pricing across local markets but will not capture inter-temporal variation across our 2000-2006 time period. This is unlikely to create serious bias, however, given the relative stickiness of demographic data.
preferences for payday credit in these neighborhoods, and (c) non-economic price discrimination. All three of these phenomena imply higher payday loan prices.
The compliance exams from which we draw our data record information on just 30 loans regardless of the size of the payday store being examined; as a result, we are unable to construct local market shares for payday lending firms. We measure local market structure by PAYDAY FIRMS
PERCAP, which equals the number of firms that operate at least one payday store in the local market in a
given year, scaled by the population in that market. The average local market contained about 14 payday firms per 100,000 persons. A negative coefficient on this variable is consistent with classical models of price competition. We supplement this measure with MULTIMARKET, which equals the cumulative
number of local markets (k ≠ j) in which pairs of market j payday firms also compete against each other.
In a typical local market, pairs of payday firms competed against each other in about 24 other local Colorado markets. A positive coefficient on this variable would suggest that multi-market contact dampens competitive rivalry (Tirole 1988, p. 243).
Two additional variables test whether the local business environment affects payday loan pricing. On average, there were approximately 4 business establishments per every 100 persons (BUSINESSES
PERCAP) and about 4 bank and thrift branches per every 10,000 persons (BRANCHES PERCAP) in the
local markets in which payday stores operated. A positive sign on BUSINESSES PERCAP may indicate
that payday borrowers prefer to do their banking (and thus are willing to pay a higher price) near their places of employment. Similarly, a positive coefficient on BRANCHES PERCAP may indicate that
payday borrowers prefer to all of their banking (i.e., retail banking and payday borrowing) in a single trip;
it may also be an indirect reflection of the payday loan production function which requires payday borrowers to have checking accounts at banks.
Lender-level variables. It is not unusual for newly established retail businesses to offer
below-market prices to attract new customers and establish a clientele. About 19 percent of the loans in our data are observed during payday stores’ initial compliance examinations; NEWSTORE is a dummy variable
that indicates those loans. We expect a negative coefficient on this variable if newly opened payday loan stores use such a discount pricing strategy.
The organizational structure of the Colorado payday loan industry has evolved over time from predominantly independent “Mom-and-Pop” payday loan stores (39 percent of the stores our 2000 data) to predominantly affiliates of multi-store payday corporations (87 percent of the stores in our 2006 data). The two types of stores are likely to exhibit different pricing behaviors. Because multi-store affiliates are essentially branch locations, they are likely to act like revenue centers rather than profit centers, following pricing strategies that are dictated by headquarters rather than by local management. Customers may also be willing to pay higher prices for loans at these stores, ceteris paribus, due to actual (better store locations, nicer in-store amenities) or perceived (advertising-driven) quality differences.13 On average,
about 83 percent of the loans in our data were written at payday stores affiliated with multi-store companies; MULTISTORE is a dummy variable that indicates these loans. The sign of coefficient on this
variable is theoretically ambiguous: while the revenue-maximization and product-differentiation phenomena both predict a positive sign, the potential for scale economies within these larger organizations may allow affiliates in multi-store firms to charge lower prices. To the extent that successful product differentiation creates higher franchise value at these firms, multi-store payday lenders may be hesitant to pursue pricing strategies that elicit reactions from consumer groups and the press (e.g., exploiting price inelastic demand associated with racial status, military status, or the elderly) in order to protect that value. To test for more these and other more subtle pricing differences between multi-store affiliates and independent payday loan stores, we also estimate an alternative regression specification in which MULTISTORE is interacted with TERM, NEW CUSTOMER, NEW STORE, MILITARY, %BLACK,
%HISPANIC, PAYDAY FIRMS PERCAP, and MULTIMARKET.
Time-related and other variables. Bank loans are a primary source of payday lender finance,
so we include the U.S. monthly average prime borrowing rate (PRIME) in our regressions and expect a
13 Along these lines, Flannery and Samolyk (2007) characterize payday lending as a monopolistically competitive
positive coefficient on this variable. We include a vector of MONTH dummies to control for potential
seasonality in loan pricing; payday loan production costs are unlikely to be seasonal, so any monthly variation in loan prices would be attributed to demand-side phenomena and the potential strategic reaction of payday lenders to those phenomena. We also include a vector of YEAR dummies to absorb variation in
loan prices across time, and more specifically to test whether the regulated ceiling on payday loan finance charges in Colorado has provided payday lenders with a pricing focal point around which to tacitly collude (Knittel and Stango, 2003).14 The following pattern of coefficients would be consistent with
gravitation toward the regulatory ceiling over time: βYEAR2000 < βYEAR2001 < …… < βYEAR2004 < βYEAR2005.
Finally, we include the inverse Mills ratio derived from the Heckman correction procedure (see the Appendix for more details) to control for sample selection bias at the local market level. A statistically significant coefficient on MILLS indicates that the correction procedure was necessary, and a positive
coefficient on MILLS suggests a causal link between unobservable conditions that attract payday lenders
to certain local markets and unobservable conditions that allow payday lenders to charge higher prices.
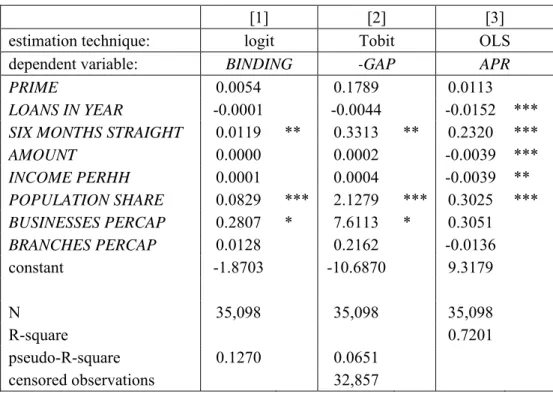
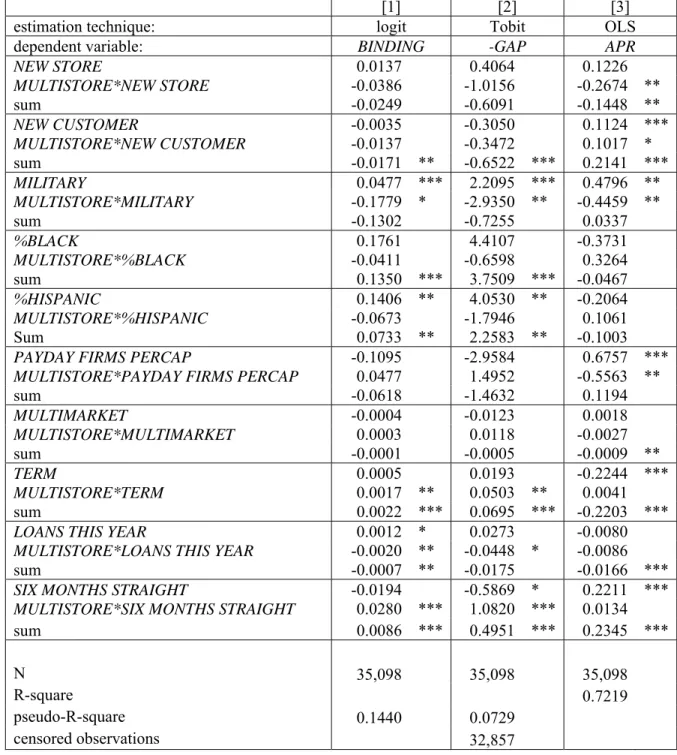
6. Results
The main regression results are displayed in Table 3. For ease of interpretation, we multiply the dependent variable GAP by -1 so that positive regression coefficients indicate higher loan prices in all the
regressions, and we report the estimated marginal effects rather than the estimated coefficient values in the logit and Tobit regressions. The regression standard errors are clustered by year and by payday firm in all the regressions, resulting in 495 different clusters of observations. The coefficients on the YEAR
variables are interpreted relative to the excluded 2006 dummy, and coefficients on the MONTH variables
are interpreted relative to the exclude January dummy.
The coefficient on MILLS is statistically significant in all three models, which indicates that the
first-stage Heckman correction for local market selection bias was a necessary step. The signs on these
14 There is one piece of circumstantial evidence in the literature consistent with this conjecture: A survey conducted
by PIRG/CFA (2001) found that the highest payday loan APRs were in states that had usury ceilings. However, that study provided cross sectional evidence, not time series evidence.
coefficients imply positive correlations between unobservable conditions that determine the presence of payday lenders in a local market and unobservable conditions that determine higher payday loan prices. This makes intuitive sense: All else equal, payday lenders will prefer to locate in markets where they can charge high loan prices.
After controlling for a myriad of influences on payday loan prices, the coefficients on the YEAR
dummies mirror the univariate patterns in Panels A and B of Figure 1. Compared to payday loans written in 2006, payday loans written in 2000 were 34.23% (i.e., 34.23 percentage points) less likely to be priced at the legal maximum; in addition, the 2000 loans carried prices that were $4.22 and 34.57 APR basis points lower than 2006 loans. The YEAR coefficients become gradually less negative and approach zero
over time in both the BINDING and GAP regressions, patterns consistent with the hypothesis that price
ceilings in Colorado provided a focal point around which payday lenders tacitly colluded to set high prices. However, in the APR regression the movement toward zero is very abrupt, the first of many
divergent results we find for the APR price variable.
By definition, tacit collusion leaves no direct evidence; while the estimated YEAR effects found
here are consistent with pricing focal point theory, they surely do not constitute a smoking gun and can arguably be classified as circumstantial evidence. Hence, it is natural to consider other, non-focal point explanations that are also consistent with these YEAR results: (a) Although we include a number of
demand-side determinants in the model (e.g., POPULATION SHARE, INCOMEPERHH, %BLACK,
%HISPANIC, MILITARY), our specification may not be completely accounting for growth in payday loan
demand that put upward pressure on payday loan prices during the 2000-2006 time period. This seems unlikely, however, given the ease of market entry and the rapid growth in the number of licensed payday lenders operating in Colorado during the same period. According to Pfenning (2005), the “growth in the number of DDLA licensees has been explosive, with little sign of slowing,” with the population of licensed payday lenders more than doubling from 242 in July 2000 to 525 in April 2005. Moreover,
PAYDAY FIRMS PERCAP (which we include in the model) increased nearly four-fold during the sample
local market in which payday stores were located. (b) Credit risk may have increased over time, forcing payday lenders to increase their risk premiums and drive up their loan prices. But this does not square with the increase in refinanced loans (1–NEW CUSTOMER) during the sample period, which increased
from 39% of all loans made in 2000 to 65% in 2006. As discussed above, most refinanced or rolled over payday loan in Colorado were “same day as payoff” loans—that is, borrowers were establishing creditworthiness via this process—so, if anything, risk premiums and loan prices would have been
declining on average over time. (c) Payday firms may have simply been raising their prices while they could, ahead of new laws that would constrain prices more tightly—indeed, such a bill narrowly missed passing in the Colorado legislature in 2008. For this “regulatory risk” argument to be valid, however, we would expect to observe both an increase in prices and a halt to payday store expansion (i.e., firms tend not to increase their investments in declining markets) but this is contrary to the facts stated above.
We find plentiful evidence consistent with strategic pricing practices, predominantly in the
BINDING and GAP regressions.15 On average, the affiliates of multi-store payday firms charged higher
prices than independent Mom-and-Pop payday stores. Loans written by multi-store affiliates
(MULTISTORE) were 4.48% more likely to be priced at the binding legal ceiling, and when priced below
the ceiling carried prices that were higher by $1.10. First-time customers (NEW CUSTOMER) enjoyed
bargains, albeit small ones: their loans were 1.3% less likely to be priced at the legal ceiling, and when nonbinding were priced $0.55 lower. Concentrations of minority residents in local markets (%BLACK,
%HISPANIC) are associated with small price increases: a 10% increase in black (Hispanic) population in
a local market increased the probability of a binding loan price by 1.52% (0.99%) and increased the price of a nonbinding loan by $0.40 ($0.28). Interpreting the marginal effects of %BLACK and %HISPANIC is
difficult given that these variables measure market-level averages and not individual borrower characteristics. While these results are consistent with third-degree price discrimination that raises prices in local markets in which demand is likely to be more inelastic, they are also consistent with race-based
15 In the
APR regression the coefficients on MULTISTORE, NEW CUSTOMER, %BLACK and %HISPANIC were
price discrimination; in light of the shortcomings of our data, we will presume the former interpretation throughout the remainder of this study.
Indeed, we find additional evidence consistent with the exploitation of inelastic demand. Payday loan stores located close (within 10 miles) to military bases (MILITARY) charged higher prices on
average: these loans were 2.22% more likely to be priced at the legal maximum, and when priced below the maximum were $0.69 and 8.63 APR basis points higher. In addition, borrowers who repeatedly took out loans from the same payday store (SIX MONTHS STRAIGHT) were 1.19% more likely to pay the
maximum legal price, and for non-binding loans these borrowers paid $0.33 and 23.20 APR basis points more than average.
Markets in which firms practice strategic pricing behavior are unlikely to be competitive markets. We find only weak evidence that the presence of additional rivals constrains the level of payday loan prices. The coefficient on PAYDAY FIRMS PERCAP is negative but relatively imprecise in the BINDING
and GAP regressions; one additional payday lending firm per thousand residents reduces the probability
of a legally binding price by about 8.23%, and reduces the price of a non-binding loan by (a statistically insignificant) $1.91. The APR regression shows the opposite, and economically unintuitive, result for
PAYDAY FIRMS PERCAP.
As expected, payday loan prices are higher in more populous local markets (POPULATION
SHARE) and in local markets with more places of employment (BUSINESSES PERCAP), though not in
local markets with more bank branches (BRANCHES PERCAP). We find little evidence that payday
lenders passed along higher costs of finance: the coefficient on PRIME is positive as expected but is never
statistically significant. However, payday stores did tend to increase prices to pass along a portion of the costs of longer maturities (TERM): an additional week increased the probability of a binding loan price by
1.52% (i.e., 7*0.0016) and increased the price of a nonbinding loan by $0.36.16 (By construction, APR
16 This price increase offsets only a small fraction of the lost revenue from less frequent loan refinancings.
Increasing the loan term by 7 days, from the sample average of 17 days to 24 days, reduces the potential number of loans from about 21 loans per year to about 15 loans per year. Assuming the customer repeatedly refinances her loan for an entire year, payday lender revenue declines by roughly $325 per year ($55*6 - $0.36*15).
declines with both TERM and AMOUNT.17) We find no sensible associations between loan prices and
household income (INCOME PERHH); the significantly negative coefficient on this variable in the APR
regression is unintuitive. Finally, there is no strong evidence in support of the strategic pricing hypotheses relating seasonal loan pricing (MONTH dummies), discounted loan prices at newly opened
payday stores (NEW STORE), high volume payday lenders (LOANS IN YEAR), or multimarket contact
(MULTIMARKET).
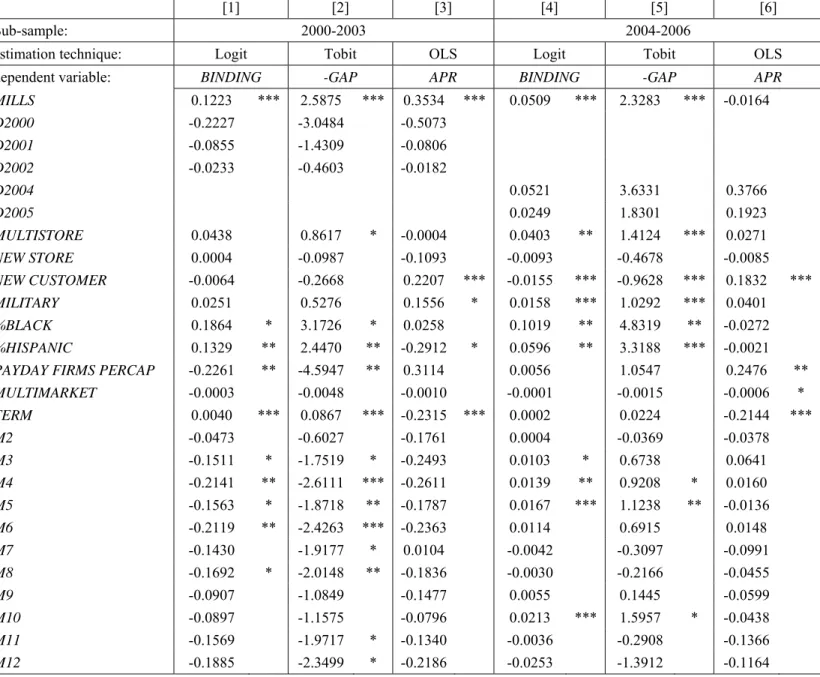
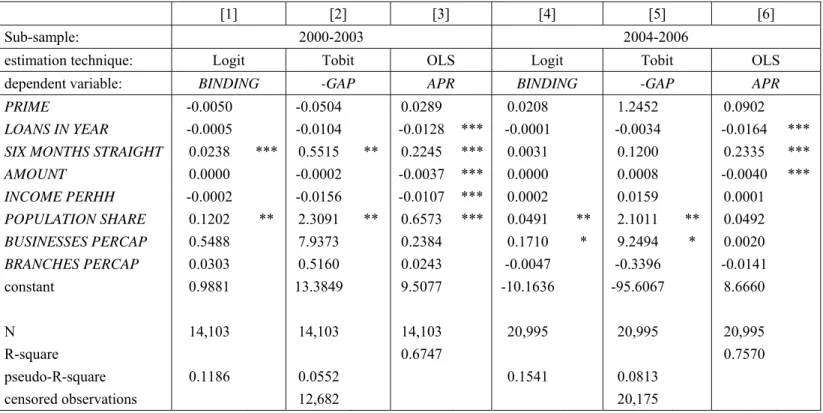
6.1. Strategic pricing by time period
As time passed during our sample period, both BINDING and GAP became more tightly
distributed around mean values that were closer to their regulatory constraints (see Figure 1). To test whether various pricing behaviors became more or less prevalent as finance charges converged toward the regulatory ceiling, we re-estimated the pricing models for early (2000-2003) and later (2004-2006) subsamples. Table 4 displays the results of these regressions. In general, the data indicate a reduction in competitive pricing pressure over time, with an increase in strategic and/or exploitative pricing behavior arising in its place.
There is evidence consistent with classical price competition in the early subsample. Prior to 2004, an additional payday firm per thousand residents (PAYDAY FIRMS PERCAP) reduces the
probability of a legally binding price by about 22.61%, and reduces the price of a non-binding loan by $4.59. These economically substantial pricing effects disappear entirely in the later subsample, however, and we find increased evidence of strategic pricing in this newly non-competitive environment. First-time customer discounts (NEW CUSTOMER) are statistically significant only in the post-2003 subsample,
when loans to new customers were 1.55% less likely to be binding and non-binding loan prices were $0.96 lower. The GAP regression estimates suggest that payday lenders exploited demand inelasticity
17 We estimated the
APR regression after excluding the right-hand side TERM and AMOUNT variables, since these
two variables are used to construct APR. The results (not shown here, available upon request) were similar to those
(MILITARY, %BLACK, %HISPANIC) to a greater degree after 2003 than in the earlier years.18 And the
price differences between multi-store affiliates and independent stores emerge only in the post-2003 data, when multi-store affiliates (MULTISTORE) became 4.03% more likely than independents to price at the
regulatory ceiling, and set their finance charges $1.41 higher for loans priced below the ceiling. As in the full-sample regressions, the coefficients in the APR regressions follow entirely different, and often
unintuitive, patterns.
In contrast, some pricing results disappear over time. On average, payday lenders stopped charging higher prices to their long-term repeat borrowers (SIX MONTHS STRAIGHT) after 2003, and
also abandoned their practice of charging higher finance charges in exchange for longer refinancing intervals (TERM). As suggested above (e.g., footnote 15), experience may have proved these practices to
be unprofitable. We also observe a substantial seasonal pricing effect prior to 2004, but not after. The average payday loan written in January—presumably when holiday bills generated a strong demand for payday advances—was between 15.11% and 21.41% more likely to carry a the maximum legal price, and non-binding loans were between $1.75 and $2.61 more expensive, compared to prices in the other eleven months. Why lenders abandoned this seasonal pricing pattern is open to conjecture; the answer may lie in the primacy of long-term relationships for payday lender profitability (Stegman and Faris 2003, Flannery and Samolyk 2007) and the reactions of repeat customers who feel that they are being held up when they need credit the most. A repeat customer can observe such seasonal price discrimination, while it is difficult for local borrowers to detect spatial price discrimination (MILITARY, %BLACK, %HISPANIC)
because they cannot compare their prices to those charged in other local markets.
While we have thus far interpreted negative coefficient estimates on NEW CUSTOMER as
evidence of a simple strategy of discounts for first-time borrowers, this result may also be consistent with a more complex pricing strategy predicted and observed by Petersen and Rajan (1994) for small business
18 In the
BINDING regressions the marginal impact of MILITARY becomes statistically stronger post-2003, but the
marginal effects of %BLACK and %HISPANIC become economically smaller. The latter result likely occurs
because 96% of the loans in the 2004-2006 subsample were written at the maximum price ceiling, leaving very little room in the logit estimation for upside marginal influence.
loans. In this strategy, a lender with local market power offers low loan prices (interest rates and fees) to new small business customers, but then exploits these borrowers’ switching costs by charging higher prices on subsequent loans. The costs of switching to a new lender are high in this scenario for two reasons: (a) it is costly for informationally opaque small businesses to re-establish their creditworthiness with new lenders and (b) there are few alternative lenders. Payday borrowers also face information-based switching costs; Stegman (2007) reports that initiating a new payday credit relationship “can take less than an hour,” so roughly, if an hour of the borrower’s time is worth more than the discounted expected stream of increased or above-market service charges on future loan refinancings, then switching costs will keep the borrower in place.19 To test whether market power better allows payday lenders to take
advantage of this pricing strategy, we re-estimated our pre-2004 and post-2003 pricing models with the interaction term NEW CUSTOMER*PAYDAY FIRMS PERCAP included on the right-hand side. A
positive coefficient on this term would indicate that increased market power (i.e., fewer payday firms per capita) is associated with larger discounts to first-time borrowers, consistent with the dynamic relationship pricing behavior posited by Petersen and Rajan (1994).
The results are displayed in Table 5. As before, we focus on the results from the BINDING and GAP regressions. During the early years there is no evidence of this pricing strategy; increased market
power (i.e., lower PAYDAY FIRMS PERCAP) is associated with higher loan prices for both first-time and
repeat customers, but on average first-time customers pay the same prices as repeat borrowers. During the later years, however, we find strong statistical evidence consistent with dynamic relationship pricing in which discounts for first-time borrowers increase with lender market power. For example, first-time customers with the fewest competitive choices (i.e., local markets in the 1st percentile of the PAYDAY
FIRMS PERCAP distribution) were 2.28 percent less likely to face binding prices and on average saved
$1.34 on that initial loan. But these discounts became less likely and shrank in size as local market
19 This is quite plausible given the small dollar amounts involved with payday loans, the high likelihood that payday
borrowers underestimate the number of times they will have to refinance their loans, the short time periods over which the discounting occurs, and the reasonable assumption that the location of any alternative payday lender is less convenient for the borrower.
structure became more competitive. For example, for local markets in the 90th percentile of the PAYDAY
FIRMS PERCAP distribution, first-time customers were just 1.26 percent less likely to face binding prices
and saved just $0.67 on that initial loan.20
6.2. Strategic pricing by firm type
We have shown that payday stores owned by multi-store firms were substantially more likely to set legally binding finance charges than independent stores, and also charged substantially higher finance charges for non-binding loans (see Table 3). To test whether multi-store firms were more or less likely than independent stores to practice various types of strategic pricing, we estimated new versions of the full-sample models that included interactions between MULTISTORE and the strategic pricing variables.
Partial results from these regressions are displayed in Table 6.
We find several instances of divergent pricing practices. Independent payday stores charged higher loan prices near military bases, but similarly located multi-store payday lenders did not. For the independent stores, prices near military bases were 4.8% more likely to be binding, and for non-binding loans prices averaged $2.21 and 48 APR basis points higher. (The significantly negative coefficients on
the MULTI*MILITARY variable essentially negate the independent store effects, as indicated by the
statistically zero coefficient sums MILITARY + MULTI*MILITARY.) The results suggest that
independent stores exploited inelastic demand in these markets while the larger firms did not, a result likely to surprise some payday lending critics. With more franchise value at stake (both inside and outside Colorado), the multi-store lenders may have wished to avoid charges of price discrimination regarding this very popular, high-profile customer group. We find similar though weaker results for loans in minority neighborhoods: both independents and multi-stores charged higher prices in heavily Hispanic markets, but the point estimates for the independent lenders are about twice as big (although this difference is not statistically significant). Multi-store lenders were 2.8% more likely than independents to charge legally binding prices to in-house chronic borrowers (MULTI*SIX MONTHS STRAIGHT) and
20 We also estimated this interaction specification for the full data sample (not shown, available upon request) and
charged these borrowers $1.08 more than did independents for non-binding loans. Multi-store lenders were also more likely to adjust finance charges upward for longer term loans (MULTI*TERM) and less
likely to charge higher prices to chronic payday borrowers (MULTI*LOANS IN YEAR), although the
economic magnitudes of these last two phenomena are immaterial.
7. Conclusions
In recent years, payday loans have become a more important source of credit for U.S. households, and payday lenders have been increasingly criticized for charging high prices to financially unsophisticated and vulnerable consumers. While academic, regulatory, and industry studies have thoroughly documented the high absolute levels of payday loan prices, almost no attention has been paid to the relative differences in payday loan prices across borrowers, lenders, and local markets; the manner in which payday lenders arrive at these prices; or the impact of government regulation on payday lender pricing practices. To the best of our knowledge, this is the first study to systematically analyze the determinants of payday loan prices. We examine the pricing patterns of payday lenders in Colorado between July 2000 and December 2006, using a variety of estimation techniques to account for potential biases introduced by regulatory price ceilings, payday store location choices, differences in pricing cultures across payday lenders, and changes in the payday loan pricing environment over time.
Even a cursory look at these data reveals a strong relationship between actual payday loan prices and the payday loan price ceiling imposed by the Colorado legislature in April 2000. With the passage of time, the average finance charge on payday loans has gravitated upwards toward this ceiling, and the variation in finance charges across payday loans has diminished. These patterns are consistent with Schelling’s (1960) theory of implicit collusion around pricing focal points, and are quite similar to those observed by Knittel and Stango (2003) regarding state-imposed credit card interest rate ceilings. Of course, these patterns do not by themselves comprise definitive evidence of focal point pricing—such is the nature of implicit collusion—and in any event implicit collusion is difficult to prosecute under U.S.