Does the Financial Reporting
Transparency of Securitization Affect
Bank Lending Decisions?
by
Kaleab Yesuneh Mamo
A thesis
presented to the University of Waterloo in fulfillment of the
thesis requirement for the degree of Doctor of Philosophy
in Accounting
Waterloo, Ontario, Canada, 2018
c
Examining Committee Membership
The following served on the Examining Committee for this thesis. The decision of the Examining Committee is by majority vote.
External Examiner NAME Stephen G. Ryan
Title Professor of Accounting
Supervisor NAME Patricia O’Brien
Title Professor of Accounting
Internal Member NAME Christine Wiedman
Title Professor of Accounting
Internal Member NAME James R. Thompson
Title Associate Professor of Finance Internal-external Member NAME Matthew Doyle
Author’s Declaration
I hereby declare that I am the sole author of this thesis. This is a true copy of the thesis, including any required final revisions, as accepted by my examiners.
Abstract
This thesis examines the effect of financial reporting transparency for securitization on banks’ mortgage lending decisions. Prior research (e.g., Mian & Sufi 2009,Keys, Mukher-jee, Seru & Vig 2010) shows that securitization reduces banks’ incentives to screen and monitor borrowers. I posit that transparency plays a significant role by affecting bank stakeholders’ ability to monitor and discipline bank lending decisions. I identify three specific channels for monitoring and discipline, namely corporate governance, regulatory oversight, and market discipline by uninsured depositors. I hypothesize that transparency affects bank risk-taking in mortgage lending, and that monitoring and discipline from external stakeholders moderates this effect.
I test my hypotheses using difference-in-differences tests around five FASB pronounce-ments relating to securitization, issued since 1996, of which one decreases and the others increase transparency. I obtain loan-level data to construct new measures of bank risk-taking in mortgage lending based on the borrower income, loan amount and property location. I validate the proposed measures using bank-level future mortgage delinquencies and charge-offs.
The main results generally do not support my hypotheses. I find that, in most cases, the effect of transparency on risk-taking is either insignificant or in the opposite direction of the prediction. These findings are robust to multiple sensitivity tests. However, I find some evidence supporting my hypotheses when comparing bank lending decisions during the least transparent period to those during the most transparent period within my sample. As a whole, my findings support the null hypothesis that transparency does not affect banks’ risk-taking in their mortgage lending decisions. This conclusion is counter-intuitive and contrary to the commonly held view that transparency promotes better stakeholder monitoring of bank risk-taking. I identify alternative explanations for the null results, including: (i) whether the accounting pronouncements affect transparency as expected, (ii) the complexity of the setting, and (iii) potential noise in the data sources and the development of my measures.
This thesis contributes to the literature in multiple ways. The proposed risk-measures might prove useful to future researchers examining risk-taking in mortgage lending. My findings are also relevant to the branches of literature examining the effect of securitization on bank lending decisions, the effect of transparency on bank risk-taking, and the real effects of accounting standards. This thesis might also be useful to standard setters and regulators in their attempt to improve financial reporting quality and to promote better decision making.
Acknowledgements
First and foremost, I would like to extend my deepest gratitude to my advisor Prof. Patricia O’Brien for her invaluable guidance, support, and mentorship throughout my PhD. From the first year of my doctoral study, Pat has made herself generously available to read my work and to meet with me. Her penetrating questions and thoughtful feedback are irreplaceable. I have learned a great deal from her about research, teaching, and academic life in general. Thank you Pat! It has been a great honor and privilege to be your PhD student.
Besides my advisor, I would like to thank the other members of my thesis committee: Prof. Matthew Doyle, Prof. James Thompson, and Prof. Christine Wiedman, for their insightful and timely feedback that helped me improve my thesis. Their comments and encouragements were crucial in completing this thesis.
My sincere thanks also goes to Prof. Changling Chen for her encouragement, Prof. Sally Gunz for her help in understanding the institutional background for my research, Prof. Jeong-Bon Kim for his comments during the early stages of my thesis, Prof. Ken Klassen for his valuable comments on my thesis and my presentation skills, and Prof. Tony Wirjanto for his helpful comments about the research design.
I thank all faculty members and PhD students of the School of Accounting and Finance at the University of Waterloo for their helpful comments and encouragement during my PhD. I am particularly grateful to Prof. Alan Webb for his outstanding class on research methods.
This thesis has benefited from workshop presentation at Wilfrid Laurier University, conference presentation at the 2017 annual meeting of the Canadian Academic Account-ing Association, and positive feedback from an anonymous reviewer for the 2017 annual meeting of the American Accounting Association.
Table of Contents
List of Tables xiii
List of Figures xv
Abbreviations xvii
1 Introduction 1
2 Background and Hypothesis Development 9
2.1 Introduction . . . 9
2.2 Background . . . 9
2.2.1 Securitization . . . 9
2.2.2 Financial Reporting Transparency . . . 13
2.2.3 The Financial Reporting of Securitization . . . 14
2.3 Related Literature . . . 23
2.3.1 Transparency and Bank Operating Decisions . . . 24
2.3.2 Securitization and Lending Decisions . . . 27
2.4 Hypotheses Development . . . 27
2.4.1 Transparency and Securitization-driven Bank Risk-taking . . . 28
3 Research Design and Sample 35
3.1 Introduction . . . 35
3.2 Difference-in-Differences Design . . . 35
3.2.1 Securitization Indicator . . . 38
3.3 Data Sources . . . 38
3.3.1 The Home Mortgage Disclosure Act Database . . . 38
3.3.2 FR Y-9C Database . . . 39
3.3.3 Other Data Sources . . . 40
3.4 Sample Selection Procedure . . . 41
4 Mortgage Lending Risk Measures 47 4.1 Introduction . . . 47
4.2 Background . . . 48
4.3 Constructing Mortgage Lending Risk Measures . . . 50
4.3.1 Individual Mortgage Risk Characteristics . . . 51
4.3.2 Composite Risk Measures . . . 56
4.4 Descriptive Statistics . . . 57 4.5 Validation Tests . . . 58 4.5.1 Individual Characteristics . . . 61 4.5.2 BHC-level Measures . . . 66 4.6 Conclusion . . . 69 5 Empirical Analyses 73 5.1 Introduction . . . 73 5.2 Descriptive Statistics . . . 73
5.3 The Effect of Transparency on Bank Lending Decisions . . . 75
5.4 Moderators . . . 82
5.4.2 Regulatory Oversight . . . 89
5.4.3 Market Discipline . . . 93
5.5 Additional Analyses . . . 97
5.5.1 Alternative Test Windows . . . 97
5.5.2 Alternative Propensity Score Model Assumptions . . . 99
5.5.3 Alternative Definition of Composite Mortgage Risk Score . . . 102
5.5.4 Alternative Matching Method . . . 102
5.5.5 Alternative Research Designs . . . 106
5.5.6 Least-transparent Versus Most-transparent Periods . . . 115
5.6 Conclusion . . . 117
6 Large Securitizing BHCs 119 6.1 Introduction . . . 119
6.2 Background and Literature . . . 120
6.3 Analyses of Large BHCs . . . 124
6.3.1 Descriptive Statistics . . . 124
6.3.2 Mortgage Lending Around Standard Changes . . . 128
6.4 Conclusion . . . 135
7 Discussion and Conclusion 139 References 145 APPENDICES 155 A Variable Descriptions 157 A.1 Mortgage Lending Risk Measures . . . 157
A.2 Loan Portfolio Performance Measures and Other Variables . . . 160
C Propensity Score Matching 163
List of Tables
3.1 Summary of Sampling Procedure . . . 44
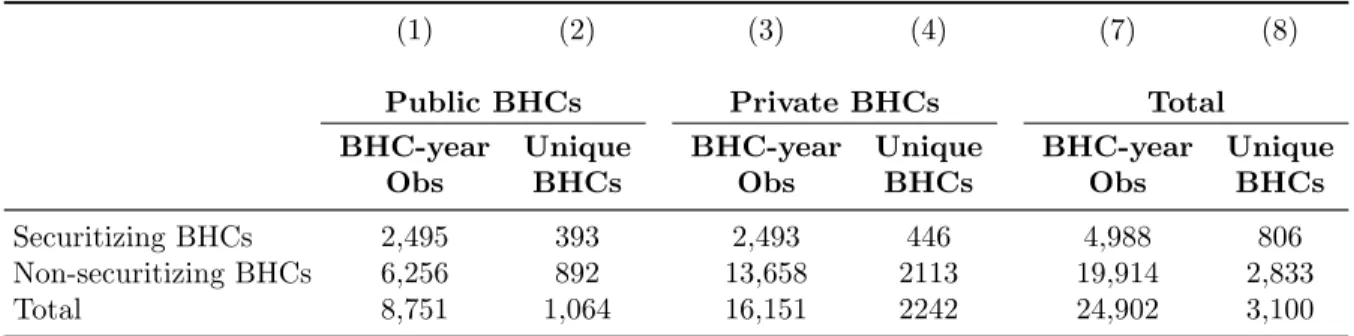
3.2 Sample Composition . . . 45
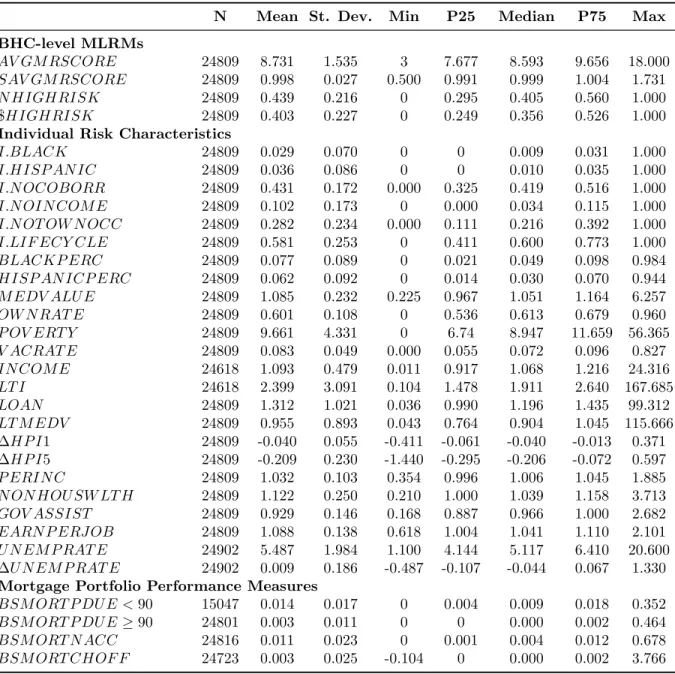
4.1 Descriptive Statistics . . . 59
4.2 Individual Mortgage Characteristics and On-Balance-Sheet Mortgage Port-folio Performance . . . 63
4.3 Individual Mortgage Characteristics and Mortgage Yield . . . 67
4.4 Mortgage Lending Risk Measures and Mortgage Portfolio Performance -Whole Sample . . . 70
4.5 Securitizing BHCs . . . 71
4.6 Non-Securitizing BHCs . . . 72
5.1 Descriptive Statistics . . . 74
5.2 The Effect of Transparency on Bank Lending Decisions . . . 78
5.3 Descriptive Statistics for Moderating Variables . . . 83
5.4 The Moderating Role of Manager-shareholder Alignment . . . 85
5.5 The Moderating Role of Regularity Oversight . . . 91
5.6 The Moderating Role of Market Discipline . . . 95
5.7 Alternative Test Windows . . . 98
5.8 Alternative Propensity Score Matching Assumptions . . . 101
5.9 Alternative Definition of Composite Mortgage Risk Score . . . 103
5.11 Alternative Research Design . . . 108
5.12 Least v. Most Transparent Periods . . . 116
6.1 Descriptive Statistics . . . 126
6.2 Transparency and Risk-taking by Top-five BHCs . . . 133
6.3 Transparency and Risk-taking by BHCs in the Top Securitization Decile . 136 C.1 Covariates Description . . . 166
C.2 Propensity Score Model . . . 168
List of Figures
1.1 Major Loan Types on U.S. Banks’ Balance Sheet . . . 3
1.2 Total Outstanding U.S. Single Family Mortgages. . . 4
1.3 Mortgage Securitization vs Total Securitization by BHCs . . . 5
2.1 Classical Banking Model . . . 11
2.2 Banking with Securitization . . . 13
2.3 Timeline of GAAP and Regulatory Changes . . . 17
3.1 HMDA Coverage . . . 39
6.1 Outstanding Securitized Mortgages . . . 121
6.2 The time series of mortgage lending risk . . . 129
List of Abbreviations
ABCP Asset-Backed Commercial Paper ABS Asset-Backed Securities
BEA Bureau of Economic Analysis
BHC Bank Holding Company
BLS Bureau of Labor Statistics
BS Balance Sheet
CEO Chief Executive Officer
CRA Community Reinvestment Act
CRSP Center for Research in Security Prices DELR Delay in Expected Loss Recognition DiD Difference-In-Differences
ECB European Central Bank
EU European Union
FAS Financial Accounting Standard
FASB Financial Accounting Standards Board
FFIEC Federal Financial Institutions Examination Council FHA Federal Housing Association
FHFA Federal Housing Finance Agency FIN FASB Interpretation Number FRT Financial Reporting Transparency FSA Farm Service Agency
GAAP Generally Accepted Accounting Principles GDP Gross Domestic Product
HMDA Home Mortgage Disclosure Act HUD Housing and Urban Development HPI House Price Index
IBES Institutional Brokers’ Estimate System LTV Loan-to-Value Ratio
MLRM Mortgage Lending Risk Measure MSA Metropolitan Statistical Area NPL Non-Performing Loans
NPV Net Present Value
QDiD Quasi Difference-In-Differences QSPE Qualified Special-Purpose Entity RHS Rural Housing Service
SME Small and Medium Enterprises
SFAS Statement of Financial Accounting Standard VA Veterans Association
Chapter 1
Introduction
The financial crisis of late 2000s has motivated an ongoing discussion about the effect of financial reporting transparency (FRT) on banks’ real operating and financing decisions, and on systemic stability. Morgan (2002),Nier & Baumann (2006), and Acharya & Ryan
(2016) argue that opacity can allow excessive bank risk-taking to go undetected, and that transparency can expose bank risk-taking to discipline from external parties.1 Prior
liter-ature (e.g., Bushman & Williams 2012, 2015) examines the effect of FRT on overall bank risk exposure, using market-based risk measures, which aggregate risk-taking from all oper-ating activities together with leverage, and other stock market and macroeconomic factors that may affect these market-based measures. However, these studies do not examine the effect of FRT on banks’ risk-taking in specific operating decisions, such as mortgage lend-ing, which is the focus of this thesis. Dou, Ryan & Xie (2018) examine mortgage lending decision around FAS 166 & 167, and they find that banks that recognize more securitized assets following FAS 166 & 167 exhibit larger decreases in mortgage approval rates and larger increases in mortgage sale rates. UnlikeDou et al.(2018), I examine the risk profile of mortgages originated or purchased by banks.
The role of securitization in the financial crisis is a significant part of the discussion about transparency and bank risk-taking. Prior literature (e.g.,Pennacchi 1988,Gorton & Pennacchi 1995, Loutskina & Strahan 2009) argues that securitization can reduce banks’ incentives to screen and monitor borrowers by enabling them to transfer loans to investors thereby reducing their exposure to the risk of these loans they originate. Consistent with this theory, Mian & Sufi (2009), Keys et al. (2010), and Wang & Xia (2014) find that,
1See Beatty & Liao (2014) and Acharya & Ryan (2016) for more discussion about the role of trans-parency in the banking sector.
in the pre-crisis period, banks decreased their lending standards more for loans that were easier to securitize. This literature, however, focuses on the general association between securitization and bank lending decisions, taking the FRT of securitization as a given. Despite the widely held view that opacity was to blame for the role of securitization in the crisis (e.g.,Kiff, Jobst, Scarlata & Kisser 2009), prior literature does not directly examine the role of transparency in this setting.
This thesis explores the role of securitization transparency, as opposed to the secu-ritization activity, on banks’ risk-taking in their mortgage lending decisions. I investi-gate whether and how FRT for securitization (hereafter, transparency) affects securitizing banks’ risk-taking in their residential mortgage lending decisions (hereafter, risk-taking). I examine residential mortgage securitizations because: (i) residential mortgages make up a large portion of bank loans throughout my sample period (see Figure 1.1), (ii) residential mortgages are a significant component of the overall U.S. economy (see Figure 1.2), and (iii) residential mortgage securitizations make up a large portion of banks’ securitization activity (see Figure1.3). Moreover, I can identify the origination year for residential mort-gages, which is crucial to my research design that depends on measuring risk in terms of lending decisions before and after transparency shocks.
Figure 1.1: Major Loan Types on U.S. Banks’ Balance Sheet
This figure presents different types of loans on U.S. commercial banks’ balance sheet as a percentage of total loans for the period 2004-2012. The black broken line shows the percentage of residential mortgages, which is the largest loan group on banks’ balance sheet. The other lines represent commercial real estate loans, commercial loans, consumer loans, and other loans and leases. The data are from the Federal Reserve website
Figure 1.2: Total Outstanding U.S. Single Family Mortgages
This figure shows the outstanding US residential mortgages backed by single-family property (black solid line) and US GDP (red dashed line) for the period 1994-2015.
FollowingBarth & Schipper (2008), I define transparency as the extent to which finan-cial reports reveal the underlying economics of securitization in an understandable way. By revealing the underlying economics of securitization, transparency allows bank stake-holders to observe assets the securitizing bank controls, liabilities it has incurred, and risks it faces due to retained interests in the securitization.2 This allows stakeholders to
mon-itor banks’ exposure to the risk of securitized loans, and to discipline risk-taking that is not aligned with their preferences. I hypothesize that greater transparency affects risk-taking through three channels for monitoring and discipline, namely market discipline by uninsured creditors,regulatory oversight, and corporate governance (i.e., shareholder disci-pline). Transparency may fail to affect risk-taking if securitization transfers substantially all the risks to investors. Accounting standards that attempt to improve transparency may fail to do so, if banks restructure securitization transactions to subvert new reporting requirements, as Bens & Monahan (2008) document for asset-backed commercial paper. To test the above-hypothesized channels, I investigate whether transparency has a larger
effect for banks withweak corporate governance, banks with low regulatory capital ratios, and banks with more uninsured depositors.
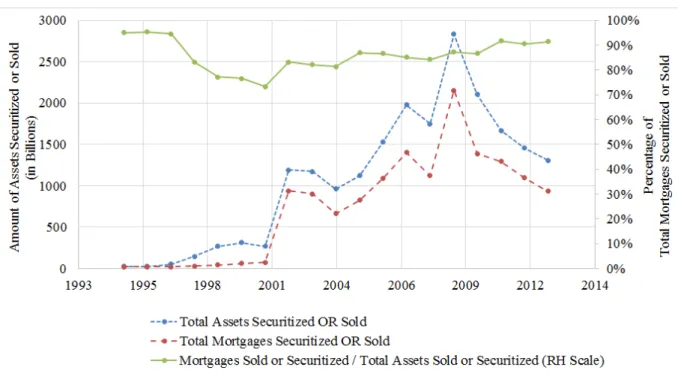
Figure 1.3: Mortgage Securitization vs Total Securitization by BHCs
This figure presents the amounts of BHCs mortgage securitizations relative to their total securitizations. The dollar amounts of “total assets securitized or sold” and “total
mortgages securitized or sold” are presented on the left-hand side scale. The scale on the right-hand side corresponds to the percentage of “total mortgages securitized or sold” relative to “total assets securitized or sold”.
I obtain a sample of securitizing bank holding companies (BHCs) from the Federal Reserve’s FR Y-9C database for the period 1996-2015. I focus on BHCs because consoli-dation at this level ensures proper aggregation of all securitization and mortgage-banking activities, which are often conducted by different subsidiaries. I propose four new mort-gage lending risk measures (MLRMs) at the BHC-year level, which I develop based on mortgage-level and local area characteristics for mortgages approved by the BHCs in a given year.
I obtain mortgage application-level data from the Home Mortgage Disclosure Act (HMDA) database, and combine it with location-specific socioeconomic information from
a variety of other U.S. government sources to create a mortgage-level risk score.3 I identify
24 different characteristics, such as borrower income, the ratio of borrower income to the amount of the loan, and the local area unemployment rate, that can reflect the riskiness of individual mortgages. I add them to create a composite risk score (M RSCORE) for each mortgage.
I validate the mortgage lending risk measures including all the 24 individual compo-nents, using BHC-level mortgage portfolio outcome measures such as delinquencies and charge-offs. I also show that most of the 24 individual component characteristics used to create the composite measures are positively associated with mortgage delinquencies and charge-offs in future years, and that they are associated positively with mortgage yield.
I then examine changes in lending decisions by securitizing BHCs around significant transparency shocks caused by five securitization accounting pronouncements (hereafter, the pronouncements or the standards).4 I argue that the first pronouncement decreases
transparency and the other four increase transparency. The pronouncements affect trans-parency because they determine: (i) accounting policies such as the sales treatment of securitization and the measurement of retained interests, or (ii) disclosure requirements re-lated to securitization activity. The use of five accounting standard changes issued at four different times mitigates the concern that factors other than the transparency shocks drive the results, and allows me to provide more comprehensive evidence. I identify securitizing BHCs as those with outstanding amounts of assets securitized or sold with recourse.5 I use
a propensity-score matched sample of non-securitizing BHCs to control for size and other factors (e.g., industry and macroeconomic) that can affect lending decisions. The match-ing alleviates concerns that endogenous factors that affect the decision to securitize drive the risk-taking differences between treatment and control BHCs. I also perform additional analyses using coarsened exact matching based on the three most important covariates in the propensity score model, to ensure that my results are not driven by a specific matching method.
The results generally do not support my hypothesis that transparency affects bank risk-taking in mortgage lending. Except in a few cases, all the estimated effects are either
3Census data are available at the census tract level. The U.S. Census Bureau defines census tracts as “small, relatively permanent statistical subdivisions of a county”, with “an optimum size of 4,000 people”. More information can be found athttps://www.census.gov/geo/reference/gtc/gtc_ct.htmlPersonal income and unemployment data are available from the Bureau of Economic Analysis and the Bureau of Labor statistics at the county level, respectively. House price indexes are available from the Federal Housing Finance Agency at the metropolitan statistical area-level.
4FAS 125 (1996), FAS 140 (2000), FIN 46(R) (2003), FAS 166 (2009), and FAS 167 (2009)
5Prior to 2001Q2, FR Y-9C filings did not distinguish between securitized assets and assets sold with recourse. They simply reported the combined outstanding amount.
indistinguishable from zero or go in the opposite direction of the predictions. This finding, which is robust to various sensitivity tests discussed in detail in chapter 5, suggests that transparency as defined in this thesis does not affect bank lending decisions in the predicted manner. However, it is also possible that the null results are driven by measurement error in the proposed mortgage lending risk measures, or weakness in the research design’s ability to identify the hypothesized relationships. I discuss potential ways to address these issues in chapters 5 and 7.
The remainder of this thesis is organized as follows. Chapter2discusses the institutional background, reviews related literature, and develops the hypotheses. Chapter 3 describes the data sources, sampling procedure, and the research design. Chapter 4 develops and validates the proposed mortgage lending risk measures. Chapter 5 presents the empirical results. Chapter 6 discusses five large securitizing BHCs excluded from the main sample. Chapter 7concludes the thesis.
Chapter 2
Background and Hypothesis
Development
2.1
Introduction
This chapter provides a discussion of the institutional and financial reporting environment of securitization, a review of related literature, and the hypotheses development. The first part of section2.2discusses the structure of securitization, comparing the classical banking model (Diamond 1984) and banking with securitization. The second part of section 2.2
formally defines financial reporting transparency of securitization. The last part of section
2.2 discusses the financial reporting of securitization per GAAP and regulatory reporting requirements. I present the evolution of GAAP and regulatory reporting since the early 1990’s. Section 2.3 presents a review the related literature. Finally, section 2.4 presents the hypotheses development.
2.2
Background
2.2.1
Securitization
2.2.1.1 Classical Banking
In the classical banking model without securitization, illustrated in Figure2.1, banks act as financial intermediaries between many dispersed lenders (primarily depositors) and
bor-rowers. These parties cannot interact directly because of transaction costs and information asymmetries (Diamond 1984, Boyd & Prescott 1986).1 Information asymmetries between lenders and borrowers can arise both before the origination of loans (i.e., adverse selection) and after the origination of loans (i.e., moral hazard). Diamond (1984) shows that unco-ordinated screening and monitoring by a large group of individual lenders can be costly due to duplication of efforts. It can also result in a free rider problem where no individual lender screens and monitors borrowers because their share of the benefits is too small.
Banks can solve the information asymmetry and coordination problems by screening and monitoring borrowers on lenders’ behalf. However, Leland & Pyle (1977) argue that banks cannot simply act as information intermediaries that sell information about borrower creditworthiness, because users who cannot distinguish between good and bad information would not buy. Thus, banks act as financial intermediaries that collect deposits (i.e., borrow from depositors) and lend to borrowers, creating and holding illiquid loans. In this case, banks are exposed to the risks in the loans that they originate, and thus have an incentive to avoid excessive risk by screening and monitoring borrowers.
Bank stakeholders monitor banks’ overall loan performance instead of the individual borrowers. Shareholders can align bank risk-taking behavior with their risk preferences through corporate governance. Uninsured creditors, who wish to protect their investment in banks’ liabilities, can “‘punish’ banks for greater risk-taking by demanding higher yields on those liabilities” (Nier & Baumann 2006, p. 333), or in the case of uninsured depositors, by withdrawing or withholding their deposits.2 Regulators can use bank inspections and
regulatory constraints to minimize the likelihood of both individual bank and systemic failures.
1I focus on the information asymmetry problem because it is more relevant to this thesis.
2Prior researchMerton(1977),Holod & Peek(2007) shows that deposit insurance significantly reduces insured depositors’ incentive to monitor banks.
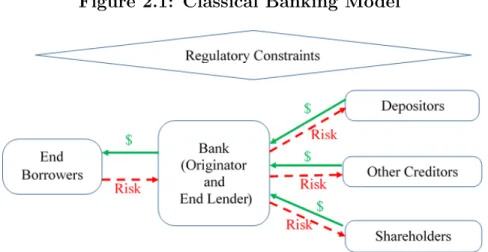
Figure 2.1: Classical Banking Model
This figure presents a graphical depiction of the classical banking model (Diamond 1984). In this model, banks acts as a financial intermediary between depositors and borrowers by financing loans through deposits. In this process, banks are typically the end lenders and they hold the loans they originate until maturity. Other Bank stakeholders include shareholders, other creditors (e.g., bondholders) and bank regulators.
2.2.1.2 Banking with Securitization
Securitization changes the traditional banking model by providing banks with an additional avenue for financing their lending activities. While there are many types of securitization structures with varying degrees of complexity, I focus on a basic form of securitization to emphasize the major differences with the classical banking model. A typical securitization allows banks to convert less liquid loans into more liquid asset-backed securities (ABS) that can more easily be sold to investors. As shown in figure 2.2, a bank transfers a pool of loans to a securitization entity, which issues securities backed by the loans received from the bank. The proceeds from ABS sales are then transferred to the originating bank.
In principle, securitization allows banks to transfer risk to investors, who would become the effective end lenders that collectively hold the loans on their balance sheet.3 Prior literature Greenbaum & Thakor (1987), Pennacchi (1988), Barth, Ormazabal & Taylor
(2012) suggests that risk transfer is among the primary motivations for securitization. In this case, banks have less incentive to screen and monitor borrowers because they no
3In some cases, banks securitize loans and hold all or a significant portion of the resulting ABS on their balance sheet under assets held for sale, thus swapping loans for ABS on their balance sheets. This practice can provide banks with more financial flexibility as ABS are easier to sell than the underlying loans.
longer hold the risk of the loans they originate. Cortes & Thakor (2015) argue that securitizations that transfer risk to outsiders reduce the benefits to banks of borrower screening and monitoring, without reducing the costs. For similar reasons, stakeholders’ incentives to monitor and discipline bank lending decisions decreases when they believe that banks transfer risk through securitization.
However, securitizations are complex and opaque transactions that do not necessarily transfer all risks and rewards to ABS investors. Securitizing banks often retain signifi-cant interests in securitized loans. Common types of retained interests include servicing rights, recourse obligations, and liquidity and credit guarantees for securitization entities. Transparency can increase stakeholders’ ability to observe the extent of risk transferred through securitization (i.e., where the underlying risk of securitized loans lies, within the gray shaded area in figure 2.2). If the risk transfer is not observable, stakeholders cannot effectively monitor and discipline bank risk-taking, which in turn affects banks’ risk-taking incentives in securitizable loans.
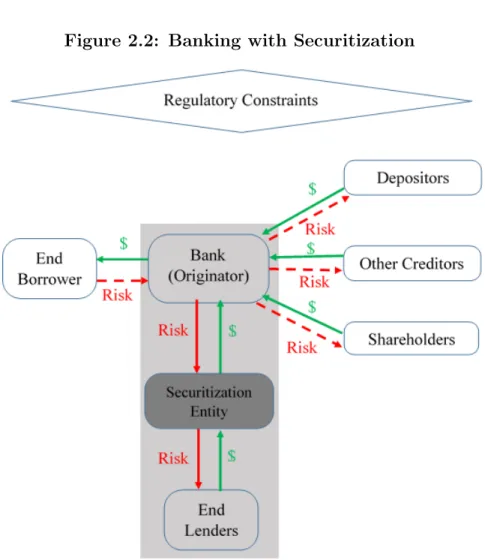
Figure 2.2: Banking with Securitization
This figure presents a graphical depiction of banking with securitization. Securitization provides banks with an alternative way to fund loans, represented by the shaded area. Banks can transfer the loans they originate to third parties by selling or securitizing. Banks are no longer the end lenders if they transfer the loans to outsiders without recourse.
2.2.2
Financial Reporting Transparency
Accounting policy choices, measurement principles, and additional disclosures are among the primary determinants of transparency. For instance, accounting policies that allow derecognition of securitized assets while the transferor retains significant interest in the assets, or prohibit derecognition when the assets are transferred, reduce financial reports’
ability to reveal underlying economics.4 Securitized assets are derecognized and
securiti-zation income is recognized, if the transaction qualifies for sales treatment and the utility is not consolidated.5 If the transaction does not qualify for sales treatment or the utility
is consolidated, the securitized assets remain on the balance sheet and the proceeds from the transaction are recognized as a liability.
Measurement principles can affect transparency because they determine the accuracy of reported values. For instance, measurement of retained interests affects the allocation of carrying value between the transferred and retained part of the securitized pool, and there-fore can affect securitization gain or loss. Additional disclosures about specific accounting policies, assumptions, and estimates used in accounting for securitization can affect both revelation of underlying economics, and understandability.
Financial reports without adequate supplemental disclosure, even when they apply appropriate accounting policies and measurement methods, cannot communicate the un-derlying economics in an understandable way.
2.2.3
The Financial Reporting of Securitization
Accounting standards and regulatory disclosure requirements shape accounting policies, measurement principles, and disclosure by financial institutions. Generally Accepted Ac-counting Principles (GAAP) and regulatory disclosure for securitization have evolved sig-nificantly over the last couple of decades. Figure 2.3 presents the timeline of GAAP and regulatory accounting changes for securitizations considered in this thesis.
Over the last 25 years, the Financial Accounting Standards Board (FASB) issued five major pronouncements relating to securitization, namely SFAS No, 125 (1996), SFAS No. 140 (2000), FIN 46 (R) (2003), SFAS No. 166 (2009), and SFAS No. 167 (2009). FASB issued the accounting pronouncements to enhance transparency through their effect on accounting policies, measurement principles, and disclosure. For instance, in the statements of the standards, FASB emphasizes its aim to ensure that each party to the transaction recognizes assets it controls and liabilities it has incurred, and derecognizes assets only when control has been surrendered and liabilities only when they have been extinguished.6
The standards can also influence transparency through their impacts on regulatory reports (e.g., FR Y-9C) and on regulatory capital ratios such as Tier 1 leverage, Tier 1
4Schipper & Yohn(2007) identify the derecognition of securitized assets as the primary securitization accounting policy issue.
5FAS 125, FAS 140, and FAS 166 describe the criteria for sales treatment of securitization transactions. 6SFAS No. 125 (1996, par.6), SFAS No. 140 (2000, par.5), and SFAS No. 166 (2009, par.5)
capital, and total risk capital ratios.7 Regulatory accounting and disclosure requirements
for securitization also changed significantly over the same period, with major expansions in disclosure requirements in 2001 and 2010. These expansions in regulatory disclosure mirror expansions in GAAP disclosure requirements, generally with lag. While regulatory filings contain more standardized (and more disaggregated prior to FAS 166 & 167) financial information than GAAP reports, they are typically prepared per GAAP.8 For instance,
off-balance-sheet treatment for securitizations and recognition of securitization income in regulatory filings typically follow GAAP. Recognizing securitization income in Tier 1 capital increases the numerator of Tier 1 leverage, Tier 1 capital, and total risk capital ratios. Increasing regulatory capital ratios, when banks retain significant interest in securitized assets, fails to reveal the underlying economics. Off-balance sheet treatment can increase Tier 1 capital and total risk capital ratios because the risk-weighted total amount of the off-balance-sheet assets can be lower than the risk-weighted total amount the underlying loans had they not been securitized, decreasing the denominator.9 Off-balance sheet treatment also increases the Tier 1 leverage ratio because off-balance-sheet assets are not included in the denominator (average total assets).
In addition to containing more disaggregated information than GAAP reports, reg-ulatory reports provide information that is not required by GAAP. In the 1990s, Y-9C filings contained the outstanding amount of assets sold with recourse, which includes se-curitized assets that are treated as sales per GAAP. Regulatory reports also contain the maximum contractual value of recourse, which is used instead of fair values in calculating risk-weighted assets.
This thesis focuses on FASB pronouncements that affect BHC-level financial reports, i.e., the bank’s (originator’s) financial reports in 2.2. I do not examine the effect of in-formation environment in ABS markets, i.e., the transparency of securitization utilities to investors (the end lenders in figure 2.2) on bank lending decisions as I believe this is a
7See appendix A.2for definitions of regulatory capital ratios.
8Acharya & Ryan (2016) state that “Although banks appear to respond more to regulatory capital requirements than to financial reporting standards, regulatory reporting and thus capital requirements often are based on financial reporting standards.” (p.322)
9The Risk-based Capital Guidelines published on November 29, 2001 state that “Highly rated investment-grade positions in securitizations receive a favorable (less than 100 percent) risk-weight. Below-investment-grade or unrated positions in securitizations would receive a less favorable risk-weight (generally greater than 100 percent risk-weight). A residual interest retained by a banking organization in an as-set securitization (other than a credit-enhancing I/O strip) would be subject to this capital framework. Therefore, if the external rating provided to such a residual interest is investment grade or no more than one category below investment grade, the final rule affords that residual interest more favorable capital treatment than the dollar-for-dollar capital requirement otherwise required for residuals.”(p.59619)
closely related but separate research question. Regulation AB, which was effective in 2006, enhances transparency in ABS markets by requiring periodic pool-level performance dis-closures by SEC-registered ABS. I do not expect Reg AB to confound my analyses because it does not fall in any of the test periods around the standards.
The remainder of this subsection discusses the major securitization accounting stan-dards, their effect on transparency, and instances where GAAP and regulatory accounting differ. In the discussion below, I focus on reporting standards that apply to securitization of residential mortgages.
Figure 2.3: Timeline of GAAP and Regulatory Changes
This figure presents a simplified timeline of U.S. GAAP and regulatory accounting changes relating to securitization over the period 1994-2012. Lighter shades represent more transparency.
* While I focus on the elements of the standards that apply to securitization of residential mortgages, the standards apply for all types of transfers of financial assets.
** Regulatory disclosures increase in various ways after the crisis. Most of these changes, mandated by the Dodd-Frank Act, did not become effective in my test window around FAS 166 & 167.
2.2.3.1 Pre-FAS 125
Accounting standards prior to FAS 125 in 1996 followed an all-or-nothing approach to securitization accounting. This approach treated financial assets as indivisible units, and it relied on the legal form and predominant characteristics of the transaction to determine sales treatment for securitizations. FAS 125, in its description of pre-FAS 125 practice, states that “For example, whether a transfer “purported to be a sale” was sufficient to determine whether the transfer was accounted for and reported as a sale of receivables under one accounting standard or as a secured borrowing under another.” (FAS 125 par.5). If the transaction purports to be a sale, the securitization is treated as a sale if it meets the conditions in FAS 77.10 FAS 77 addressed neither the consolidation of securitization entities nor retained interests other than recourse obligations and servicing rights.11 A securitization is treated as a secured loan if the transaction does not meet FAS
77 requirements, or if it purports to be a loan, in which case Bulletin No. 85-2 applies.12 When a securitization is treated as a sale and the securitization entity is not consoli-dated, the associated gain or loss is recognized in net income. Kane (1995) reports that regulatory accounting diverged from GAAP by allowing securitization income in Tier 1 capital only for securitizations with no recourse. Kane(1995, 1997) argues that the all-or-nothing approach can lead to opacity because: (i) banks can easily manipulate the legal form of securitization to fit the desired accounting, and (ii) because they are not required to recognize all assets and liabilities created as a result of securitization. To justify FAS 125, FASB states that previous approaches were difficult to apply and produced inconsis-tent and arbitrary results (FAS 125, par.7) and do not provide an appropriate basis for developing consistent and operational standards (FAS 125, par.8).
2.2.3.2 FAS 125
FASB issued FAS 125 in 1996 to improve the accounting for transfer of financial assets by eliminating inconsistencies and confusions that resulted from previous standards and accounting practice (FAS 125 par.97). In FAS 125, FASB concluded that an objective of
10FAS 77 deals with transferors’ accounting for transfers of receivables with recourse. A transfer is treated as a sale if (i) the transferor surrenders control of the assets (i.e., no option to repurchase), (ii) the recourse to the transferor can be reasonably estimated, and (iii) the transferee cannot require the transferor to repurchase the assets except through recourse provisions (FAS 77, par.5).
11The consolidation of securitization entities was covered by existing standards for consolidated financial statements, ARB No. 51 (1959) as amended by FAS 94 (1987).
securitization accounting is for each party to the transaction “to recognize only assets it controls and liabilities it has incurred, to derecognize assets only when control has been surrendered, and to derecognize liabilities only when they have been extinguished.” (FAS 125 par.5). This is consistent with enhancing transparency by revealing the underlying economics of the securitization transactions.
The following are the main elements of FAS 125. First, it introduced the financial-components approach in which the transferor decomposes securitized assets into multiple asset and liability components (e.g., interest-only strips, servicing rights, and letters of credit), and accounts separately for each component. Second, it provided control-based qualification criteria for sales treatment of securitization transactions. Sales treatment ap-plies per FAS 125 if the transferor surrenders control over the securitized assets.13 Third, FAS 125 created a special class of securitization entities, qualifying special purpose entities (QSPEs) that are exempt from consolidation. QSPEs are passive entities that are demon-strably distinct from the transferor and that can only engage in a predetermined set of activities. While FAS 125 is generally silent about the consolidation of securitization enti-ties, the Emerging Issues Task Force (EITF) reached a consensus that FAS 125’s definition of control should be applied in assessing consolidation of QSPEs, allowing transferors to avoid consolidation of QSPE.14
When a securitization is treated as a sale and the conduit is not consolidated, the orig-inal assets are derecognized, and all assets obtained and liabilities incurred in association with the securitization are recognized. The carrying amount of the original assets is al-located between the sold and retained components based on their fair value proportions, and the difference between the proceeds and the carrying amount allocated to the sold part is recognized as a gain or loss on the income statement. The retained components are initially recognized at their fair value, if a reasonable measurement is possible. If it is not practicable to estimate the fair values of retained assets and liabilities, the assets are recorded at zero, and the liabilities at the greater of (i) the net fair value of other assets obtained and liabilities incurred less the carrying amount of the transferred assets, and (ii) the amount that would be recognized per FAS 5 “Accounting for Contingencies” as interpreted by FIN 14 “Reasonable Estimation of the Amount of Loss”. FAS 5 requires recognition of estimated loss from loss contingencies when it is probable that an asset had been impaired or a liability had been incurred and the loss can be reasonably estimated.
13The transferor surrenders control if (i) the assets are isolated from the transferor even in bankruptcy, (ii) the transferee has the right to pledge or exchange the assets, and (iii) the transferor does not maintain effective control over the securitized assets through arrangements other than cleanup calls.
14EITF Issue No. 96-20 “Impact of FASB Statement No. 125 on Consolidation of Special-Purpose Entities.” was issued only three months after FAS 125.
FIN 14 deals with cases where only a range of loss can be reasonably estimated. In this case, “When some amount within the range appears at the time to be a better estimate than any other amount within the range, that amount shall be accrued. When no amount within the range is a better estimate than any other amount, however, the minimum amount in the range shall be accrued.”(FIN 14, par. 3)
In contrast to the pre-FAS 125 era, beginning with the adoption of FAS 125, regulators included securitization income in Tier 1 capital regardless of recourse to the transferor. Regulators discontinued this practice later and prohibited large or internationally active BHCs (i.e., those following the Basel II Advanced Capital Adequacy Framework) from including non-cash securitization gains in Tier 1 capital in 2008, and all other BHCs with at least $500 million in total assets in 2014.15
In principle, FAS 125 can enhance transparency by allowing securitizing entities to recognize only assets they control and liabilities they have incurred and not extinguished. Securitizations are typically complex transactions that do not fit the all-or-nothing ap-proach, as a portion of the risk in the underlying loans is transferred while the rest is retained by the transferor. The financial-components approach would ideally allow the transferor to account separately for the transferred and retained parts, derecognizing the transferred assets, retaining on its balance sheet only the assets it still controls, and recog-nizing only the liabilities it has incurred. However, due to the complexity of securitizations, it can be difficult to reliably measure the distinct components, and to provide sufficient disclosure that enables external stakeholder to understand and value the components.
FAS 125 and the financial-components approach can increase opacity for several reasons. First, asO’Brien(2011) argues, the underlying risk in securitized assets (e.g., mortgages) is not separable, so creating synthetic components that are accounted for separately obscures the underlying economics. Second, measurement errors or biases in fair-valuing retained interests can obscure the transferor’s true exposure to the securitized assets and misrepre-sent the securitization gain. This approach is susceptible to measurement errors and biases because retained interests are not tradable (O’Brien 2011), which necessitates reliance on discretionary non-market inputs. Last, while purporting to be a sale is no longer sufficient,
15The “Risk-Based Capital Standards: Advanced Capital Adequacy FrameworkBasel II; Final Rule” published in 2007 and effective in April 2008 states that “Under the proposed rule, a bank would deduct from tier 1 capital any after-tax gain-on-sale. Gain-on-sale was defined as an increase in a bank’s equity capital that resulted from a securitization, other than an increase in equity capital that resulted from the bank’s receipt of cash in connection with the securitization.” The “Regulatory Capital Rules: Regulatory Capital, Implementation of Basel III, Capital Adequacy, Transition Provisions, Prompt Corrective Action, Standardized Approach for Risk-weighted Assets, Market Discipline and Disclosure Requirements, Ad-vanced Approaches Risk-Based Capital Rule, and Market Risk Capital Rule” published in 2013 contains a similar provision.
legal form remains a key element in determining sales treatment. For example, QSPEs are immune from consolidation. Banks can manipulate the legal form and structure of securi-tization transactions to fit their desired accounting outcome, while maintaining significant interest that exposes them to significant risk if the QSPE is in trouble. As discussed in the previous paragraph, the financial-components approach can, in ideal cases, lead to greater transparency than the all-or-nothing approach. However, I argue that the accounting and disclosure practice established by FAS 125 were less than ideal.16
While no prior research systematically examines the transparency effects of FAS 125, a stream of literature provides evidence that suggests the major elements of FAS 125 reduce transparency. Niu & Richardson(2006),Landsman, Peasnell & Shakespeare(2008),Barth et al.(2012), andDou, Liu, Richardson & Vyas(2014) show that equity and bond markets on average treat securitizations as if they were secured loans, suggesting that investors believe the sales treatment is not consistent with the underlying economics.17 Hence,
stan-dards that allow sales treatment of securitization instead of secured loan treatment may reduce transparency. Karaoglu (2005), Dechow & Shakespeare (2009), Dechow, Myers & Shakespeare(2010), andAcharya, Schnabl & Suarez(2013) show that banks use securitiza-tions to manipulate earnings and regulatory capital, again suggesting that the accounting does not mirror the underlying economics.
2.2.3.3 FAS 140
FAS 140, issued in 2000, carries forward most elements of FAS 125 with the following ex-ceptions. First, FAS 140 strengthened qualification requirements for QSPEs by restricting the activities they conduct, financial assets they hold, and the type and timing of asset sales. Second, FAS 140 prohibited the consolidation of QSPEs. Third, FAS 140 required more disclosure including: (i) the characteristics of securitizations, (ii) accounting policies and key assumptions in measuring retained interests, (iii) sensitivity analyses for fair val-ues of retained interests, (iv) cash flows between the conduit and the transferor, and (v) total principal amounts, delinquencies, and credit losses for outstanding securitized assets. This expansion in disclosure requirements was followed by a similar increase in regulatory disclosure requirements with a one quarter lag.
16I leave for future researchers the question of whether the financial components approach dominates the all-or-nothing approach under an ideal disclosure regime for both approaches.
17Chen, Liu & Ryan (2008) find that the relation between securitizing banks’ equity risk and their securitized assets depends on the type of securitization. For example, the relation is strong when the securitized loans have higher or less externally verifiable credit risk.
FAS 140 can enhance transparency because it requires extensive disclosure, and because it tightens the qualification criteria for QSPEs, which can reduce their use for purely accounting purposes. However, FAS 140 carries over the financial-components approach and the QSPE concept from FAS 125, and it prohibits consolidation of QSPEs. Thus, FAS 140’s overall effect on transparency depends on the extent to which the expanded disclosures and tightening of QSPE qualification, in practice, offset the transparency-decreasing effects of the financial-components approach and non-consolidation of QSPEs.
2.2.3.4 FIN 46 (R)
Prior to FIN 46 (R) in 2003, variable interest entities (VIEs) were effectively consolidated by the entity that held the majority ofvoting rights.18 Under FIN 46 (R), a VIE is consolidated by the primary beneficiary, the entity holding the majority of the VIE’sexpected losses or rewards. FIN 46 (R) expanded disclosure requirements for parties involved in a VIE. It required the primary beneficiary of a VIE to disclose: (i) the nature, size, purpose, and activities of the VIE, (ii) the carrying amount and classification of consolidated assets used as collateral for the VIE’s obligations, and (iii) lack of recourse if the primary beneficiary has no recourse obligations to other parties in association with the VIE.19FIN 46 (R) also required a party that holds a significant interest in a VIE but is not the primary beneficiary to disclose item (i) above, the nature and timing of its involvement in the VIE, and the maximum exposure to the loss of the VIE.
FIN 46 (R) can enhance transparency if the expected risk and rewards approach to VIE consolidation better reflects underlying economics than the voting rights approach. For example, consolidation of a VIE based on voting rights would not reveal the underlying economics if the voting and cash flow rights are separate, or if the VIE has no voting class. Consolidation of VIEs per FIN 46 (R) can also affect transparency through regulatory cap-ital because it increases the risk-weighted capcap-ital base of the entity exposed to the majority of the expected risks. The enhanced VIE disclosures would improve transparency by pro-viding more information about the extent of risk exposure by the parties with significant involvement in a VIE.
However, FIN 46 (R) may fail to enhance transparency. Bens & Monahan(2008) show that some U.S. banks, especially those with binding regulatory constraints, structured transactions to avoid consolidation of asset-backed commercial paper (ABCP) conduits per FIN 46 (R). Bank regulators exempted consolidated ABCP conduits from inclusion in
18FIN 46 (R) section “Reasons for Issuing This Interpretation’, p.3, par.1. 19FIN 46 (R) par.23
the risk-weighted asset base (ABCP exclusion) seven months after FIN 46 (R) was effective. Banks retaining substantial risks in ABCP conduits continued to avoid consolidation of these conduits and to exclude the conduits from risk-based capital ratios, so the accounting did not reflect the underlying economics. Hence, the ultimate effect of FIN 46 (R) on transparency is uncertain. On balance, I conjecture that FIN 46 (R) enhances transparency for mortgage-related securitizations because: (i) the evidence suggests that transaction restructuring was concentrated among banks with binding regulatory constraints, (ii) the regulatory exception is only for ABCP conduits, not for all securitization entities, and (iii) the regulatory exception did not allow exclusion of ABCP conduits from the Tier 1 leverage ratio.
2.2.3.5 FAS 166 and FAS 167
FAS 166 and FAS 167, issued in 2009, represent the most extensive changes to securitization accounting. These standards eliminate the QSPE concept, thereby require existing QSPEs be considered for consolidation, tighten the criteria for determining the primary beneficiary of a VIE, and enhance required disclosures regarding securitization activities. Under FAS 166 & 167, the primary beneficiary of a VIE is the entity with (i) the power to direct the VIE’s activities that most significantly impact the VIE’s economic performance, and (ii) the obligation to absorb significant losses of the VIE or the right to receive significant benefits from the VIE. Unlike FIN 46 (R), there is no requirement to hold the majority of expected risks and rewards of the VIE.
FAS 166 & 167 can enhance transparency by tightening the criteria for off-balance-sheet treatment of securitizations and by requiring additional disclosures. Moreover, similar disclosure requirements in regulatory filings followed within a year. Following FAS 166 & 167, regulators also eliminated the ABCP exclusion established in response to FIN 46 (R), limiting banks’ ability to bolster their regulatory capital ratios through securitization. Supporting the claim that FAS 166 & 167 enhance transparency, Oz (2016) shows that information asymmetry, as measured by bid-ask spread, declines more for securitizing banks than non-securitizing banks after the adoption of FAS 166 & 167.
2.3
Related Literature
This section discusses two streams of literature related to my thesis. The first stream ex-amines the effects of accounting standards and transparency on banks’ operating decisions,
and the second stream deals with the effects of securitization on banks’ lending decisions. I discuss the contribution of my thesis relative to these two streams of literature.
2.3.1
Transparency and Bank Operating Decisions
My thesis is closely related to the growing stream of literature examining the real effects of accounting policies and disclosure on banks’ operating decisions (e.g.,Bushman & Williams 2012, 2015, Xie 2016, Dou 2017, Ertan, Loumioti & WITTENBERG-MOERMAN 2017,
Dou et al. 2018, Neilson, Ryan, Wang & Xie 2018, Schmidt & Zhang 2018). Of these studies, Ertan et al.’s (2017) study examining the effect transparency on loan quality is the most closely related to my thesis. Ertan et al.(2017) exploit new reporting standards introduced by the European Central Bank (ECB) in 2013. Under the new reporting regime, banks that use ABS as collateral to borrow from the ECB are required: (i) to disclose the structure of ABS used as collateral, and (ii) to collect and disclose detailed loan- and borrower-specific information for loans backing the ABS.Ertan et al. (2017) use loan-level data on securitized loans to SMEs (small and medium-sized enterprises) that are reported under the new ECB requirement and find that greater loan-level disclosure increases loan quality.
This thesis differs from Ertan et al. (2017) in the following ways. First, my thesis examines a related but distinct type of transparency. In contrast to ECB’s loan-by-loan disclosures examined in Ertan et al. (2017), I focus on the transparency of BHC-level financial reports (i.e., financial statements and supplemental disclosures) filed with the SEC and banks regulators. While the ECB disclosures about a specific securitization provide information about the risk profile of the underlying loans, it does not reveal whether and how much risk is transferred through the securitization– a central focus of this thesis. Referring to figure 2.2, the ECB disclosure reveals the riskiness of the loan pool in the securitization entity, and financial reporting transparency reveals whether and how much of this risk is transferred to external parties. As a result, my study answers a different question thanErtan et al.(2017). Their study answers the question of whether banks would improve their lending decisions when they are required to disclose detailed information about individual loans. In contrast, my thesis addresses whether banks would improve their lending decision when they are required to provide more transparent financial reports that summarize their operating activities.
Second, my thesis examines different mechanisms through which transparency affects lending decisions thanErtan et al. (2017). As discussed in section 2.4, financial reporting transparency affects bank lending decision through its effect on bank stakeholders’ ability
to observe bank risk exposures. I specifically identify three distinct types of stakeholders, namely shareholders, uninsured creditors, and regulators, and examine how transparency affects their ability to monitor bank lending decisions. In contrast, Ertan et al. (2017) examine the effect of the ECB’s ABS reporting standard on bank lending decisions through its effect on banks’ information collection process and on ABS investors’ ability to observe the underlying loans.
Last, in addition to the primary differences discussed above, I examine my research question in a different setting than that of Ertan et al. (2017). I use a U.S. residential mortgage setting as opposed to the European SME loan setting inErtan et al.(2017). Ac-counting, regulatory, and other institutional differences between the European Union and the United States may result in differential responses by EU and U.S. banks to changes in transparency. Moreover, banks may have different lending models for SMEs and residential mortgage borrowers because of differences in their underlying economics. Hence, results in one of these settings may not generalize to the other.
Schmidt & Zhang(2018) andNeilson et al.(2018) examine the effect of Regulation AB (2006) and Regulation AB II (2016) on ABS markets, respectively. These regulations re-quire issuers of SEC-registered structured instruments to provide periodic pool-level (Reg AB) and asset-level (Reg AB II) disclosure about the performance of the underlying as-sets starting in 2006 and in 2016, respectively.20 Schmidt & Zhang (2018) document an
increase in trading activity and liquidity in the ABS market around the filing dates of Reg AB disclosures (form 10-D).Neilson et al.(2018) find that asset-level disclosures after Reg AB II improve investors’ valuations of ABS, and improve credit rating agencies’ evalua-tion of ABS. This thesis differs from these studies because it examines financial reporting transparency of BHCs, as opposed to disclosures by securitization utilities that are not in-cluded in the BHCs’ financial reports, and because it examines lenders’ decision-making, as opposed to that of ABS investors and credit rating agencies. My thesis examines a dimen-sion of the securitization market and associated disclosures not explored in these studies (Schmidt & Zhang 2018,Neilson et al. 2018), and hence it complements them. Schmidt & Zhang (2018) and Neilson et al. (2018) focus on disclosures by securitization entities and their effects on ABS investors and credit rating agencies. In contrast, I examine BHC-level transparency and its effect on BHCs’ lending decisions.
Xie(2016),Dou(2017), and Dou et al.(2018) examine the effect of specific accounting policies on bank operating decision. Xie(2016) finds no evidence that fair value accounting has procyclical effects on banks’ supply of credit to residential borrowers. Dou(2017) and
20Reg AB does not fall in any of the test periods around the pronouncements, and Reg AB II was not in effect during my sample period.
Dou et al.(2018) show that consolidation of VIEs per FAS 166 & 167 leads to lower supply of credit to residential mortgage borrowers and small business, respectively. My thesis differs from these studies because I examine financial reporting transparency across several accounting standard changes as opposed to a single such event, and because I examine the riskiness (or quality) of bank lending decisions instead of the quantity of credit supply (e.g., mortgage approval rate). While the quantity of credit supply is an important lending decision, it does not completely capture banks’ risk-taking in their lending decision. For instance, an increase in the proportion of applications for high-quality mortgages can lead to higher approval rates, without necessarily increasing risk.
Bushman & Williams (2012) and Bushman & Williams (2015) examine the relation between the transparency of loan loss provisioning and bank risk. Bushman & Williams
(2012) use a sample of banks from 27 countries to examine whether the transparency of loan loss provisioning affects external monitoring of bank risk-taking. They find that forward-looking discretionary provisioning designed to smooth earnings (smoothing) dampens ex-ternal discipline of bank risk-taking and that forward-looking discretionary provisioning reflecting timely recognition of expected loan losses (forward-NPL) enhances external dis-cipline of bank risk-taking.21 Bushman & Williams(2015) examine a sample of U.S. banks over the 1993-2009 period and find that greater delay in loan loss recognition (DELR) is associated with greater stock market illiquidity risk and stock market down side risk.22 My
thesis differs from these studies because I focus on bank risk-taking in a specific operat-ing activity, namely residential mortgage lendoperat-ing decisions, as opposed to bank-level risk, which allows me to better identify the effect of transparency. Bank-level risk measures used in prior literature are not limited to risk-taking in operating activities, as they capture only the aggregate effect of all types risk the bank takes, including leverage.
21They estimate smoothing as γ1andforward-NPL asγ2from the following regression. LLPitj =γ0+γ1Ebllpitj+γ2∆N LPit+1j+γ3∆N LPitj+γ4∆N LPit−1j+γ5∆N LPit−2j+
γ6CAPit−1j+γ7SIZEit−1j+γ8∆GDPij+itj
whereLLP stands for loan loan provisions,N P Lstands for non-performing loans,Ebllpstands for earnings before loan loss provisions and taxes, CAP is equity capital to total assets, andSIZE is the the natural logarithm of total assets.
22Bushman & Williams(2015) use two measures of down-side risk, namely the value-at-risk and condi-tional value-at-risk of stock returns
2.3.2
Securitization and Lending Decisions
This thesis is also related to prior studies that examine the effect of securitization on bank lending decisions (e.g.,Mian & Sufi 2009,Keys et al. 2010,Agarwal, Chang & Yavas 2012,
Jiang, Nelson & Vytlacil 2014b). This stream of literature documents that securitization leads to banks reducing their screening and monitoring of borrowers, which results in greater bank risk-taking. The literature identifies risk transfer through securitization as the primary mechanism for this effect. I extend this literature by examining the effect of transparency on risk-taking. By comparing securitizing banks’ lending decisions before and after a transparency shock, I can disentangle the effect of the securitization activity from the effect of transparency.
2.4
Hypotheses Development
Securitization can affect bank lending decisions through three non-mutually exclusive chan-nels. First, as discussed in section 2.2.1.2, securitization can enable banks to transfer the risk of the underlying loans they originate to ABS investors. Regardless of transparency, true risk transfer leads to lower borrower screening and monitoring incentives because it reduces banks’ exposure to the loans they originate, assuming reputation alone is not sufficient to motivate banks to screen and monitor borrowers.
Second, securitizations, when treated as sales, enable banks to record gains upon secu-ritization in lieu of periodic income over the life of the securitized assets. Secusecu-ritization gains immediately increase GAAP earnings and Tier 1 capital throughout my sample pe-riod, except for large and internationally active banks that were required to exclude certain types of securitization gains from their Tier 1 capital beginning in 2008. Securitizations can also enable banks to reduce their risk-weighted asset base because off-balance-sheet securitized assets often receive lower risk-weights. All else equal, lowering risk-weighted assets decreases the amount of capital required to meet the minimum regulatory capital and leverage ratios. Karaoglu (2005), Dechow & Shakespeare (2009), and Dechow et al.
(2010) provide evidence of earnings and regulatory capital management through securiti-zation income. Acharya et al. (2013) document that banks used ABCP conduits to lower their risk-weighted asset base. These accounting and regulatory advantages can change banks’ focus from quality to quantity of loan origination to increase securitization vol-ume, if banks and their stakeholders believe that securitization transfers risk to investors (Acharya & Ryan 2016).
and the carrying amount of the sold components, is in principle a function of the risk transferred through securitizations. Higher fair valuation of the retained components, ceteris paribus, leads to higher securitization gain. The bank allocates the carrying value of securitized loans between sold and retained components based on their proportional fair values. Given fixed proceeds for the sold components, higher fair valuation of the retained components leads to lower carrying value allocation to the sold components, and to higher securitization gain. All else equal, higher fair valuation of the retained components indicates lower retained risk. Higher valuation arises from either higher cash flow forecasts for a given discount rate or a lower discount rate for a given cash flow forecasts. Off-balance-sheet securitized assets receive lower risk weights, because regulators believe that banks transfer risk through securitization. Thus, the extent of perceived risk transfer affects the extent to which securitization enables banks to manage earnings and regulatory ratios, and securitization accounting can influence stakeholders’ perception of the risk transferred.
Last, Pennacchi (1988), Schipper & Yohn (2007), Loutskina & Strahan (2009), and
Nadauld & Sherlund (2013) show that securitization can reduce banks’ cost of funding securitizable assets. The Federal Reserve’s BHC Supervision Manual (2016, sec. 2128.02) states that “securitized issues often carry a higher credit rating than that which the banking organization itself could normally obtain and, consequently, may provide a cheaper form of funding”. Thus, securitization can transform relatively high-risk loans with negative net present value (NPV) under traditional funding methods into positive NPV loans. All else equal, this leads to an increase in the riskiness of banks’ loan originations. The cost of raising funds through securitization depends on securitization investors’ risk preference and the extent of risk transferred to these investors. Thus, for a given level of investor risk preference, banks’ ability to lower funding cost through securitization depends on investors’ perception of risk transfer through securitization.
2.4.1
Transparency and Securitization-driven Bank Risk-taking
Bank transparency can affect bank risk-taking if it enhances stakeholders’ ability to mon-itor banks’ risk exposure. The Bank for International Settlements (2012) and Plosser
(2014) suggest that greater transparency increases stakeholders’ ability to discipline banks by making the inherent risks more visible.23 The Federal Reserve’s Commercial Bank
Examination Manual (2016, sec.4030.1) states that “well informed investors, depositors, creditors, and other counterparties can provide a BO [banking organization] with strong incentives for maintaining sound risk management systems and internal controls.”
23Charles I. Plosser was the President and CEO of the Federal Reserve Bank of Philadelphia from 2006-2015.
Securitization can affect banks’ risk-taking incentives when originating securitizable assets. For all the three channels identified above, the effect of securitization on risk-taking is a function of the extent of risk transfer, and transparency affects the accuracy of observed risk transfer. In figure2.2, transparency sheds light on the gray shaded area, allowing bank stakeholders to observe how much risk remains with the bank. The specific effect of transparency on bank risk-taking depends on managers’ and stakeholders’ relative risk preferences, as stakeholders only discipline risk-taking that is not aligned with their preferences. Based on potential conflicts of interest among managers and stakeholders, I explore three channels through which transparency can affect bank risk-taking.
2.4.1.1 Manager-Shareholder Alignment
Transparency can affect bank risk-taking through corporate governance when bank man-agers and shareholders have conflicting risk preferences, and if transparency helps to align their preferences. Following Stulz (2014), I assume that the primary goal of bank gover-nance is to maximize shareholder value subject to regulatory constraints, and that good governance strives to align managers’ risk preferences with those of shareholders. Based on these assumptions and prior evidence (Laeven & Levine 2009), I characterize bank risk-taking as a function of the relative powers of managers and shareholders within the cor-porate governance structure, and focus my discussion on manager-shareholder alignment. Greater transparency can affect the power balance between managers and shareholders in the governance structure in favor of shareholders, if observability of banks’ activities affects shareholders’ ability to align managers’ actions with their preferences. (Bushman 2014, p. 387) argues that “transparency plays a fundamental corporate governance role in all industries” by supporting monitoring by directors and by enhancing protection of investor rights.
The direction of the effect of transparency on risk-taking through this channel depends on managers’ and shareholders’ relative risk preferences. Greater transparency leads to lower taking if shareholders prefer less risk than managers do, and to higher risk-taking if shareholders prefer more risk than do managers. Prior research provides evi-dence that the average bank shareholder prefers more risk than do managers. Saunders, Strock & Travlos (1990) and Laeven & Levine (2009) show that shareholder-controlled banks, as measured by managerial ownership or ownership concentration, take more risk than manager-controlled banks. Fahlenbrach & Stulz(2011) show that banks with better manager-shareholder alignment, as measured by managerial ownership and CEOs’ equity portfolio sensitivity to stock price changes, performed worse during the financial crisis than banks with poor manager-shareholder alignment, suggesting that banks with better