Worcester Polytechnic Institute
Digital WPI
Masters Theses (All Theses, All Years)
Electronic Theses and Dissertations
2015-03-20
Refining Learning Maps with Data Fitting
Techniques
Seth Akonor Adjei
Worcester Polytechnic InstituteFollow this and additional works at:
https://digitalcommons.wpi.edu/etd-theses
This thesis is brought to you for free and open access byDigital WPI. It has been accepted for inclusion in Masters Theses (All Theses, All Years) by an authorized administrator of Digital WPI. For more information, please [email protected].
Repository Citation
Adjei, Seth Akonor, "Refining Learning Maps with Data Fitting Techniques" (2015).Masters Theses (All Theses, All Years). 178.
i
Refining Learning Maps with Data Fitting
Techniques
By
Seth Akonor Adjei
A Thesis
Submitted to the Faculty Of
WORCESTER POLYTECHNIC INSTITUTE In partial fulfillment of the requirements for the
Degree of Master of Science In Computer Science _____________________________ March 2014 APPROVED: ___________________________ Dr. Neil T. Heffernan Advisor – WPI ___________________________ Dr. Joseph Beck Reader – WPI ___________________________ Professor Craig Wills
i
Abstract
Learning maps have been used to represent student knowledge for many years. These maps are usu-ally hand made by experts in a given domain. However, these hand-made maps have not been found to be predictive of student performance. Several methods have been proposed to find better fitting learning maps. These methods include the Learning Factors Analysis (LFA) model and the Q-matrices. In this thesis I report on the application of one of the proposed operations in the LFA method to a small section of a skill graph and develop a greedy search algorithm for finding better fitting models for this graph. Additionally an investigation of the factors that influence the search for better data fitting models using the proposed algorithm is reported. I also present an empirical study in which PLACEments, an adaptive testing system that employs a skill graph, is modified to test the strength of prerequisite skill links in a given learning map and propose a method for refining learning maps based on those findings.
It was found that the proposed greedy search algorithm performs as well as an original skill graph but with a smaller set of skills in the graph. Additionally it was found that, among other factors, the num-ber of unnecessary skills, the numnum-ber of items in the graph, and the guess and slip rates of the items tagged with skills in the graph have an impact on the search. Further, the size of the evaluation data set impacts the search. The more data there is for the search, the more predictive the learned skill graph.
Additionally, PLACEments, an adaptive testing feature of ASSISTments, has been found to be useful for refining skill graphs by detecting the strengths of prerequisite links between skills within a graph.
ii
Acknowledgements
I wish to give the greatest of thanks to God for assisting me to complete this thesis. Without him, I could not have done this.
I wish to acknowledge the understanding of my wife, Esther and my children Bryan and Kayla Adjei. They have been tremendous in their support of my work. I know I have been away many times, but they have all shown their understanding as we have gone through these stressful times.
Professor Neil Heffernan, my advisor, is one professor in the Computer Science (CS) department who deserves mention in this acknowledgement. I appreciate his understanding of my circumstances and his willingness to assist even when the going was tough.
I cannot but mention Corey Belhemeur and Skyler Whorton, former students of WPI, for initiating the development of PLACEments. This is one of the tools that has been very useful in the studies I have conducted so far and which I report in this thesis. I acknowledge the assistance of Douglas Selent, a colleague graduate student in the Computer Science department as well as Bohao Li, an undergradu-ate student also in the Computer Science Department for their assistance in developing tools for this thesis.
iii
Table of Contents
Abstract ... i Acknowledgements ... ii List of Figures ... iv List of Tables ... iv Chapter 1: Introduction ... 1Chapter 2: Refining Learning Maps with Data Fitting Techniques: Searching for Better Fitting Learning Maps ... 2
Introduction ... 2
Initial Learning Map Skill Map ... 3
Methodology ... 4
Experiment 1: The Search Algorithm ... 6
Experiment 2: Stability Experiment ... 9
Discussion... 10
Contributions, Conclusions and Future Work ... 11
Chapter 3: Refining Learning Maps with Data Fitting Techniques: What Factors Matter? ... 13
Introduction ... 13
Problem Statement ... 13
Methodology ... 13
Experiments ... 16
Conclusion ... 20
Chapter 4: Searching for Learning Maps using Adaptive Testing System: Placements ... 21
Introduction ... 21
PLACEments, an Adaptive Testing Systems ... 21
Research Question ... 22
Methodology ... 22
Dataset ... 23
Results and Analyses ... 24
Limitations of the Approach ... 27
Contribution ... 28
Conclusion and Future Work ... 28
References ... 29
iv
List of Figures
Figure 1: The initial learning map that researchers created. . ... 4
Figure 2 The graph before the merge of skills M1289 and M1133 ... 5
Figure 3 After the merge of the arc between M-1289 and M1133. ... 5
Figure 4 Greedy Search Algorithm ... 6
Figure 5 Search Results ... 7
Figure 6 The graph of the best skill model ... 7
Figure 7 The Sequence of Merges performed for the best skill graph ... 8
Figure 8 Skill Graph after Merge 12 (3 skills) ... 9
Figure 9 Stability Results ... 10
Figure 10 A Sample 3-skill graph generated for the experiments ... 14
Figure 11 Creation of Fake Skill. ... 15
Figure 12 Effect of guess/slip on learning back the original graph ... 17
Figure 13 Effect of Number of Fake Skills on model improvements ... 18
Figure 14 Different graph types for experiment 2 ... 18
Figure 15 Effect of students/items on the model simplification. ... 18
Figure 16 Percent of graphs learned back for student ranges 50-200 and 2+8 items per skill... 19
Figure 17 Impact of Student Numbers ... 20
Figure 18 A sample skill graph and a sample student’s response configuration ... 22
Figure 19 Sample navigation of the graph for this study ... 23
Figure 20 A portion of the prerequisite skill graph designed by a math expert and based on standards from the Common Core Mathematics Standards ... 23
Figure 21 Prerequisite Link Strength ... 24
Figure 22. Prerequisite Skill Link Strength by knowledge level ... 26
Figure 23 Medium and High Knowledge Students' contribution to link strength ... 27
List of Tables
Table 1. Example Matrix. ... 14Table 2. Student/Guess Impact on Evaluation ... 17
1
Chapter 1: Introduction
Several learning maps, representing a set of skills in a domain and the prerequisite skill relationship between the skills, have been developed to represent what a person knows. The learning maps are some-times called skill graphs or prerequisite skill graphs (in view of this these three terms will be used interchangeably). Many of these learning maps are hand designed by experts in the domain for which the map is made. However, can we detect any defects in these learning maps with data collected from students? Can these defects be removed? What methods are effective for determining these defects and for improving the search? The Learning Factors Analysis method has been proposed to answer some of these questions, however, not much has been reported on its effectiveness. Additionally it does not present any information the strength of the prerequisite skill links. In this thesis an attempt has been made to answer these questions.
This thesis presents a number of approaches that I have taken to solve this problem. The approaches vary from the use of data-mining techniques to empirical studies performed to detect problems with skill graphs. One of the approaches proposed is a greedy search algorithm that applies a portion of the Learning Factors Analysis method to the search. The other approach involves the use of an adaptive testing system to augment the search for more predictive data fitting prerequisite skill graphs, or learn-ing maps.
The thesis is organized as follows: The first chapter presents a description of the main problem that my work has attempted to solve. Chapter 2 presents one approach that was used to refine a leaning map. The approach involves the use of a greedy search algorithm together with Bayesian networks to improve learning maps. Chapter three presents a set of factors that need to be considered if the algorithm pro-posed and used in Chapter 2 is used to search for learning maps. In other words, the factors that the algorithm is susceptible to are presented and analyzed. In Chapter 3, a completely different approach is presented. This approach uses an adaptive testing system, PLACEments (Belhumeur, 2013), which was developed in ASSISTments for testing students’ knowledge of the certain skills in a given domain. We report on a few modifications of this tool and how it was used to detect parts of a skill graph that needs improvement.
2
Chapter 2: Refining Learning Maps with Data Fitting Techniques:
Searching for Better Fitting Learning Maps
The learning sciences need quantitative methods for comparing alternative theories of what students are learning, represented as learning maps. This study investigated the accuracy of a learning map and its utility to predict student responses. Our data included a learning map detailing a hierarchical prerequi-site skill graph and student responses to questions developed specifically to assess the concepts and skills represented in the learning map. Each question was aligned to one skill in the map, and each skill had one or more prerequisite skills.Our research goal was to test if the knowledge representation in the learning map could be improved upon in an iterative way. To this end we applied a greedy iterative search algorithm to simplify the learning map by merging nodes together. Each successive merge re-sulted in a model with one skill less than the previous model. We share the results of the revised model, its reliability, reproducibility, and discuss the validity of the most significant merges.
Portions of this work were published at the following venue:
Adjei, S. A., Selent, D., Heffernan, N. T., Broadus, A, Kingston, N. (2014) Refining Learning
Maps with Data Fitting Techniques: Searching for Better Fitting Learning Maps. In Stamper,
J., Pardos, Z., Mavrikis, M., McLaren, B.M. (eds.) Proceedings of the 7th International
Con-ference on Educational Data Mining pp. 413-414
Introduction
Cognitive models are used to represent how a person’s knowledge may be organized (Gierl, Wang, & Zhou, 2008). They contain descriptions of component pieces of knowledge and connections among the components to indicate how understanding develops in a specified domain (Gierl, Wang, & Zhou, 2008). Different authors have described various cognitive models, including learning maps (Popham, 2011), learning trajectories (Clements & Sarama, 2004), and learning hierarchies (Gagné, 1968). Learn-ing maps use linear sequences of learnLearn-ing goals and are useful for instructional plannLearn-ing (Popham, 2011). A learning trajectory includes a learning goal, a developmental progression defining the levels of thinking that students pass through as they work toward the defined goal, and a set of learning activ-ities or experiences that assist students in reaching the defined goal (Clements & Sarama, 2004). As their name implies, learning hierarchies model prerequisite knowledge components in hierarchies, al-lowing multiple pathways to extend from one prerequisite skill to multiple learning goals (Gagné, 1968).
The learning map extends the notion of a learning hierarchy by representing domain knowledge as a network of component skills and connections, allowing for multiple paths from prerequisites to learning goals. While multiple paths add complexity to the cognitive model, they allow the learning map to represent the potential learning of a broad range of individuals who may experience difficulties travers-ing certain pathways due to disabilities or particular learntravers-ing preferences. As such, the learntravers-ing map provides a flexible model of learning that is consistent with recent advances in universal design for learning (Center for Applied Special Technology [CAST], 2012).
In the present study we examine a small section of a learning map and investigate the effects of permut-ing the topology of the hierarchy. Skills and concepts are represented by latent nodes in the learnpermut-ing map, while directed edges represent the prerequisite relationship among latent nodes and between those nodes and their associated test items. We present a simple method for improving the predictive power of the learning map by combining latent nodes, our initial results on the fit improvement, stability of the resulting map, and interpretation of the algorithms chosen node combinations.
This work connects with literature on searching for better fitting cognitive models. Several non-hierar-chical cognitive models have been developed to represent the relationship between knowledge compo-nents (KCs) in the form of prerequisite skill maps. These cognitive models have been developed to help intelligent tutors, as well as experts, determine student mastery of KCs. A number of technical
3
approaches have been developed to evaluate cognitive models developed by domain experts. One ap-proach is Learning Factors Analysis (LFA), developed by Cen, Koedinger and Junker (2006) to help the Educational Data Mining (EDM)community evaluate different cognitive models.
There are several different methods for analyzing skills. Tatsuoka (1983) introduced the rule space method for representing and determining how well students understood the underlying skills (or rules as termed in the paper) for test items. Additionally, the method is used to identify any erroneous classi-fication or misconceptions of students in responding to test items. Barnes (2005) utilized the Q-matrix method from Tatsuoka’s rule space method to organize combinations of skills into distinct latent classes and assign students to latent classes based on level of mastery. Additive Factor Models (AFM) also utilize the Q-matrix but with a multiple logistic regression model which predicts student performance based on a number of factors, primarily the number of opportunities a students has to demonstrate a particular skill. However Cen (2009) reported that AFM did not accurately predict items involving conjunctive skills and hence introduced the Conjunctive Factor Model (CFM) to improve predictions in this area. In addition to latent skill cognitive models, item to item knowledge structures have also been learned from empirical data using Bayesian Network structure learning and partial order knowledge structures (Desmarais, Gagnon 2006).
Our approach to simple merging of skills was inspired by Learning Factors Analysis, which uses a combinatorial search to determine which model best fits student data. The combinatorial search consists of three different types of operations: splitting, merging, or adding existing KCs. Splits occur when a knowledge component is determined to be composed of more than one skill, and hence splits into mul-tiple skills. One or more skills are merged if they are determined to be inseparable skills, given student data. The add operation involves the inclusion of a completely new skill to the original map (Cen, 2009). Other researchers have tried to extend LFA to other subject domains. Leszczenski and Beck (2007) introduced a scalable application of the LFA framework in the context of reading knowledge transfer. The problem with this approach is that the search was unstable and could give different results each time the search was run. Instead of determining a student model given an initial human generated model, Li, Cohen, Noboru, and Koedinger (2011) proposed a method for automatically generating the KCs from student responses to individual items. Although their method resulted in the best fit among the other candidates, it may not generalize for models with less coarse grained KCs.
Other models have focused on the determination of a student’s knowledge of certain skills. Logistic regression has been used to trace multiple sub-skills of a given skill (Xu and Mostow, 2011). Pavlik, Cen, and Koedinger (2009) proposed a method for automatically deriving a cognitive model by gener-ating a Q-matrix, which provides a representation of the KCs required for each test item.
In this work we follow the combinatorial search described by Cen, Koedinger and Junker (2006). This technique can be used to analyze hypothesized learning maps and consider whether small improvements to the model result in a better fit to the data. Cen, Koedinger, and Junker (2006) suggested three types of operations, i.e., merges, splits, and adds. However, in this study, we used only merge operations because the initial learning map had high granularity.
Initial Learning Map
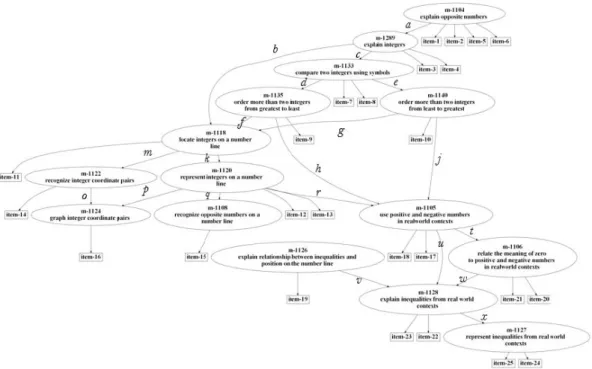
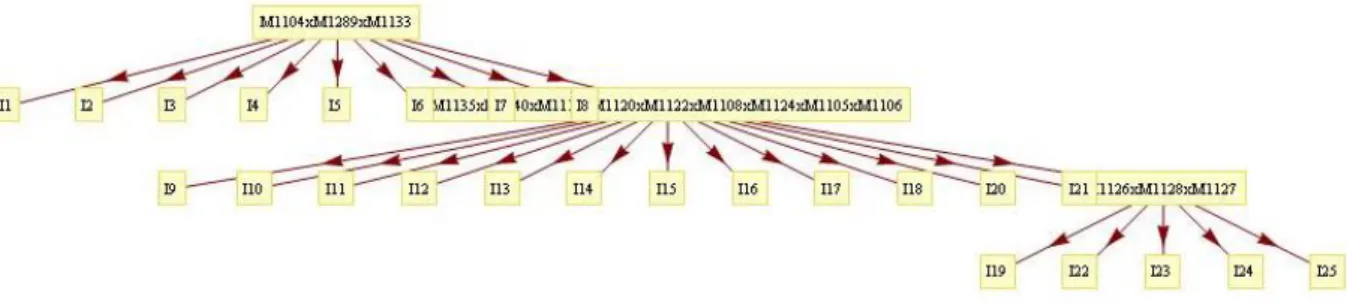
This study examined a section of the learning map containing 15 concepts and skills related to under-standing integers. The map was developed using educational literature describing how students learn to understand and operate with integers. The set of integers includes whole numbers and their opposites, presenting many students their first exposure to negative numbers (Van de Walle, Bay-Williams, Karp, & Lovin, 2014). Although many students have prior knowledge of negative values within contexts such as debt or temperatures below freezing, they often struggle when first learning to work with negative numbers. Proficiency with integers includes understanding opposite numbers, comparing integers, rep-resenting integers on number lines and graphs, and using integers in real world problem contexts. The learning map shown in Figure 1 illustrates the component concepts and skills that comprise such un-derstanding. This map suggests that students should learn to identify opposite numbers (M-1104) and
4
integers (M-1289) in preparation for comparing and ordering integers (M-1133, M-1135, M-1140) as well as representing integers on number lines (M-1118, M-1120, M-1108, M-1126) and coordinate planes (M-1122, M-1124). Because integers challenge the initial counting strategies students learned for positive numbers, it is beneficial for students to work with integers in real-world contexts (M-1106, M-1105, M-1127, M-1128) (Van de Walle, Bay-Williams, Lovin, & Karp, 2014)
.
Figure 1: The initial learning map that researchers created. Each ellipse represents a “skill” and each rectangle represents a test item. For easy reference, the links are labeled. The labels do not have any specific meaning.
The data for this study was gathered from student responses to 25 test items aligned to the 15 skills shown in the learning map in Figure 1. All of the test items were multiple choice questions, with four answer options per question. Each skill was assessed by at least one test item, in many cases two items. As part of the test development process, subject matter experts confirmed the alignment of each item to its associated skill, meaning that the item was judged by experts to evoke the intended skill. Therefore, when a student answered a test item correctly, we assumed in this study that the student had mastered the skill associated with that test item. Furthermore, due to the hierarchical structure of the learning map, items associated with skills lower in the learning map were assumed to be more difficult, i.e., require more skills, than items associated with skills higher in the learning map.
In addition to the graph, we utilized a data-set containing the responses of 2,846 students answering the same sequence of 25 items in the learning map. All the students were chosen from middle schools in a mid-western state from grades 6 (8%), 7 (49%), 8 (39%) and 10 (4%). The students’ responses were dichotomous, ‘1’ for correct and ‘0’ otherwise.
Methodology
This section describes the methods used for the study. We describe the merge operation and the evalu-ation procedure used in the search. We subsequently describe the search algorithm.
Merge Operation
In all the experiments described in this chapter, our sole change made to the map was to merge latent nodes. A merge operation occurred when two skills adjacent to each other in the map were combined into one skill. Items from both skills that were merged were reattached to the new single skill. The prerequisites of the constituent skills became prerequisites of the merged skill and the same applied to
5
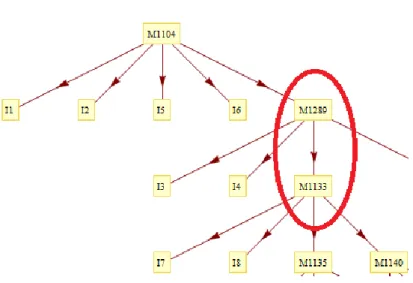
the post-requisites. An example of the merge operation on a section of the skill map is shown below in figure 2 and 3. The figures show a skill map before and after the merge operation. 1289 and M-1133 are the skills that were merged into a single skill, named “M-1289XM-M-1133”. Note that the names of the skill hold no meaning of their own, just as the labels of the arcs between the skills.
Figure 2 The graph before the merge of skills M1289 and M1133
Figure 3 After the merge of the arc between M-1289 and M1133. Note that after the merge, all the items mapped to both M1289 and M1133 are now mapped to the joint skill labeled “M1289xM1133”.
Evaluation Procedure
Each graph that is to be evaluated is modeled as a Bayesian Network of nodes. Each latent node in the network represents a skill in the graph, and the observables represent the items that are tagged with the skills in the graph. Expectation Maximization was used to learn the parameters for the Bayesian Net-work representation of the skill graph. These parameters were then used to predict unseen student data. We used student-item cross validation with 5 student folds and 3 item folds for evaluating the mod-els. Our student and item folds were chosen randomly for the evaluation. More details about how the cross-validation was done can be found in the technical document1. We used the Root Mean Squared
Error (RMSE) metric to evaluate the results of the experiments. RMSE is calculated by squaring the differences between each actual value and predicted value and then finding the average value of the
1
The dataset, evaluation algorithm, and a technical report describing the algorithm in detail can be found at
6
differences. Taking the square root of the average will give the RMSE value for the model. The closer the RMSE is to 0, the better the model.
Experiment 1: The Search Algorithm
This section describes the greedy search algorithm as well as the experiment that was run to
evaluate the algorithm. Using Bayesian networks, a model of an initial skill graph is
cre-ated. Starting with this original graph, we programmatically find all possible skill pairs that can
be merged. We consider merging adjacent skills as described in the section describing the
merge operation. Each possible merge is evaluated with the evaluation procedure just
de-scribed and the best merge is chosen. We apply the best possible merge to the skill graph to
create a new skill graph, which will have one less skill than the graph from the previous
itera-tion. The new skill graph is used as the input to the next iteration of the algorithm. This
technique is iteratively applied until all the skills are merged into a single skill. Figure 4 is a
listing of the algorithm designed for the study.
Additional details of the search algorithm can be found in the technical documents referenced above.
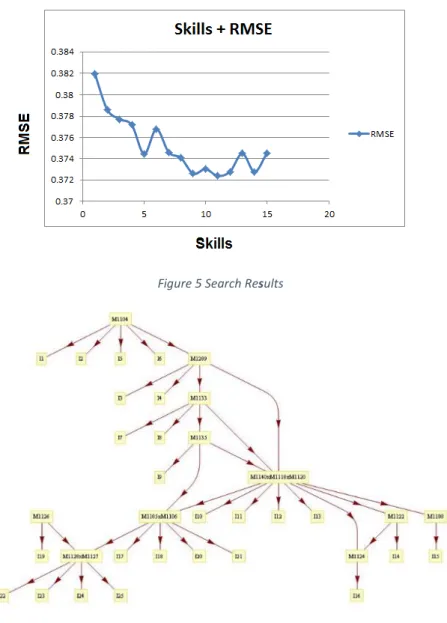
Results and Analysis
Figures 5 and 6 respectively show a table and a graph of the results from the iterative search. The search started at iteration 0, which was the initial skill map consisting of 15 skills before any merges were applied. The search ended at iteration 14, which is a graph consisting of just one skill with all items attached to that one skill. The best models from each iteration are shown below. We recorded the Area under ROC, Root Mean Square Error (RMSE) and accuracy metrics, although we only used RMSE to choose the best models at each iteration and to guide our search. Ultimately, we chose RMSE as the deciding metric since this metric penalizes more for errors in prediction and is a more accurate measure of the goodness of a model.
Input: initialGraph, dataSet Output: bestGraph
Algorithm:
currentIterationBest = initialGraph; currentBestGraphs = empty;
for noOfNodes = noOfNodesInInitialGraph-1 downto 1;
currentGraphs = generate all possible graphs with noOfNodes from the cur-rentIterationBest;
curentIterationBest = select the best from the currentGraphs by fitting
each to dataSet;
currentBestGraphs << currentIterationBest;
return the best from currentBestGraphs;
7
Figure 5 Search Results
Figure 6 The graph of the best skill model
The results show that the best RMSE obtained was from the 11-skill map (shown in Figure 6) at iteration 4 with an RMSE of 0.37238. This is slightly better than the original skill map with RMSE of 0.37451. The 11-skill map has a small but significant improvement (p <= 0.001) from the original skill map. The graph shown in Figure 5 also shows that the models consisting of between 9 and 12 skills have similar RMSE values and are alternative choices for a best model depending on the level of skill granularity desired. Those models are also significantly better than the original model.
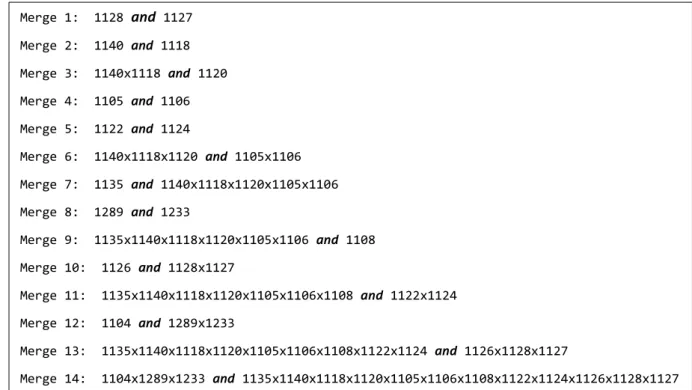
In addition to looking at which model best predicted actual responses, we examined which skills were being merged throughout our iterative search to see if we could find any general trends. The individual skills are represented by their original numbers and a merged skill is represented by the numbers of each skill concatenated with an ‘x’. The numbering is in topological order, meaning that the skill high-est up on the skill map was listed first for a merged skill. The first merge occurred for skills M-1128 and M-1127. Since skill M-1128 was a parent of skill M-1127, it is listed first in the combined skill name M-1128xM-1127. The listing in Figure 7 shows the order in which the merges occurred for all the iterations and the skills involved in the merge for each iterations.
8
Figure 7 The Sequence of Merges performed for the best skill graph
One observation is that the skills that are chosen to be merged in the first few iterations tend to be near the bottom of the skill graph. This suggests that the skills near the top of the skill graph are really separate skills compared to the skills near the bottom of the skill graph. Since the skills near the bottom are merged first based on best RMSE, those skills are better predicted with one skill parameter. There-fore those skills are not really distinct, as they are better modeled with one skill parameter compared to skills near the top of the skill graph.
The last skills to be merged are more likely to be distinct skills from the other skills. Our last merge was the merge between the skill group of 1104x1289x1233 and the rest of the skills in the skill graph. Since this was the last merge chosen resulting in the worst RMSE, it is likely that the group of skills 1104x1289x1233 is a separate group from the rest of the skills.
We believe the structure of the initial skill graph also has influence on the distinct skill groups. Since our merge operation only merges adjacent skills, it takes several merges for a skill at the top of the graph to merge with a skill at the bottom of the graph. A separation will naturally occur between the different levels of the graph. This implies that the original skill graph would need to be somewhat correct in terms of network topology. If non-adjacent skills were in fact the same or similar skills, there would be no easy way for our iterative algorithm to merge them, because our merge operation can only merge adjacent skills. Three distinct skill groups can be seen after iteration 12 in a 3-skill graph (See figure 8). These skills show the influence of the original network topology. The skills tend to group by their locations in the original network. The topmost skill group consists of the skills at the top of the graph, the middle group of skills consists of the skills in the middle of the graph, and the bottommost group of skills consists of the skills at the bottom of the original skill graph.
Merge 1: 1128 and 1127 Merge 2: 1140 and 1118 Merge 3: 1140x1118 and 1120 Merge 4: 1105 and 1106 Merge 5: 1122 and 1124 Merge 6: 1140x1118x1120 and 1105x1106 Merge 7: 1135 and 1140x1118x1120x1105x1106 Merge 8: 1289 and 1233 Merge 9: 1135x1140x1118x1120x1105x1106 and 1108 Merge 10: 1126 and 1128x1127 Merge 11: 1135x1140x1118x1120x1105x1106x1108 and 1122x1124 Merge 12: 1104 and 1289x1233 Merge 13: 1135x1140x1118x1120x1105x1106x1108x1122x1124 and 1126x1128x1127 Merge 14: 1104x1289x1233 and 1135x1140x1118x1120x1105x1106x1108x1122x1124x1126x1128x1127
9
Figure 8 Skill Graph after Merge 12 (3 skills)
An additional observation is that, some of the skills tend to merge by pairing up with one and only one adjacent skill before RMSE starts to decline. Before merge 5, the merges are all pairwise with the exception of merge 3. After merge 5, the skills tend to keep merging into the same skill. The graph generated after merge 4 corresponds to the best skill graph. This suggests that the adjacent skills tend to be similar skills. It also suggests that skills 1140 and 1120 are similar although they are not adja-cent. This is a stronger relationship for several reasons. Firstly, the merges that culminated in the merger of M1140, M1118, and M1120 all took place before the best skill graph was reached. This indicates that those three skills give better predictive performance when represented as one skill. Sec-ondly, this was the first 3-skill group to be merged and the only 3-skill group in the best model before RMSE declines. Lastly the three skills took two iterations of the search algorithm to merge together because skills 1140 and M1120 were not adjacent skills. Despite the initial graph topology our search decided to merge these three skills. The combination of all these factors give stronger reasoning that the three skills M1140, M1118, and M1120 are not really distinct skills.
Experiment 2: Stability Experiment
In the previous experiment, every model was evaluated once and only once, which lead to the question of whether or not our results were stable. Our model evaluation used the Expectation Maximization (EM) algorithm, which is known to be affected by the starting value. In general, the EM algorithm does converge to the correct value, but there are cases where it can converge to incorrect values or to the “opposite” value. Considering the range to be between 0-1, if the actual true value of a parameter was 0.3, EM could converge to (1 - 0.3) = 0.7 instead, if the initial starting point was too far from the true value.
Our research question was: if we were to run the iterative search experiment several times would we end up with the same results using different starting values for EM? Since it takes several hours just to evaluate a single model, running the entire search consisting of over 100 models to evaluate would take too long. Therefore the purpose of this experiment was to evaluate just the first iteration of the search ten times to see if the results converged to a single best graph.
For the first iteration of the algorithm there were sixteen possible merges that could occur. For each of these possible merges we evaluated the resulting model ten times. The evaluation used was the same evaluation as the iterative search experiment for which we tested stability. For each of the ten runs we set the random seed in MatLab to correspond to the run number. This gave us a different set of random numbers for each run of the 16 possible merges, where each merge got the same random seed within a run. Manually setting the random seed also meant our results for the stability experiment would be reproducible
10 Results and Analysis
After evaluating all sixteen models from the first iteration ten times, we kept a count of how many times a model was the best model and how many times a model was in the top 3 best models. RMSE was used to choose the best models since it was used to determine the best model in the iterative search experiment (figure 4). The results are shown in the figure 9 below.
Figure 9 Stability Results
Merge ‘g’2 was in the top 3 the most times (6) and was also the best model the most times (3). Merge
‘x’ and merge ‘q’ also did well. Merge ‘x’ was in the top 3, five times and was the best model two times. Merge ‘q’ was in the top 3, three times and was the best model three times. Merges ‘t’ and ‘o’ also did well. The general observation was that there was separation between good and bad merges but the best merge was not stable and did not converge.
We compared the graphs to our original iterative search experiment. In the original iterative search the first two skills that were merged were skills M-1128 and M-1127, corresponding to merge ‘x’ in our stability experiment. The second two skills that were merged in the iterative search experiment were skills M-1140 and M-1118, corresponding to merge ‘g’ in the stability experiment. Both merges ‘x’ and ‘g’ were the best two graphs in the stability experiment. Although merge ‘g’ did slightly better in the stability experiment, the order in which the merges took place did not matter. The best model in the iterative search took place after 4 merges, which included merges ‘x’ and ‘g’. Although we could not run the stability experiment 10 times for all possible merges and merge paths, we believe that it has a decent chance to converge to the same best model, which occurred after the fourth merge in the iterative search.
Discussion
When analyzing each merge, we considered the skills or concepts described by the affected skills as well as the test items associated to those skills. The descriptions below discuss the three groups of skills merged in experiment 1 and shown in the Best Model Skill Map (Figure 3b) and the two additional pairs of skills merged in experiment 2. In each case, the merges point to commonalities in the skills themselves or among the test items used to assess different skills.
Merge ‘x’ affected skills M-1127 and M-1128. These skills represent “the ability to represent inequal-ities from real world contexts” and “explain inequalinequal-ities from real-world contexts,” respectively. The test items associated with these skills required students to read problems and identify inequality state-ments that matched the problems. In this case the test items did not distinguish between two unique skills, i.e., representing a problem or explaining a problem, as was suggested by the two skills.
2 See Figure 1 for the edges that correspond to the named merges.
0 2 4 6 8 a c d e f g k m o p q r t v w x CO UN T MERGE LETTER MERGE RESULTS
11
Merges ‘g’ and ‘k’ affected skills M-1118xM-1140 and M-1120. These skills represent the abilities to “locate integers on a number line,” “represent integers on a number line,” and “order integers from least to greatest,” respectively. The test items associated with these skills required students to select lists of correctly ordered integers or identify the correct number line graph of a particular integer. In this case the test items did not adequately distinguish between locating and representing integers on a number line (i.e., M-1118 and M-1120) because all of the items were multiple choice, and none provided stu-dents the opportunity to construct their own number line representations of integers. The inclusion of ordering integers from least to greatest (i.e., M-1140) with the other two skills is possibly due to the fact that using a number line is inherently, cognitively connected to ordering numbers from least to greatest.
Merge ‘t’ affected skills M-1105 and M-1106. These skills represent the abilities to “use positive and negative numbers in real-world contexts” and “relate the meaning of zero to positive and negative num-bers in real-world contexts,” respectively. The test items associated with these skills required students to interpret problems involving integers and choose integer answers or verbal statements about integers. Two of the four test items included references to zero either as freezing point or sea level. In this case the items were designed to distinguish between the two skills, i.e., using integers and relating integers to zero. However, the relationship between zero and positive or negative numbers is so critical for un-derstanding integers, it is likely that one cannot compare integers without considering their values in relation to zero.
Merge ‘q’ affected skills M-1120 and M-1108. These skills represent the abilities to “represent integers on a number line” and “recognize opposite numbers on a number line,” respectively. The test items associated with these skills required students to identify the correct number line graph of a particular integer or the opposite of a given integer. In this case, the two skills are inherently connected by the very definition of an integer as the opposite of a whole number. Consequently, it is likely that once students understand the definitions of integers and opposites and can use a number line, the act of gra-phing an integer is the same as gragra-phing an opposite.
Merge ‘o’ affected skills M-1122 and M-1124. These skills represent the abilities to “recognize integer coordinate pairs” and “graph integer coordinate pairs,” respectively. The test items associated with these skills required students to identify the graph of a given integer ordered pair or to select the description of how to graph a given ordered pair on a coordinate plane. In this case, the items did not clearly dis-tinguish between the two skills because the items associated with recognizing integer coordinate pairs included graphs. Furthermore, the skills themselves are difficult to distinguish in a practical sense be-cause when students learn to graph integer ordered pairs, they routinely associate the numerical repre-sentation (i.e., the ordered pair) with its graphical reprerepre-sentation (i.e., the point graphed in the coordi-nate plane).
An additional observation is that some of the skills tended to merge by pairing up with one and only one adjacent skill before RMSE started to decline. Before merge 5, the merges were all pairwise with the exception of merge 3. After merge 5, the skills tended to keep merging into the same skill. The best skill map was generated after merge 4, suggesting that adjacent skills tended to be similar skills and skills M-1140 and M-1120 were similar although they were not adjacent. This was a stronger relationship for several reasons. The merges that culminated in the merger of M-1140, M-1118, and M-1120 all took place before the best skill map was reached. This indicated that those three skills give better predictive performance when represented as one skill. This was also the first and only 3-skill group to be merged in the best model before RMSE declines. Finally, the three skills took two iterations of the search algorithm to merge together because skills M-1140 and M-1120 were not adjacent skills. Despite the initial graph topology, our search decided to merge these three skills. The combina-tion of all these factors provided strong reasoning that the three skills M-1140, M-1118, and M-1120 were not really distinct skills.
12
Our contribution is that we provide a search algorithm to reduce the complexity of a given learning map while improving its fit to real student data. Since merging skills increased accuracy, these results sug-gest that the original skill map was too fine-grained (given the amount of questions per skill and the amount of students who took the test.) In some cases the test items did not adequately distinguish between the skills that were merged; hence such skills were merged. The results of algorithms like this can help content experts that are creating such skill maps and questions either reconsider thinking of the two skills as separate, or spur them to write some new questions that might better distinguish stu-dents that have one of the skills mastered but not the subsequent skill. In this work, those that created the learning map thought that item 11 was a prerequisite for items 12 and 13, but our stability results presented suggest that of all the arcs, this arc is the most unsupported by the data (see Figure 4, arc “g”). In fact, due to this work, we asked an unbiased teacher who did know what our mapping was, to create a hierarchy between items 11, 12 and 13. Surprisingly, she suggested that 12 and 13 were pre-requisites to item 11, suggesting that the arc should point in the exact opposite direction. We think that this means that our method is helpful in using the data to suggest places in the skill graph that require additional attention.
This work relates to additional research by our team. Heffernan’s ASSISTments project is attempting to track and improve students’ knowledge across middle school mathematics. About a decade ago we had a learning map with over 300 skills but we now have reduced that complexity to 147 skills. Cur-riculum designers are correctly thinking about the subtle ways in which problems are different from one another, which cause them to want to add skills to the skill maps to make more subtle distinctions between questions. However if you also want to use the hierarchy to track knowledge, having more skills is bad, as fewer questions remain for each skill making fitting quantitative models harder. All of the work we have done in this paper has a very small number of questions per skill. This naturally would cause us to think that many merges would be necessary, but if we had a large number of ques-tions, and all students answered that large number of quesques-tions, we could probably justify more com-plicated models.
In our experiments we examined the effects of merging skills on an existing learning map. There are many other ways we could have used the existing map to create alternatives. For instance, Cen, Koedinger and Junker (2006) have explored ways of splitting skills or adding new skills, but all of those make more complicated models. What was not examined were the split and add operations. Possible future work could examine those operations to see if a better model can be obtained with them. To verify that our algorithm works correctly, applying it to synthetic learning maps and synthetic data could be useful to determine if our algorithm converges to a true learning map.
13
Chapter 3: Refining Learning Maps with Data Fitting Techniques:
What Factors Matter?
Cognitive models/Learning maps (skill graphs) have been identified as potentially improvable through the use of data mining techniques. However the factors that affect this improvement/refining process are not so clear. In an earlier paper we presented a method for improving these cognitive models. The purpose of this paper is to present the factors to consider when using our initial algorithm to refine learning maps. We present a simulation study that shows how important each of the factors are for this refinement process.
Introduction
Learning maps have been used as a tool to depict the set of skills in a cognitive domain and the tionship between these skills. A number of studies have been conducted to find and represent the rela-tionships between the skills (Embretson, 1998; Mislevy, Steinberg, & Almond, 2002; Sheehan, 1997; Tatsuoka, 1983). Tatsuoka introduced the Rule-space method for identifying skills/knowledge compo-nents in a given cognitive domain whereas (Leighton, Gierl & Hunka, 2004)present another approach called the Attribute Hierarchy Method (AHM). The rule-space method (RSM) does not present the relationship of the skills/knowledge components as a hierarchy. However AHM, which is a variation of Tatsuoka’s RSM, considers the hierarchical relationship between the components (Tatsuoka, 1995). Gierl et. al. (2008) used the AHM approach to make inferences of students’ cognitive assessment. None of these approaches dealt with methods for improving the item response models developed using the methods proposed. The Learning Factors Analysis (LFA) method by Cen, and colleagues (2006) was introduced to deal with this problem. In that paper three different operations for improving the predic-tive abilities of learning maps or cognipredic-tive models are introduced. In (Adjei, et al. 2014) an attempt was made to solve this problem by presenting the results of a number of experiments that showed that learn-ing maps can be refined uslearn-ing just one (the merge operation) of the three possible operations within the LFA method. It was shown that there were significant improvements in RMSE for the best model cho-sen, starting off with a pre-defined learning map.
We realize that, to generalize the method for refining learning maps, there are a number of questions that still need to be answered. These include: “What are the factors that can determine when a model can be best refined?” and “Do the number of skills, the number of items per skills, the number of levels in the skill hierarchy and the number of data points have any effect in determining the best refined model?” Whilst the LFA methods use a set of factors to determine whether to merge, add or split skills to generate better models from an existing one, all the factors used are based on expert knowledge and are independent of data. In order to answer the above questions, we present a number of simulation experiments.
Problem Statement
The LFA model uses three operations (splits, merges, and adds) to refine knowledge components. In each of the operations, learning factors were included in the model refinement process. These factors did not include the number of skills in the model, the levels in the hierarchy of skills in the model, the number of items per skill and the guess and slip parameter values for the items. We hypothesize that these factors are important in generating an optimal model from a given learning map (pre-requisite skill hierarchy). Hence we set out in this paper to present a series of experiments that help in determining the impact of the above mentioned factors in refining a given learning map or cognitive model.
14
To be able to answer our research questions, we started off with a 3-skill graph. We inserted a fake skill at different locations of the graph and ran our evaluation code to determine when the original skill-graph is learned back and what factors determine when this occurs. We examined the following factors and determined which of these factors have the most impact on using the greedy algorithm presented in the earlier paper to refine a given model: guess and slip parameter values, the number of levels in the skill graph hierarchy, and the number of data points (i.e. students and items). For each randomly chosen skill graph we generate a set of simulated data, one each for the number of student and item pairs used. We then evaluate the models using Expectation Maximization to determine the factors that have the most impact. The following section presents the random graph generation, Bayesian network creation, fake skill creation, and the evaluation code.
Random Skill Hierarchy Generation.
To generate a skill graph randomly we began by choosing a random skill hierarchy. Our algorithm to generate the skill hierarchy took a range of skills and a graph depth as input parameters. The output of the algorithm was a valid skill hierarchy where the number of vertices was within the skill range and the number of levels was within the depth range. We order our vertices from 1 to N and use the con-straint that a vertex cannot have a directed edge pointing to a smaller numbered vertex. We also enforce the constraint that a vertex cannot have any self-edges.
To generate a random graph we chose a random number within the range of possible graphs. We then converted this number to binary form and added the correct number of leading zeros (we knew the number of skills from the random number chosen). Then we simply inserted the bits of the binary num-ber into the varying spots of the matrix form of the graph in order.
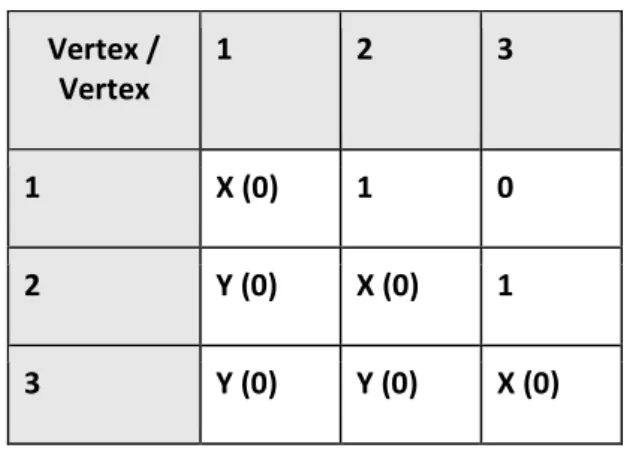
The result was a directed acyclic graph with no self-edges. It will not necessarily be connected. The final step was to check if the graph is connected. If the graph was connected, we kept it; otherwise we discarded it and repeated the generation process. This method allowed us to instantly generate valid graphs. An example is shown in Table 1 and Fig 10 for a graph with three skills.
Table 1. Example Matrix. Matrix generated by the random number 5. A ‘Y’ represents that this cell is ignored because it must be a zero since a vertex cannot have directed edges pointing to vertices with larger numbers. An ‘X’ indicates that this cell is ignored because it must be a zero since a vertex cannot have self-edges.
Vertex / Vertex 1 2 3 1 X (0) 1 0 2 Y (0) X (0) 1 3 Y (0) Y (0) X (0)
15 Create Bayesian Network
The Bayesian network used for the analysis was generated from the skill graph selected from the pre-vious step. To generate the items for the skills an item range was specified. A random number of items was chosen within the item range for each skill. In our experiments we restricted our range to be a single value so all skills would have an equal number of items. We set our Bayesian network up like knowledge tracing, where every skill had one or more items and every item had a guess and slip node (Colbert and Anderson, 1995). An item was tagged with only one skill. The skill nodes were latent nodes since we could not observe whether or not a student knows the skill. Each item node was an observable node, which is a ‘1’ if the student answered the item correctly and a ‘0’ if the student did not answer the item correctly. Both the guess and slip nodes were also latent nodes representing whether or not the student guessed or slipped on the item. A student was considered to have guessed when she answered correctly but did not know the skill. A student was considered to have slipped when she answered incorrectly but knew the skill. Using the previous skill graph example we added the item, guess, and slip nodes to the graph.
The final step to create the Bayesian network was to create the conditional probability tables (CPT) for the nodes. For our experiments we defined each skill node as AND nodes. This means that a student could only know a post-requisite skill if the student knew all of the prerequisite skills. Therefore if a student does not know one of the prerequisite skills then the student cannot know the post-requisite skill. If the student does know all the prerequisite skills (or there are no prerequisite skills), we picked a random probability that the student will know the post-requisite skill between 0.3 – 0.7. Our guess and slip parameters had varying probabilities since that was one of the parameters we experimented with. All the item nodes had a deterministic (0% chance or 100% chance of correctness) CPT based off of the skill, guess, and slip nodes (which were not deterministic).
Creation of Fake Skill
We exported our Bayesian network to MATLAB and used Kevin Murphy’s Bayes Net Toolkit (Mur-phy, 2001) to generate the ground truth data. Once the ground truth data was generated we randomly generated “fake” skills from the original graph. We defined a fake skill as one that does not belong in the graph. The intention was to test the algorithm’s ability to detect that fake skill. A fake skill was generated by randomly choosing a real skill. Once a real skill was chosen, a random number of items was chosen from the real skill. These items were then detached from the real skill and attached to the fake skill. The fake skill was then randomly chosen to be either a parent or a child of the real skill. Fig 11 shows the creation of a fake skill.
Figure 11 Creation of Fake Skill. The left skill graph shows the original skill graph before the creation of the fake skill. The skill graph on the right shows the skill graph after the creation of the fake skill. The fake skill was
created from Skill_1 where item two was removed from skill 1 and attached to the fake skill.
16
In order to evaluate our Bayesian Network we used a similar process as that found in (Adjei, et. al. 2014). We used Expectation Maximization (EM) to learn parameters and fit our model. To evaluate our model we used per student per item cross validation with 5 student folds and 3 item folds. Our student and item folds were chosen randomly for our evaluation. In (Adjei, et. al. 2014) the item folds were chosen randomly but kept the same for each student. The only difference between the evaluations in this experiment is that each student is assigned a different set of random item folds instead of all students having the same set of random item folds.
Experiments
This section describes the set of experiments that we run to determine the factors that impact the search of better predictive skill graphs. These include determining the factors that matter, investigating the impact of student and item numbers on the search, and a final experiment that checked the stability of the search after fixing a number of factors.
Experiment 1: Determining the Factors that Matter
In this first experiment, we started with a set of skill graphs randomly generated from a set of chosen factors. These factors included the number of fake skills, the number of original skills, the number of items attached per shill, and the guess and slip rates for the items used in the skill graph. For each of the graphs, we insert a number of fake skills. We define a fake skill as one that is broken off of an existing skill. The fake skill has a random number of items chosen from the original skill and the fake skill is either a pre-requisite or post-requisite of the original skill. If the fake skill is a pre-requisite of the original skill, all the previous pre-requisites of the original skill become the pre-requisites of the new fake skill and the original skill becomes the post-requisite of the fake skill. The idea is to figure out if this fake skill will be easily identified and merged with the skill from which it was created from. This is to validate our merge operations and to determine what factors influence the determination of a better skill-model /skill map than the original.
Analysis
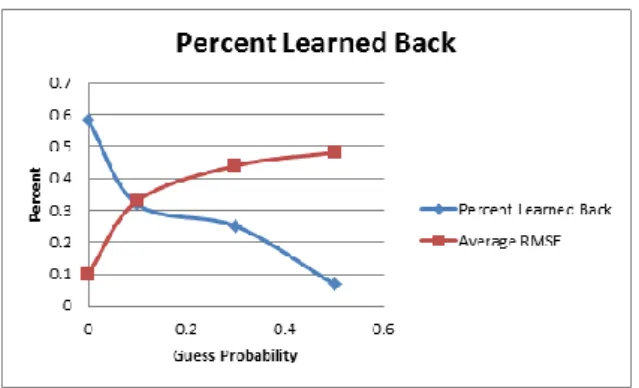
We analyzed the results of the experiment and looked at how the number of students, number of items, guess/slip values, and the number of fake skills impacted RMSE of our predictions and the percent of correct graphs learned back. Figure 12 shows the relationship between the probability a student guessed/slipped and the RMSE as well as the percent of the correct skill graph being learned back. We paired guess and slip values to lower the number of variables in our experiment. Our guess/slip pairings are as follows {(0, 0), (0.1, 0.08), (0.3, 0.16), (0.5, 0.25)}. It shows that the higher chance the student has to guess the answer the less accurate and harder it is to learn back the true original graph. The percent of graphs learned back with a guess/slip probability of 0 is significantly better than the percent of graphs learned back with a guess probability of .5 (p < .001). A realistic guess probability is around 0.14 calculated by Pardos and Heffernan (2010). At this point the percentage of graphs learned is some-where between 0.25 and 0.33. These are not great percentages to learn back a correct graph under real-istic guess and slip values. Not much can be done to lower the guess probability on typical questions middle school math students would see. However more student data can be used to increase model performance.
17
Figure 12 Effect of guess/slip on learning back the original graph
The guess/slip probability is the biggest factor that affects model accuracy followed by the number of students. Table 2 shows how both the guess/slip probability and the number of students affects the percentage of correct graphs learned back and average RMSE. A cell is broken up into two columns where the first column in the cell is the percentage of correct graphs learned back and the second column in the cell in the average RMSE value.
Table 2. Student/Guess Impact on Evaluation
Students
Guess 50 100 150 200
PLB RMSE PLB RMSE PLB RMSE PLB RMSE
0 0.33 0.09 0.64 0.08 0.7 0.1 0.67 0.02
0.1 0.25 0.36 0.33 0.33 0.33 0.32 0.38 0.31
0.3 0.25 0.46 0.33 0.44 0.08 0.44 0.38 0.43
0.5 0.08 0.49 0.08 0.48 0.08 0.48 0 0.46
For a guess probability of 0.3, the percentage of correct graphs (PLB) increases from 25% for 50 students
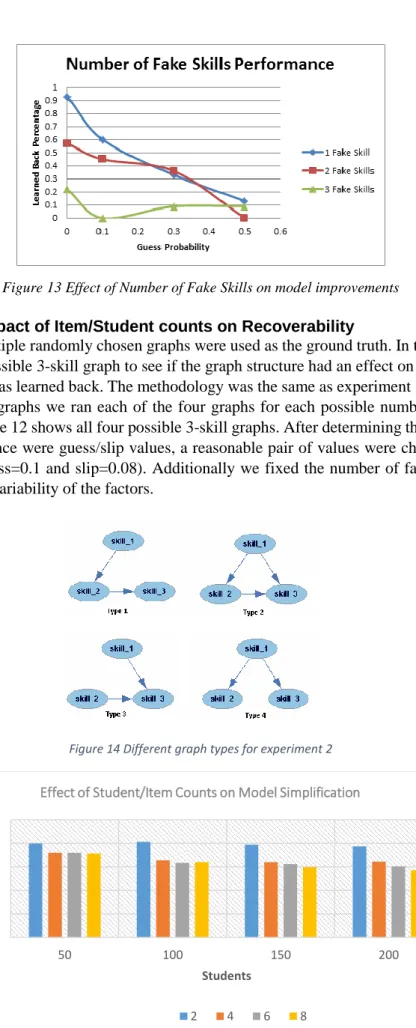
to 38% for 200 students (p = 0.2). This shows that under a realistic worst case guess probability, in-creasing the number of students can increase the percentage of correct skill graphs learned back. The number of fake skills seemed to have little effect on RMSE, however a large effect on learning the correct graph. With more than one fake skill the percentage of correct graphs drops significantly from 0.6 for 1 fake skill to 0 for 3 fake skills (p < .002) for guess values of 0.1. This can be seen for the three points with an x-axis value of 0.1 in Fig 4. No additional findings are presented here as there were no strong trends.
18
Figure 13 Effect of Number of Fake Skills on model improvements
Experiment 2: Impact of Item/Student counts on Recoverability
In experiment 1 multiple randomly chosen graphs were used as the ground truth. In this experiment we chose to try each possible 3-skill graph to see if the graph structure had an effect on whether or not the correct skill graph was learned back. The methodology was the same as experiment 1 except instead of randomly choosing graphs we ran each of the four graphs for each possible number of students and items per skill. Figure 12 shows all four possible 3-skill graphs. After determining that the major factor impacting performance were guess/slip values, a reasonable pair of values were chosen for the guess and slip values (guess=0.1 and slip=0.08). Additionally we fixed the number of fake skills to one in order to reduce the variability of the factors.
Figure 14 Different graph types for experiment 2
Figure 15 Effect of students/items on the model simplification.
0 0.1 0.2 0.3 0.4 0.5 50 100 150 200 R M SE Students
Effect of Student/Item Counts on Model Simplification
19
The general observation from this experiment is clear from Fig 15 above. As the number of data points increases, the level of accuracy in recovering the original graph increases. This is despite the fact that the location of the fake skill was not fixed. Moreover, for any given number of students, an increase in the number of items results in a slight decrease in RMSE and hence better chance of learning back the original graph. This experiment shows that the data points (i.e. student and item numbers) have an impact on improving on the determination of the best model from a given model. The more data points there are, the more accurate the search.
Experiment 3: Stability Experiment
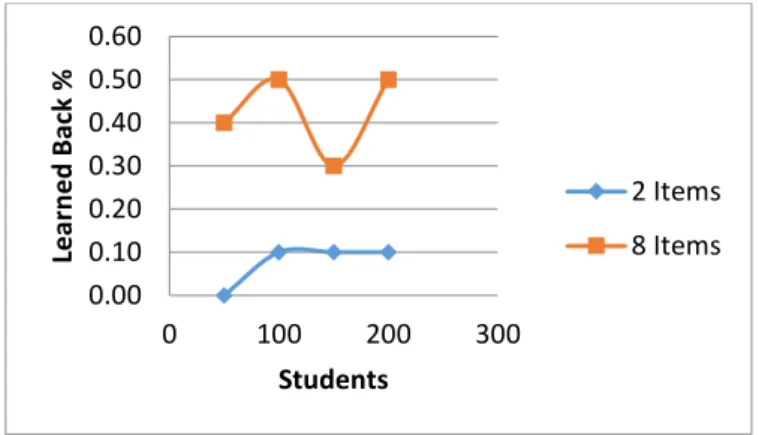
The main purpose of this experiment was to determine whether the results we found in the earlier ex-periments were stable. In this experiment we fixed all the variables except for the number of students and the number of items per skill. We wanted to see how stable our search was and how well it per-formed for a small example with reasonable parameter values. We fixed guess at 0.10 and slip at 0.08 with three skills and one fake skill. For the fake skill we took the first half of items from the original skill. We ran our algorithm for 50, 100, 150, and 200 students for 2 and 8 items per skill. For each pair of parameters we ran the experiment 10 times with different random seeds and took an average of the number times the correct graph was learned back. Figure 14 shows the results of this experiment. We found that the results are very stable for graphs that had two items per skill. The results were less stable for graphs with eight items per skill although the percent of graphs learned back was much batter. The graphs that had two items per skill were learned back correctly 8% of the time, where graphs with eight items per skill were learned back correctly 43% of the time, which is a significant improvement (n=40, p<.001).
Figure 16 Percent of graphs learned back for student ranges 50-200 and 2+8 items per skill
Experiment 4: Impact of Student Numbers on Initial Graph Recoverability
We ran experiment 4 to confirm that the number of students has an impact on the recoverability of the original graph, fixing all other parameters at reasonable values and varying the number of students. For this experiment, guess and slip values were set at 0.1 and 0.08 respectively. We used graph type 4 (Figure 14), set the number of items to 4 and fake skills at 1, varying the location of the fake skill. The student numbers were varied from 10 to 100. For each student number, the evaluation was run 10 times. The results in Figure 17 show that as we intuitively assumed, the number of students has a huge impact on the algorithm’s ability to learn back the true graph. The results show that as the number of students increases the probability of a skill graph being learned back increases whilst the RMSE reduces. These results are significant with p-values below 0.01. This finding confirms that student numbers is an im-portant factor that needs to be considered when refining learning maps.
0.00 0.10 0.20 0.30 0.40 0.50 0.60 0 100 200 300 Lear n e d B ac k % Students 2 Items 8 Items
20
Figure 17 Impact of Student Numbers
Conclusion
Many learning maps/cognitive models are built from expert knowledge. With the production of a pleth-ora of educational data on student performance, it has become imperative to find data centered methods of improving upon these expert-designed learning maps. In our earlier studies we designed and pre-sented an algorithm for simplifying/improving the predictive accuracy of these models. In this paper we have presented a number of factors that influence the data centered model improvement process we initially published. We have shown with our simulation studies that the guess/slip values, number of items per skill, the number of students and the number of fake skills in the graph affect the simplification of the skill models. We also explored many parameters to see how much data is needed to recover the true learning maps. For future work we plan to continue to evaluate our algorithm on larger examples to see how well our algorithm can scale up and test it on well-known real data sets.
0 0.2 0.4 0.6 0.8 1 10 30 60 90 100 Student Numbers
Impact of Student Numbers on Learning Back Original Skill Graph
Average of RMSE
21
Chapter 4: Searching for Learning Maps using Adaptive Testing
Sys-tem: Placements
In our earlier work in the search for better fitting models, we showed that skill graphs can easily be improved by considering just one of the three operations proposed in the Learning Factors Analysis. (Adjei, et. al. 2014) In chapter one, we proposed a greedy search algorithm for searching data fitting models with equally accurate predictive power as the original skill graph but with fewer nodes in the graph. Additionally it has been shown that a number of factors need to be considered in order to improve upon the search. In chapter 3, it was explained that the number of students and items also has an impact on the search. Similarly the choice of the problem with which the skills are tagged also impacts the search.
However, this chapter is meant to answer the following research question: are there more dynamic ways of determining the strength of the relationship between skills in the skill graph? In this chapter, PLACE-ments, an adaptive testing system is presented and used to determine different portions of a skill graph that need to be looked at. The tool identifies the prerequisite relationships in a skill graph that need to be maintained and those that should not exist.
Introduction
In order to improve upon student learning, a number of approaches have been studied to determine ways of improving the effectiveness of the skills teachers transfer to students and the order in which these skills need to be taught. Learning Factors Analysis, Q-Matrices and a few other methods have been proposed and used to improve upon learning maps. Some have shown promising results, though many have not been applied to different subject domains.
However, none of the approaches that have been used have studied the ways in which to determine the strength of the relationships in a prerequisite skill graph. In our quest to find the best methods for im-proving upon learning maps, could we use empirical studies to find the best order in which students must learning certain skills? Can we determine the strength of the relationships between learning maps are their effectiveness? This chapter presents an adaptive testing system that traverses a prerequisite skill graph based on a student’s performance. We present a brief description of how the system works, the design of the study, and the results we found. The chapter concludes with a discussion of the findings of the paper as well as the limitations of this approach.
PLACEments, an Adaptive Testing Systems
PLACEments is a computer aided adaptive testing system. This system is a feature of an intelligent tutoring system, ASSISTments, that mainly provides teachers a means of creating and assigning exer-cises and tests to their students. (Razzaq, et. al., 2009) ASSISTments also has a feature that allows students to do the exercises and tests assigned by their teachers.
The PLACEments system has a number of components: item pool, item selection, termination rules (a skill graph for the knowledge domain in which the students’ knowledge will be assessed and three modules (test creation, test taking (Tutor), and remediation creation)). The item pool for placements is chosen from a list of skill builders used extensively in ASSISTments. The choice of problems for the placements test was made based on the difficulty of the item. The difficulty was determined by calcu-lating the percent correct for all responses of students in ASSISTments to that item and subtracting that value from 1. (see equation 1 below) To ensure that PLACEments does not present overly easy or overly
22
difficult problems, the items for each of the skills tested were chosen such that their difficulty is between .4 and .6 (the smaller the number, the more difficult the item is).
𝑑𝑖𝑓𝑓𝑖𝑐𝑢𝑙𝑡𝑦𝑖= 1 − Pr(𝑖𝑡𝑒𝑚𝑖 = 1) (1)
As noted earlier, PLACEments uses a predefined skill graph to guide test item selection. Though we currently use a prerequisite skill graph developed based on the Massachusetts Common Core State Standards for Mathematics (2010), the system is designed such that it can use any prerequisite skill graph from which tests can be drawn. The initial set of problems is chosen from the initial set of skills. Each skill has one problem chosen from the item pool. When students get an item for a skill incorrect, implying that the student does not have that cognitive skill, the test is expanded by including the prob-lems from the prerequisite skills of each of the skills the student has gotten incorrect. The test bank increases until the grade boundaries chosen at test creation are reached. For a given student, the test terminates when all the skills in the initial set of skills have been tested, and the student gets all the items for that skill correct. If the student is not able to answer any of the initial problems correctly, then the test terminates when there are no prerequisites remaining to be tested.
The following diagram, figure 18 shows a hypothetical graph that explains how the test proceeds. The correctness indicator attached to each node in the graph is a particular representation of a given student’s performance. The nodes in the graph represents the skills, the arrows between the skills represents the prerequisite relationship between the skills (thus, skill ‘D’ is one of the prerequisites of skill ‘A’). In this configuration, the students are assigned skills ‘A’, ‘B’ and ‘C’ as the initial skills. This student is adaptively assigned questions D, E, and H in that order, because he performed poorly on A and E.
Figure 18 A sample skill graph and a sample student’s response configuration
The size of the test is affected by the students’ performance as well as the structure of the skill graph. Once the students complete the test, remediation assignments are created based on the skills they per-formed poorly on. Each student is assigned a different set of remediation. The remediation assignments on the lowest grade level skills are released before those of the higher grade levels. In the example shown in fig 18, the student will be assigned a skill builder assignment in the following sequence: H, E and then A. Once the prerequisite skill is completed, the next skill inline is released.
Research Question
As was stated earlier, this study is meant to determine whether a skill graph can be improved using an empirical studies. To be specific we want to determine the strength of prerequisite skill relationships between skills and hence determine which of such relationships to remove or maintain in a skill graph.
Methodology
To answer our research question, we run a study in which the navigation of a skill graph in a PLACE-ments test is modified for a random sample of students. Figure 19 demonstrates the modifications made to PLACEments in order to answer this question. For those randomly chosen students, a random initial
23
skill (skill ‘A’ in figure 19) is selected and the students get to answer questions from the prerequisite skills (‘B’ and ‘C’) of the chosen skill if the students get the initial skill correct.
Figure 19 Sample navigation of the graph for this study
In order not to overload the chosen students with work, in a given assignment and for those students, only one initial skill is used in the study. Additionally, if any of the chosen students gets the prerequisite skill incorrect, they are not assigned remediation assignments as is the case with all the other assign-ments, and the navigation does not continue to the second level of prerequisite skills (i.e. those of ‘B’ and ‘C’ in figure 19) for the chosen initial skill.
It is hoped that if a higher percentage of the students in the study answer the prerequisite skills of a given skill correctly, this would suggest a strong relationship between the skills, and hence maintain the skill in the graph. On the other hand, if the percentage is low then it would suggest that that prerequisite link in the graph would either require further scrutiny or must be removed.
Dataset
The dataset includes a prerequisite skill graph developed by a Mathematics domain expert. This graph contains skills from the Common Core Standards (2010) spanning grades K-9. The graph, which is the graph used in PLACEments, has a total of 495 prerequisite relationship. A portion of the graph is shown in Figure 20 below. The green lines in the graph indicate that the prerequisite skills are in a lower grade level, whiles the black arrows between the nodes show prerequisite link between skills of the same grade level as the post-requisite skill. The node names represent the skill codes from the Common Core
<