econ
stor
Der Open-Access-Publikationsserver der ZBW – Leibniz-Informationszentrum Wirtschaft The Open Access Publication Server of the ZBW – Leibniz Information Centre for Economics
Nutzungsbedingungen:
Die ZBW räumt Ihnen als Nutzerin/Nutzer das unentgeltliche, räumlich unbeschränkte und zeitlich auf die Dauer des Schutzrechts beschränkte einfache Recht ein, das ausgewählte Werk im Rahmen der unter
→ http://www.econstor.eu/dspace/Nutzungsbedingungen nachzulesenden vollständigen Nutzungsbedingungen zu vervielfältigen, mit denen die Nutzerin/der Nutzer sich durch die erste Nutzung einverstanden erklärt.
Terms of use:
The ZBW grants you, the user, the non-exclusive right to use the selected work free of charge, territorially unrestricted and within the time limit of the term of the property rights according to the terms specified at
→ http://www.econstor.eu/dspace/Nutzungsbedingungen By the first use of the selected work the user agrees and declares to comply with these terms of use.
zbw
Leibniz-Informationszentrum Wirtschaft Leibniz Information Centre for EconomicsGundlach, Erich; Wößmann, Ludger
Article
Family background, schooling resources, and
institutional features : what determines student
performance in East Asian countries?
East Asian economic perspectives
Provided in cooperation with:
Institut für Weltwirtschaft (IfW)
Suggested citation: Gundlach, Erich; Wößmann, Ludger (2004) : Family background, schooling resources, and institutional features : what determines student performance in East Asian countries?, East Asian economic perspectives, Vol. 15, pp. 17-31, http:// hdl.handle.net/10419/4326
Institutional Features:What Determines Student
Performance in East Asian Countries?
Erich Gundlach and Ludger Woessmann
Kiel Institute for World EconomicsAbstract
This paper examines determinants of educational performance in the high performing East Asian economies of Hong Kong, Japan, Singapore, South Korea, and Thailand by running within country regressions. The determinants considered include family background, school resources, and institutional characteristics of schools. Family background is found to be important, particularly in Korea. The class size appears to be positively associated with student performance, implying that putting in additional resources to reduce class size may not be an effective way to enhance the education sector’s productivity. al productivity. Such institutional characteristic of school as ‘autonomy in teacher salary decision’ is found strengthen student performance in Japan and Singapore. However, within country data provide limited variation in school institutional characteristics for the their effect to be precisely estimated. The results, despites their limitations, should be useful for future educational policy formulation not only in the East Asian countries examined but also in other developing countries.
1. Introduction
Most of the high-performing East Asian economies have achieved universal enrollment of children in primary and secondary education, and the East Asian countries actually seem to do very well with regard to the quality of schooling. Their students repeatedly take top places in international comparative studies of cognitive achievement in math, science, and reading literacy. Understanding how East Asian countries have achieved a high level of average student performance appears to be crucial for devising policies that respond to the challenges of a future skill-based economy by providing a high-quality education for as many children as possible.
However, the causes of East Asia’s extraordinary educational performance record are largely unknown. We focus on five countries, namely Hong Kong, Japan, Singapore, South Korea, and Thailand, to single out the potential effects on student performance of family background, schooling resources, and institutional features of the schooling system. Our empirical evidence is based on student-level micro data from the Third International Mathematics and Science Study (TIMSS), which combines information on the performance of students with abundant background information on the family of students and on the specific schools attended. The details of our data base are outlined in an extended paper (Woessmann 2003b) together with a more detailed discussion of methodological aspects and empirical results.1
Our empirical results provide answers to three important questions. First, they reveal which countries do best in supporting the performance of students with a weak social background. Second, they show which role schooling resources such as class size play in the cognitive achievement of East Asian students. Third, they clarify the impact of systemic
features such as school autonomy and parental involvement on student performance, thereby shedding light on other policy options besides resource policies in our sample countries.
It should be noted that our results provide answers mainly to questions related to within-country variations in student performance. Our results demonstrate the importance of different sets of influence factors for the performance variation within each country, and they allow for a comparison of the size of these effects across countries. By contrast, for questions relating to the most important determinants of the cross-country variation in test scores, the most promising way is to use the entire international dataset in order to link cross-country performance differences to country differences in potential determinants. Such cross-country analyses have been performed elsewhere, both at the cross-country level (e.g., Lee and Barro 2001) and at the student level (Woessmann 2003a). Yet to understand better how the East Asian countries achieve their high educational standards and in order to learn from the East Asian education systems, one has to look at the relative effects of various social, economic, and institutional determinants of student performance within these countries.
2. Family Background as a Determinant of Student Performance
By comparing country-specific estimates of the effect of family background on student performance, we can assess whether all East Asian schooling systems in our sample provide equal educational opportunities for children from different family backgrounds. We estimate education production functions for each country of the following form:
(1) Tics =Bicsα1+εics,
where T is the test score of student i in class c in school s, B is the vector of family background variables, and ε is the error term.2 The coefficient vector
1
α is to be estimated. Here the estimation does not control for other school characteristics, such as schooling resources or within-country differences in schooling institutions, because in this section we are interested in the total impact of social background factors on student performance, including any effect that might work through families’ differential access to schools or their influence on school resources and policies.
It helps to clarify in advance what the estimates of the coefficients α1 on the
family-background variables (and of the coefficients on the other explanatory variables in later sections), and especially differences in the estimates across countries, mean and do not mean. Since the TIMSS data were generated by the same data-generating process in the different countries and are therefore directly comparable across countries, the prior from a technical point of view should be that the coefficient estimates should be the same everywhere. If this were not the case, this implies that there must be differences in how the school systems work. Such differences would not reflect different distributions of family-background characteristics in the different populations but show, say, a different effect on student performance of a given level of parental education across schooling systems.
Problems in the econometric estimation of equation (1) are that the explanatory variables are in some cases varying within classes or schools whereas the dependent variable is individual student performance, that the performance of students within the same school may not be independent from one another; and that the primary sampling unit (PSU) of the two-stage clustered sampling design in TIMSS was the school, not the individual student as implicitly assumed in the estimation equation. As shown by Moulton (1986), a hierarchical structure of the data as in the case of TIMSS requires the addition of higher-level error
2 The equation also includes controls for every variable with missing values to ensure that the results are robust against possible bias arising from data imputation. For details, see Woessmann (2003b).
Figure 1: Family Backgrounda and Student Performance 39.1 124.2 90.3 35.5 56.0 99.8 139.0 51.6 0 20 40 60 80 100 120 140 160 Thailand South Korea Singapore Hong Kong
Test score difference b math science
Notes:
a) ‘Family Backgorund’ is measured by the level of education of parents.
b) ‘Test score difference’ is between students with parents with finished university education and with more than 200 books at home and students with parents without secondary education and less than 11 books at home.
components to avoid spurious results. Therefore, the error term ε of equation (1) has a school-level and a class-school-level element in addition to the individual-student element:
(2) εics =ηs +νc +υi,
where η is a school-specific error component, ν is a class-specific error component, and υ is a student-specific error component. Clustering-robust linear regression (CRLR) is used to estimate standard errors that recognize this clustering of the survey design. The CRLR method relaxes the independence assumption and requires only that the observations be independent across the primary sampling units. By allowing any given amount of correlation within the primary sampling units, CRLR estimates appropriate standard errors when many observations share the same value on some but not all independent variables (cf. Deaton 1997).
Our estimates also consider that TIMSS used a stratified sampling design within each country, which produced varying sampling probabilities for different students (Martin and Kelly 1998). To obtain nationally representative coefficient estimates from the stratified survey data, weighted least squares (WLS) estimation using the sampling probabilities as weights is employed. The WLS estimation ensures that the proportional contribution to the parameter estimates of each stratum in the sample is the same as would have been obtained in a complete census enumeration (DuMouchel and Duncan 1983; Wooldridge 2001).
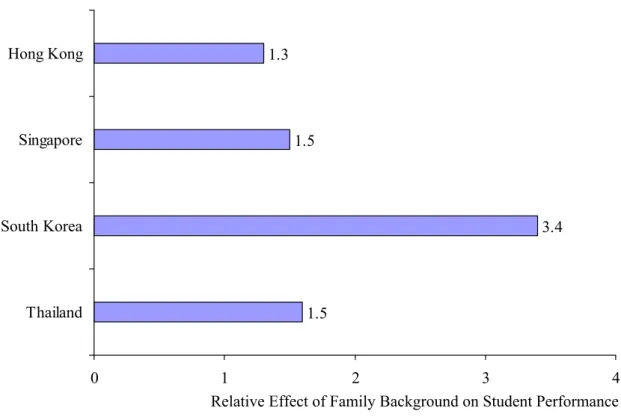
Figure 2: The Average Effect of Family Background on Student Performance Relative to the Effect of One Year of Schooling
1.5 3.4 1.5 1.3 0 1 2 3 4 Thailand South Korea Singapore Hong Kong
Relative Effect of Family Background on Student Performance
Note:
The ‘Relative Effect’ is measured as a ratio of average test score difference in math and science due to average difference in educational family background to the average test score difference in math and science between students in the seventh grade and the eighth grade.
Figure 1 represents our estimates for the different impact of family background on student
performance across four East Asian countries.3 Here we focus on the effects of the
educational background of the family of each individual student.4 We rely on two sets of
dummy variables to identify the effects of educational family background. One measure is the highest level of education achieved by the parents of a student. In addition, we use the reported numbers of books at home as an internationally comparable proxy for the educational background of a student’s family.
As Figure 1 reveals, students with a more favorable family background perform consistently better in both math and science in all four countries considered. The largest performance difference between students with a strong educational family background relative to students with a weak educational family background are found in South Korea and in Singapore. For instance, the size of the coefficient for math in South Korea says that the performance gap between students with strong and weak educational family background was about 139 test-score points. The estimated effects are less than half as large in Hong Kong and in Thailand, with Singapore closer to the results for South Korea.
To put these findings into perspective, it is useful to compare them to the average test score difference that arises from one additional year of schooling. Our (unreported) estimates show that the average test score differences in math and science between seventh-grade and
3 For the case of Japan, most family background variables, and especially data on the education of parents, are missing from the TIMSS database.
4 The reported effects are conditional on additional student characteristics like age, grade, gender, place of birth, and presence of both parents. For detailed results, see Woessmann (2003b).
grade students are about 37 test score points in Hong Kong, 75 test score points in Singapore, 33 test score points in South Korea, and 29 test score points in Thailand. Figure 2 relates these test score effects of one additional year of schooling to the previously estimated effects of educational family background. On average, it appears that the effects of educational family background on student performance are between 30 percent and 55 percent larger than the effects of an additional year of schooling in Hong Kong, Singapore, and Thailand. In South Korea, however, the average test score effects of educational family background appear to be about as large as the test score effects of 3.4 years of schooling. Hence students from weak social backgrounds apparently face more obstacles for progress in the South Korean schooling system than in the other three East Asian schooling systems considered.
3. Economic Resources as Determinants of Student Performance
The standard procedure to estimate the relationship between schooling resources and student performance is to add a measure of resources to equation (1), such that
(3) Tics =Bicsα2+Rcsβ1+εics,
where R is a vector of resource measures such as class size, the availability of instructional materials, and teacher characteristics. The education production function (3) describes the maximum amount of schooling output in the form of student performance that can be achieved by a given amount of schooling inputs, controlling for social background B.
Under the assumption that schooling resources are exogenous to student performance – which is unlikely to be the case – a least squares regression could be used to measure the impact of resources on student performance as an estimate of β1. The coefficient vector on resources obtained by this standard procedure may be substantially biased, however. One potential reason for bias is that the resource endowment may to some extent be endogenous to student performance, because, for example, weaker students may be sorted into smaller classes. If so, this could result in a negative correlation between resources and student performance. Another potential reason for bias is the impact of further omitted variables which, like sorting, could be related to the resource endowment.
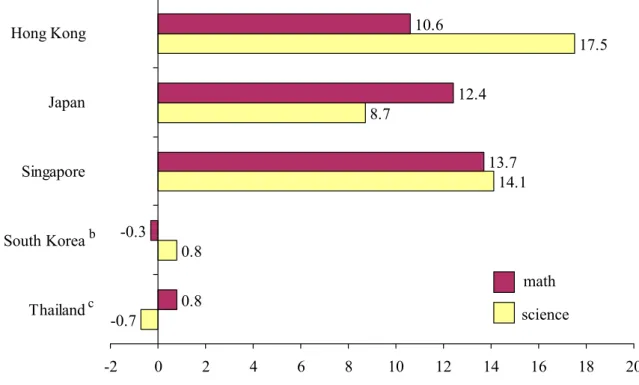
Figure 3 presents least-squares coefficients on a specific measure of resources, namely class size. The estimated coefficients are conditional on the inclusion of the social and individual background variables mentioned in the previous section.5 Class size is measured in
natural logarithm units because the proportional impact of a one-student reduction in class size is greater the smaller the initial size of the class. The estimated least squares coefficients on log class size turn out to be statistically significant, positive, and quantitatively important in Hong Kong, Japan, and Singapore. They are statistically insignificant or quantitatively negligible in Thailand and South Korea.
Taking these results at face value, we find that higher test score is positively associated with larger class size in three East Asian countries (and unrelated with class size in the other two countries). For instance, the estimated coefficient for science in Hong Kong would imply
that a 10 percent increase in class size goes hand in hand with an increase in student
performance by about 17 test score points. In the case of Hong Kong, a difference of 17 test score points roughly equals the average test score point difference of half a year of schooling. So the reported result is quantitatively important. Interpreting statistically significant least squares coefficients as causal effects, as much previous work for other countries has done
Figure 3: Least Square Estimates of the Effect of Class Size on Student Performancea -0.7 0.8 14.1 8.7 17.5 0.8 -0.3 13.7 12.4 10.6 -2 0 2 4 6 8 10 12 14 16 18 20 Thailand South Korea Singapore Japan Hong Kong
Test score difference for a 10 percent increase in class size
b
c
science math
Notes:
a) The estimates are statistically significantly different from zero at the 5 percent level unless noted otherwise. b) The estimate for math is statistically not significantly different from zero.
c) Both estimates are statistically not significantly different from zero.
(e.g., Hanushek 1997; Krueger 2003), one would have to conclude that students seem to learn more in larger classes rather than in smaller classes in some East Asian countries.
One reason why the least squares estimates in Figure 3 are misleading is that student performance, T, affects class size, for instance if either above-average performing students or below-average performing students are systematically sorted into smaller classes. The above estimates of class size effect would also pick up the correlation between student performance and any omitted variable that is correlated with schooling resources In both cases, unbiased econometric estimates can only result if the endogeneity of schooling resources is properly accounted for (Hoxby 2000).
The endogenous nature of class size can result from sorting at two different levels. Students with different performance may be sorted into classes of different size within a given school, or they may be sorted into different types of schools with different class sizes. The latter mainly happens in schooling systems where students of a certain grade are tracked into different schools according to their ability (as is the case in Singapore). Both possibilities have to be controlled for to identify the true (unbiased) effects of class size on student performance.
In order to exclude any effects of either within- or between-school sorting from the true performance effect of class size, Woessmann and West (2002) suggest an identification strategy specifically designed to exploit the multi-grade nature of the TIMSS database. They combine a specific instrumental variables (IV) strategy suggested by Akerhielm (1995) with a school-fixed-effects estimation. Their combined school-fixed-effects instrumental-variables (SFE-IV) estimation equation, which we also employ here, is:
(4) Tics =Bicsα3 +Cˆcsβ2+Ssϕ1+εics,
where Ss is a complete set of school dummies and Cˆcs is the result of a first-stage regression
that instruments actual class size by grade-average class size.
Equation (4) relates idiosyncratic variation in student performance from each individual school to that part of the actual class-size difference between the two grades that is due to differences in average class size between the two grades that are included in the TIMSS data base, namely the seventh and the eighth grade. Thereby, the SFE-IV identification strategy effectively excludes both between-school and within-school sources of student sorting. The effects of between-school sorting are eliminated by controlling for school fixed effects through the dummy variable S; and the effects of within-school sorting are eliminated by instrumenting actual class sizes by grade-average class size. Arguably, the remaining variation in class size between classes at different grades of a school is caused by random fluctuations in cohort sizes between the two adjacent grades in each school, presumably reflecting natural fluctuations in student enrollment. The coefficient estimate β2 in equation (4) can thus be interpreted as an unbiased estimate of the causal impact of class size on student performance.
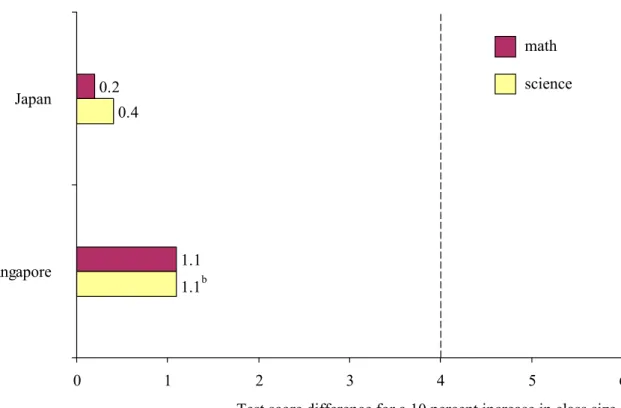
The SFE-IV estimation is extremely demanding in terms of data requirements, because the variation on which it is based excludes both any between-school variation in class size and any within-grade variation in class size within schools. If the remaining within-school between-grade variation in class size is low, this will necessarily result in imprecise estimates of the class-size coefficient. In our sample of East Asian countries, this apparently happens for Hong Kong and Thailand, where the standard errors of the SFE-IV estimates are too large to allow for any confident statement about the quantitative relevance of class-size effects. By contrast, the SFE-IV estimates are very precise for Japan and Singapore, with relatively small standard errors. The standard errors are in fact so small that if a reduction in class size of 10 percent were to change student performance by just 4 to 6 test-score points, such a change would show up as statistically significant at the 5 percent level.
However, our SFE-IV estimates of the causal effect of class size on student performance are substantially smaller than this statistical benchmark in both math and science in Japan and Singapore (Figure 4). Due to their low standard errors, our estimates are found to be statistically significantly different from the benchmark case of a change of 4-6 test score points, but they are not statistically different from zero. Given the statistical precision of our estimates, they resemble what Hoxby (2000, p. 1280) calls “rather precisely estimated zeros.” Hence our results suggest that there is definitely no causal effect of class size on student performance in Japan and Singapore, whereas our coefficient estimates for Hong Kong, South Korea, and Thailand (which are also statistically not different from zero) are too imprecisely estimated to allow for a clear-cut assessment.
Our cross section results confirm previous time series evidence on the missing link between schooling resources and student performance in selected East Asian countries (Gundlach and Woessmann 2001). In that paper, we developed a measure of the change in schooling expenditure per student. Notwithstanding quantitative differences across the selected East Asian countries, we found that deflated public expenditures per student in general increased substantially faster than an index of deflated expenditures per unit of output of other services with inherently low productivity growth. Such a finding implies that the productivity of schooling declined in East Asian countries, given that the quality of a unit of schooling output did not improve.
We measured potential changes in the quality of schooling output by changes in the performance of pupils in internationally standardized tests of cognitive achievement in 1980
Figure 4: The Unbiased Effect of Class Size on Student Performancea 0.4 1.1b 1.1 0.2 0 1 2 3 4 5 6 Singapore Japan
Test score difference for a 10 percent increase in class size math
science
Notes:
a) All estimates statistically not different from zero but statistically different from a test score difference of more than 4-6 points.
b) Statistically different from a test score difference of more than 6 points.
and in 1994. Using alternative statistical assumptions about the mean and the standard deviation of the available test results, we were able to construct an index of changes in the performance of students from selected East Asian countries overt time. Neglecting minor improvements and deteriorations, we found that average student performance, and hence the quality of schooling output, largely remained unchanged in Hong Kong, Japan, Singapore, South Korea, and Thailand.
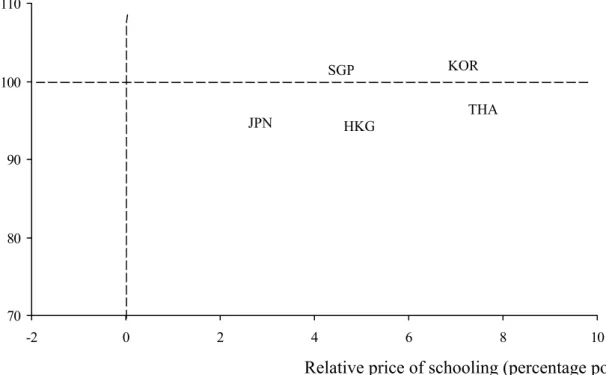
Figure 5 summarizes our previous time series results on the missing link between schooling resources and student performance. The vertical axis shows our estimates of changes in student performance over time. As is evident, relative to 1980 there is not much variation in the East Asian countries considered. The horizontal axis shows our estimates of the change in the price of schooling relative to the change in the price of other services with low productivity growth, which is our proxy for the change in real schooling expenditure per student. Under an efficient allocation of resources, one would probably expect to find an upward-sloping line through the point where the index of changes in the quality of schooling output is equal to 100 (no change) and the change in the relative price of schooling is zero (no change). Yet no such picture emerges in Figure 5.
Recalling that the increase in the relative price of schooling mirrors an over-proportionate increase in schooling resources, generously rising schooling expenditures apparently did not generate strong performance effects in the countries concerned.6 These findings support the
Figure 5: Changes in the Quality of Schooling Outputa and in the Relative Price of Schoolingb, 1980-1994 70 80 90 100 110 -2 0 2 4 6 8 10
Relative price of schooling (percentage poin KOR
HKG
THA SGP
JPN Quality of schooling output (1980=100)
Notes:
a) Index based on average math and science test results in standardized international tests of student performance.
b) Average annual rate of change of the price of schooling minus the average annual rate of change of the average of deflators for government services and for community, social, and personal services.
c) HKG: Hong Kong; JPN: Japan; SGP: Singapore; KOR: South Korea; THA: Thailand. d) Source: Adapted from Gundlach and Woessmann (2001).
view that a rising relative price of schooling in East Asian countries reflects declining schooling productivity, and not an improvement in student performance. As it turns out, the main reason for the decline of schooling productivity within East Asian countries appears to be a decline in class size, which did not lead to a corresponding increase in student performance.7 Since our times series results mirror exactly our cross section results for Japan
and Singapore presented in Figure 4, it is tempting to conclude that our imprecisely estimated unbiased class size effects for Hong Kong, South Korea, and Thailand also reflect the missing link between schooling resources and student performance.
4. Institutional Features as Determinants of Student Performance
The missing evidence for a consistent link between schooling resources and student performance suggests that resources are inefficiently used in the school systems of East Asian countries. In other countries, such inefficiencies have been related to the lack of suitable performance incentives in the school system (e.g., Hanushek et al. 1994). If missing
Figure 6: Institutional Features and Student Performance in Math -62.0a -10.3 -13.9 4.2 18.2 0.1 60.4a 64.1a 0.5 -70 -60 -50 -40 -30 -20 -10 0 10 20 30 40 50 60 70 Thailand South Korea Singapore Japan Hong Kong
Test score difference Salary autonomy of schools
Disinterested parents influence teaching
Note:
a) Statistically significant coefficient estimate.
incentives to increase performance or to save on cost explain the missing resource-performance link, schooling policies that focus on institutional features of the schooling system rather than on resources are more likely to affect student performance. Economic theory would suggests that the institutional structure of the school system generates the very incentives that drive the behavior of all actors in educational production and thus the performance that students achieve and the level of resources that schools receive (see Bishop and Woessmann 2003).
Since institutional features generally do not vary substantially within school systems, the empirical effect of schooling institutions on student performance should naturally be studied in a cross-country rather than in a within-country context. Along these lines, Woessmann (2003a) shows that many schooling institutions (and especially the presence of central exams) are indeed strongly linked to the cross-country variation in student performance. However, the TIMSS background data reveal that some institutional features do also vary within some schooling systems. Institutional features that vary within East Asian countries are, for instance, the autonomy of schools in salary decisions and the parental involvement in the education process. Hence in this section we try to see whether such within-country differences in institutional features of the school systems add to an understanding of the within-country differences in student performance.
Since institutional features of the school systems appear to be exogenous to student performance, reasonable estimates of institutional effects may be obtained by least squares estimates of the education production function
(5) Tics =Bicsα4 +Rcsβ3+Icsγ1+εics,
which simply adds a vector of institutional measures I as explanatory variables to the previous education production function (3). In equation (5), the coefficient vector γ1 is expected to measure effects of institutional features of the school system on student performance. In this specification, the estimated effects of resource variables may be biased due to sorting effects as discussed in the previous section. However, the estimated coefficients on the institutional variables, which are of interest in this section, do not change once we exclude the resource variables from the specification. Hence our estimates appear to be robust against a potential bias arising from the inclusion of the endogenous resource variables.
Our coefficient estimates of the performance effects of salary autonomy and parental involvement are reported in Figure 6, which focuses on our results in math.8 Overall, we only
find limited empirical evidence for the impact of institutional features on student performance. This result most likely reflects the relatively low degree of within-country variation in institutional features, which would result in statistically insignificant coefficient estimates in a regression equation that also includes control variables for family background and schooling resources.
What we find is that in Japan and Singapore, students in schools with autonomy in determining the salaries of their teachers performed statistically significantly better in math and in science (not reported) than students in schools without salary autonomy. For Singapore, the estimated test score difference is comparable in size to about two thirds of the estimated test score difference of family background. For Hong Kong, we find that students whose teachers reported that their teaching was limited by uninterested parents performed statistically significantly worse than students whose teachers did not report limitations by uninterested parents. The absolute size of this effect is estimated to be about as large as the effect of family background on student performance in Hong Kong. For the other East Asian countries, we do not find statistically significant effects of institutional features on student performance.
5. Conclusions
Given the pivotal role of education for the future economic prospects of societies, our empirical results for five high-performing East Asian countries could have substantial implications for educational and social policies in the region and in other parts of the world as well. In this paper, we show how family background, schooling resources, and institutional features matter for student performance and how the impact of these variables differs across East Asian schooling systems. By identifying the factors that may be responsible for the success of East Asian students in international comparisons of cognitive achievement, our results may offer insights for educational reform in other countries.
Although the fact that most East Asian countries performed extraordinarily well in international comparisons of student performance seems to suggest that they are very homogenous, our empirical evidence reveals that their schooling systems actually feature a lot of heterogeneity. For example, family background is a much stronger predictor of children’s educational performance in South Korea than in the other countries considered, especially when measured relative to the average effect of one additional year of schooling (which, in turn, is substantially higher in Singapore than in the other East Asian countries considered). The different size of family-background effects across countries implies that the different
schooling systems differ with respect to the opportunities for successful learning independent of parental education and social status.
The high educational performance of East Asian countries also suggests that their schooling systems are highly productive. While this is true in the sense of a cross-country comparison between East Asian countries and countries from other parts of the world, the internal productivity of East Asian school systems appears to be less clear. For instance, we show that that there is no evidence for a consistent positive effect of smaller classes on student performance in East Asian countries. As in many other countries in the world, East Asian schools that are better equipped with educational resources apparently do not make productive use of the additional resources. This within-country cross-sectional finding mirrors the time-series evidence presented in an earlier study (Gundlach and Woessmann 2001), where we showed that higher schooling expenditure resulting in smaller class sizes did not lead to a substantially improved student performance in East Asian countries.
With respect to institutional features of East Asian schooling systems, we find that school autonomy in the salary decisions strengthens student performance in Japan and Singapore. Given that performance standards are centrally set and examined in all the East Asian systems considered, additional autonomy might allow schools to find the best ways of how to achieve these standards. Overall, however, the within-country variation in institutional features of school systems appears to be too small to allow for estimating statistically significant effects. To identify the impact of schooling institutions on student performance, cross country estimates are likely to provide more substantial insights (Woessmann 2003a).
It remains to be seen whether the conclusions of this paper also apply for other subjects and skills than middle-school mastery of math and science. Some evidence suggests that East Asian students are not just capable of rote learning, as a going prejudice has it, but also do well in more creative tasks. Learning the cognitive foundations is certainly a prerequisite for the mastery of more advanced applications, so that the two appear to be complements rather than substitutes. To sustain the quality of this knowledge base and to tap the full potential of their student populations, East Asian school systems should aim at ensuring equal opportunities to education for students from all family backgrounds without compromising on the quality of education. Rather than focusing on additional schooling resources to achieve this goal, implementing educational policies that ensure efficient educational production appears to be a more promising alternative.
References
Akerhielm, Karen (1995), “Does Class Size Matter?” Economics of Education Review 14 (3): 229-241.
Beaton, Albert E., Michael O. Martin, Ina V.S. Mullis, Eugenio J. Gonzalez, Teresa A. Smith,
Dana L. Kelly (1996a), Science Achievement in the Middle School Years: IEA's Third
International Mathematics and Science Study (TIMSS). Chestnut Hill, MA: Boston College.
Beaton, Albert E., Ina V.S. Mullis, Michael O. Martin, Eugenio J. Gonzalez, Dana L. Kelly,
Teresa A. Smith (1996b), Mathematics Achievement in the Middle School Years: IEA's
Third International Mathematics and Science Study (TIMSS). Chestnut Hill, MA: Boston College.
Bishop, John H., Ludger Wößmann (2003), Institutional Effects in a Simple Model of
Educational Production. Education Economics (forthcoming) (Kiel Institute for World
Deaton, Angus (1997), The Analysis of Household Surveys: A Microeconometric Approach to Development Policy. Baltimore: The Johns Hopkins University Press.
DuMouchel, William H., Greg J. Duncan (1983), Using Sample Survey Weights in Multiple Regression Analyses of Stratified Samples. Journal of the American Statistical Association
78 (383): 535-543.
Gundlach, Erich, Ludger Wößmann (2001), The Fading Productivity of Schooling in East Asia. Journal of Asian Economics 12 (3): 401-417.
Gundlach, Erich, Ludger Wößmann, Jens Gmelin (2001), The Decline of Schooling Productivity in OECD Countries. Economic Journal, 111 (May): C135-C147.
Hanushek, Eric A. (1997). Assessing the Effects of School Resources on Student Performance: An Update. Educational Evaluation and Policy Analysis 19 (2): 141-164. Hanushek, Eric A., with Charles S. Benson, Richard B. Freeman, Dean T. Jamison, Henry M.
Levin, Rebecca A. Maynard, Richard J. Murnane, Steven G. Rivkin, Richard H. Sabot,
Lewis C. Solmon, Anita A. Summers, Finis Welch, Barbara L. Wolfe (1994), Making
Schools Work: Improving Performance and Controlling Costs. Washington, D.C.: The Brookings Institution.
Hoxby, Caroline M. (2000), The Effects of Class Size on Student Achievement: New Evidence from Population Variation. Quarterly Journal of Economics 115 (4): 1239-1285.
Krueger, Alan B. (2003), Economic Considerations and Class Size. Economic Journal 113
(485): F34-F63.
Lee, Jong-Wha, Robert J. Barro (2001), Schooling Quality in a Cross-Section of Countries.
Economica 68 (272): 465-488.
Martin, Michael O., Dana L. Kelly, eds. (1998), TIMSS Technical Report Volume II:
Implementation and Analysis, Primary and Middle School Years. Chestnut Hill, MA: Boston College.
Moulton, Brent R. (1986), Random Group Effects and the Precision of Regression Estimates.
Journal of Econometrics 32 (3): 385-397.
Wooldridge, Jeffrey M. (2001), Asymptotic Properties of Weighted M-Estimators for
Standard Stratified Samples. Econometric Theory 17 (2): 451-470.
Woessmann, Ludger (2003a), Schooling Resources, Educational Institutions, and Student Performance: The International Evidence. Oxford Bulletin of Economics and Statistics 65 (2): forthcoming.
Wößmann, Ludger (2003b), Educational Production in East Asia: The Impact of Family Background and Schooling Policies on Student Performance. Kiel Institute for World Economics, Working Papers, March, (forthcoming).
Woessmann,Ludger, Martin R. West (2002), Class-Size Effects in School Systems Around the World: Evidence from Between-Grade Variation in TIMSS. Program on Education Policy and Governance Research Paper PEPG/02-02. Cambridge, MA: Harvard University.