A Case Study of Traffic Locality in Internet P2P Live Streaming Systems
Yao Liu
1, Lei Guo
2, Fei Li
1, and Songqing Chen
1 1Dept. of Computer Science
2Yahoo! Inc.
George Mason University
Sunnyvale, California, USA
{
yliud, lifei, sqchen
}
@cs.gmu.edu
[email protected]
Abstract
With the ever-increasing P2P Internet traffic, recently much attention has been paid to the topology mismatch between the P2P overlay and the underlying network due to the large amount of cross-ISP traffic. Mainly focusing on BitTorrent-like file sharing systems, several recent studies have demonstrated how to efficiently bridge the overlay and the underlying network by leveraging the existing infrastruc-ture, such as CDN services or developing new application-ISP interfaces, such as P4P. However, so far the traffic locality in existing P2P live streaming systems has not been well studied.
In this work, taking PPLive as an example, we examine traffic locality in Internet P2P streaming systems. Our mea-surement results on both popular and unpopular channels from various locations show that current PPLive traffic is highly localized at the ISP level. In particular, we find: (1) a PPLive peer mainly obtains peer lists referred by its connected neighbors (rather than tracker servers) and up to 90% of listed peers are from the same ISP as the requesting peer; (2) the major portion of the streaming traffic received by a requesting peer (up to 88% in popular channels) is served by peers in the same ISP as the requestor; (3) the top 10% of the connected peers provide most (about 70%) of the requested streaming data and these top peers have smaller RTT to the requesting peer. Our study reveals that without using any topology information or demanding any infrastructure support, PPLive achieves such high ISP level traffic locality spontaneously with its decentralized, latency based, neighbor referral peer selection strategy. These find-ings provide some new insights for better understanding and optimizing the network- and user-level performance in practical P2P live streaming systems.
1. Introduction
Nowadays Internet P2P applications are very popular, such as Skype-like VoIP [1], BitTorrent-like file sharing [2], PPlive-like streaming [3], SETI@home computing [4]. As a result, P2P traffic has become dominant on the Internet today. According to the CacheLogic, today P2P traffic has accounted for over 65% of the Internet traffic [5].
While these P2P systems have gained practical and wide usage as well as having attracted significant attention from
the research community to further improve their perfor-mance [6], [7], [8], [9], [10], [11], [12], concerns have been raised on the deficiency of the Internet resource utilization in these systems, due to the blind design of their over-lay structures without considering the underlying network topology, which is often referred to as underlay. On one hand, this increases the cross-ISP traffic and potentially wastes a significant amount of Internet bandwidth because some data transmissions could have been done more ef-ficiently. As a result, P2P traffic is often constrained or even blocked by some ISPs. For example, Comcast, a well-known broadband ISP, has started to throttle BitTorrent traffic since last year and made it impossible for subscribers to provide seeding services in its network [13]. On the other hand, for routing/relay based P2P applications that are latency sensitive, blindly making connections between peers without considering the underlying physical topology may significantly degrade the user perceived performance because two neighboring peers on the overlay could be far from each other on the underlay, even could be physically connected transoceanically. Transmissions between such a pair of nodes are not efficient since nearby peers could provide a better service.
To address this topology mismatch issue, which some-times is also referred to as traffic locality, a number of studies have been performed to show the potentials of bridging the overlay and the underlying network. For ex-ample, Bindal et al. [14] proposed to improve the traffic locality in BitTorrent systems via biased neighbor selection enforced by packet control mechanisms on border gateway routers. More recently, Ono [15] proposed to leverage the existing CDN infrastructure to estimate the distance between BitTorrent peers before making peer connections. P4P [16], instead, aimed to provide a general framework for P2P applications by developing ISP-application interfaces so that application software can use the network layer information, such as congestion status and network topology, for better performance and resource utilization.
These studies have mainly focused on P2P file sharing systems such as BitTorrent. However, the traffic locality in existing P2P streaming systems has not yet been well studied though P2P streaming contributes a significant portion to the Internet traffic. In this study, we set to examine the severity of topology mismatch in practical P2P streaming systems by taking PPLive live streaming, one of the largest P2P streaming network in the world, as an example. We
conduct a 4-week measurement of popular and unpopular live streaming channels. Because most PPLive users are based in China, we conduct measurements by placing our probing clients in different ISPs in China and USA. Our measurement results show that current PPLive traffic is highly localized at the ISP level, with a simple decentralized, latency based peer selection strategy through the referral of directly connected neighbors. Details of our findings will be presented in later sections, but the major highlights are as follows:
• after the bootstrap, a peer in PPLive periodically probes
its neighbors to get a list of their neighbors, and mainly connects to peers referred by these neighbors rather than the tracker servers;
• overall, about 40%-90% of peers on the returned peer
lists belong to the same ISP as the requesting peer for unpopular and popular channels, indicating the requesting peer is more likely to connect with peers in the same ISP;
• as a result, the major portion (up to 88%) of a peer’s
downloaded streaming traffic in popular channels is served by peers in the same ISP;
• peers from the same ISP respond faster to the
request-ing peer than other peers do, and a peer always tries to connect to the listed peers as soon as the list is received, indicating a latency based neighbor selection policy;
• both the number of data requests to the neighbors and
their corresponding data contributions to a requesting peer follow stretched exponential distributions. In par-ticular, the top 10% of the connected peers provide about 70% of the requested streaming data. Further-more, the top connected peers have smaller RTT to the requestor.
Our study shows that PPLive achieves such high traffic locality at the ISP level spontaneously without using any topology information and without any infrastructure support. The decentralized, neighbor referral based peer selection strategy leads to an iterative “triangle construction” [17] of PPLive overlays, on which PPLive peers are self-organized into highly connected clusters. These clusters are highly localized at the ISP level and result in high traffic locality. This overlay construction in PPLive not only eliminates the “single-point-of-failure” in P2P networks, but also au-tomatically resolves the topology mapping issue to achieve high user performance and efficient bandwidth consumption. In contrast, the tracker based peer selection strategy in BitTorrent often causes unnecessary bandwidth waste due to the mismatch between underlay and overlay. Although the “tit-for-tat” incentive mechanism of BitTorrent is very effective, the lack of knowledge on the network distances to their neighboring candidates prevents BitTorrent peers from connecting with each other more efficiently. Furthermore, the performance bottleneck of BitTorrent trackers also lim-its the number of neighboring candidates a peer can get, especially for large networks.
While the results show that currently PPLive has achieved
strong ISP level traffic locality, however, for unpopular chan-nels, our results also indicate that efforts are still needed to improve the traffic locality for more efficient P2P streaming. In addition, our workload characterization also provides a basis to generate practical P2P streaming workloads for simulation based studies.
The remainder of the paper is organized as follows. Section 2 presents some protocol details of PPLive we used in this study. Section 3 presents the results from our workload analysis. Section 4 presents some related work and we make concluding remarks in Section 5.
2. Overview of PPLive
PPlive is a free P2P-based IPTV application, supporting both live streaming and on-demand streaming services. As one of the earliest and largest P2P-based streaming system, it provides more than 150 live streaming channels and attract millions of online users every day [3]. Since PPLive imple-ments a proprietary protocol and keeps updating its protocol, the availability of its detailed mechanisms is very limited and varying from time to time. In this section, we first describe some of PPLive protocol information we obtained through reverse engineering based on a large amount of local and Internet experiments performed with PPLive1.9.
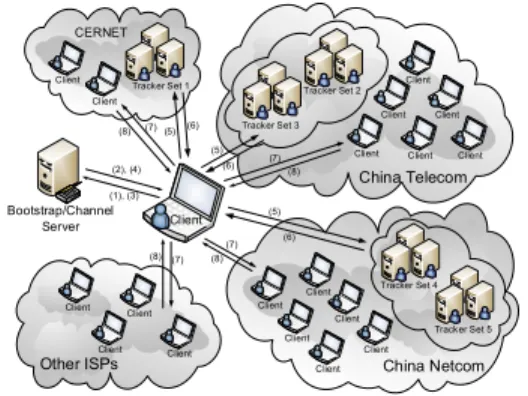
China Telecom Bootstrap/Channel Server (1), (3) (2), (4) (5)(6) (5) (7) (8) CERNET China Netcom (6) Other ISPs Client Client Client Tracker Set 4 Tracker Set 5 Client Client Client Client Client Client Tracker Set 2 Tracker Set 3 Client Client Client Client Client Client (5) (6) (7) (8) Tracker Set 1 Client Client (7) (8) Client Client (7) (8)
Figure 1. PPLive bootstrap and peer contact Once a PPLive client (and “client” hereafter) is launched, the client will make several DNS queries to get several
servers’ IP addresses. One of the servers is the bootstrap
server, which is often referred to as thechannel server as well. Upon an initial contact from a client, the bootstrap server will return the requesting peer with an active channel list, which is shown as step (1) and step (2) in Figure 1. This is to let the user select which program he/she is interested in.
After a desired program is chosen, the client would again query the bootstrap server for the program’s playlink, and tracker server information to join the network of this channel, shown as step (3) and (4) in the figure. The tracker server stores the active peers for each channel. Our measurement shows that there are five groups of tracker servers, deployed at different locations in China. Typically,
the client would receive one tracker server IP address for each of the five groups, respectively. It then queries the tracker servers for active peer lists. Once the client receives a peer list, it randomly selects a number of peers from the list and connects to them immediately. Upon the establishment of a new connection, the client will first ask the newly connected peer for its peer list, which consists of the connected peer’s own connected neighbors, then the client would request video data from that peer. During the playback, the client queries both the connected neighbors and the tracker servers for new peer lists. However, different from BitTorrent networks, where peers get to know each other and make connections through the tracker only, the tracker in a PPLive network mainly works as an entry node for a peer to join the network. Once achieving satisfactory playback performance through its neighbors in the network, a peer significantly reduces the frequency of querying tracker servers to once every five minutes. It mainly connects to new peers referred by its neighbors in the network. According to our measurements, a peer periodically queries its neighbors for more active peers once every 20 seconds, by sending the peer list maintained by itself. Upon receiving such a request (with peer list enclosed), the neighbor replies a list of peers it maintains. A peer list usually contains no more than 60 IP addresses of peers. These are shown as steps (5)-(8). To facilitate timely transmission and efficient data sharing among peers, a video file is divided into smaller chunks, which may be further divided into smaller sub-pieces of 1380 or 690 bytes each.
3. Measurement and Results Analysis
PPLive supports both live streaming and on-demand streaming. In this study, we focus on its live streaming applications. In this section, we present our analysis results from several typical workloads. Before that, we first briefly present our measurement methodology.
3.1. Measurement methodology
The distribution of PPLive network is mainly in China because the majority of its users are from China. Since its protocol is proprietary, in order to measure the traffic local-ity, we have deployed 6 hosts residing in different ISPs in China and 2 hosts on a university campus network in USA. We use PPLive1.9 and have all these clients join the PPLive live streaming programs simultaneously. PPLive currently rates different programs mainly based on the number of user accesses. Both popular and unpopular programs were measured during peak and non-peak hours by collecting all incoming and outgoing packets at the deployed hosts with Wireshark [18]. The data presented in this study is collected from Oct. 11th to Nov. 7th 2008, a total of four weeks.
For the two major ISPs in China, ChinaTelecom and ChinaNetcom, which cover most residential users in China, we have deployed two clients in each of them. We have also
deployed two clients in CERNET, a special ISP called China Education and Research Network, which covers nearly all university campus users. Similarly, we collect data from two clients deployed on campus network of George Mason University, USA.
In the 4-week data collection period, we have collected more than 130 GB UDP data. Note PPLive mainly uses UDP since April 2007 [19]. Analyzing packet exchanges among peers, we extract information about each connection, the peer lists returned by tracker servers and regular peers, the actually connected peers, and the traffic volume transferred, etc. For data requests and replies, we match them based on the IP addresses and transmission sub-piece sequence numbers. For peer list requests and replies, since a client would send its own peer list when requesting new peer lists, we match the peer list reply to the latest request designated to the same IP address. To get the ISP information for each IP address, we generate AS-Name information from our extracted peer IP addresses using the IP to ASN Mapping service provided by Team Cymru group [20].
In the remainder of this paper, we have the following
notations for ISPs. TELE represents ChinaTelecom, CNC
represents ChinaNetcom,CERis short for CERNET,OTHER
represents any ISPs observed that do not belong to the above three ISPs. This includes smaller ISPs in China, such as China Unicom Network and China Railway Internet,
labeled as OtherCN, and ISPs from other countries, labeled
as “Foreign”, since PPLive has a large number of users outside China as well.
3.2. A peer’s downloaded traffic is mostly from
peers in the same ISP
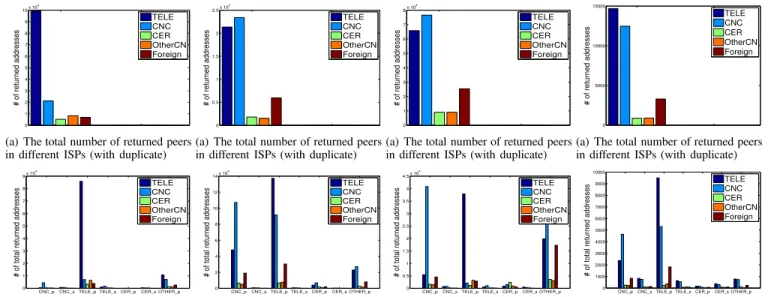
In PPLive, a peer participating in live streaming obtains peer lists from connected neighbors and PPLive tracker servers during the playback. Once a peer list is received, a peer will randomly select some peers from the list to connect with and to request data from. Figure 2 shows the ISP-level results when a residential TELE node in China was viewing a popular live streaming program using ADSL, starting from 8:30 PM on Oct. 27 and lasting for a duration of 2 hours. Based on [21], this is the peak time for PPLive users in China.
Figure 2(a) shows the total number of peer IP addresses obtained by this TELE host in two hours grouped based on their ISPs. As aforementioned, upon receiving a request, a normal peer returns its recently connected peers. Each peer list includes up to 60 unique IP addresses. During the playback, there are many duplicated IP addresses on the returned peer lists returned by the same neighbor at different times. This also applies to the PPLive tracker servers. In addition, different neighbors may also return the same IP address, and a normal peer and a tracker server may return the same IP address. The returned peer IP addresses are potential neighbors for a client to connect with. Figure 2(a) clearly shows that the majority (about 100 thousands and
0 1 2 3 4 5 6 7 8 9 10x 10 4 # of returned addresses TELE CNC CER OtherCN Foreign
(a) The total number of returned peers in different ISPs (with duplicate)
CNC_pCNC_sTELE_p TELE_sCER_p CER_s OTHER_p 0 1 2 3 4 5 6 7 8 9x 10 4
# of total returned addresses
TELE CNC CER OtherCN Foreign
(b) The number of peers returned from normal peers and tracker servers in different ISPs (with duplicate)
TELE CNC CER OtherCN Foreign 0 1 2 3x 10 5 # of data transmissions
TELE CNC CER OtherCN Foreign 0 1 2 3x 10 8 # of bytes
(c) The total data transmissions (up) and downloaded traffic (bottom) from peers in different ISPs
Figure 2. A China-TELE
node viewing a popular pro-gram 0 0.5 1 1.5 2 2.5x 10 5 # of returned addresses TELE CNC CER OtherCN Foreign
(a) The total number of returned peers in different ISPs (with duplicate)
CNC_pCNC_sTELE_p TELE_sCER_pCER_s OTHER_p 0 2 4 6 8 10 12 14x 10 4
# of total returned addresses
TELE CNC CER OtherCN Foreign
(b) The number of peers returned from normal peers and tracker servers in different ISPs (with duplicate)
TELE CNC CER OtherCNForeign 0 0.5 1 1.5 2x 10 5 # of data transmissions
TELE CNC CER OtherCNForeign 0 0.5 1 1.5 2x 10 8 # of bytes
(c) The total data transmissions (up) and downloaded traffic (bottom) from peers in different ISPs
Figure 3. A China-TELE
node viewing an unpopular program 0 1 2 3 4 5 6 7 8x 10 4 # of returned addresses TELE CNC CER OtherCN Foreign
(a) The total number of returned peers in different ISPs (with duplicate)
CNC_pCNC_sTELE_p TELE_sCER_pCER_s OTHER_p 0 0.5 1 1.5 2 2.5 3 3.5 4 4.5x 10 4
# of total returned addresses
TELE CNC CER OtherCN Foreign
(b) The number of peers returned from normal peers and tracker servers in different ISPs (with duplicate)
TELE CNC CER OtherCN Foreign 0 0.5 1 1.5 2x 10 5 # of data transmissions
TELE CNC CER OtherCN Foreign 0 0.5 1 1.5 2x 10 8 # of bytes
(c) The total data transmissions (up) and downloaded traffic (bottom) from peers in different ISPs
Figure 4. A USA-Mason
node viewing a popular pro-gram 0 5000 10000 15000 # of returned addresses TELE CNC CER OtherCN Foreign
(a) The total number of returned peers in different ISPs (with duplicate)
CNC_pCNC_s TELE_p TELE_s CER_pCER_s OTHER_p 0 1000 2000 3000 4000 5000 6000 7000 8000 9000 10000
# of total returned addresses
TELE CNC CER OtherCN Foreign
(b) The number of peers returned from normal peers and tracker servers in different ISPs (with duplicate)
TELE CNC CER OtherCN Foreign 0 1 2 3x 10 5 # of data transmissions
TELE CNC CER OtherCN Foreign 0 1 2 3x 10 8 # of bytes
(c) The total data transmissions (up) and downloaded traffic (bottom) from peers in different ISPs
Figure 5. A USA-Mason
node viewing an unpopular program
about 70% of total) of obtained IPs in these two hours belong to TELE, the same as our probing host.
Since a peer keeps requesting peer lists from connected neighbors and tracker servers during the playback, Fig-ure 2(b) further shows the number of IP addresses received from different sources. In Figure 2(b), “CNC p” represents the total number of IP addresses returned by regular CNC peers, while “CNC s” represents the IPs returned by the PPLive’s tracker servers deployed in CNC. Similar notations are used for TELE and CER. Since PPLive does not deploy tracker servers in other ISPs (to the best of our knowledge through reverse engineering), there is no “OTHER s” shown in the figure. This figure shows that most of returned peers are from connected peers of our TELE host, not from the tracker servers. In addition, there are only a few active CER users in entertainment streaming around this time. The results indicate that the tracker servers are databases of active peers rather than for locality.
While Figures 2(a) and (b) show the potential locality of our TELE host, the up of Figure 2(c) shows the number of
data transmissions between our TELE host and connected peers in different ISPs, and the bottom of Figure 2(c) shows the streaming data downloaded from peers in different ISPs. A data transmission consists of a pair of data request and reply. In two hours, we observe that most (over 85%) of the data transmissions to our TELE host are from peers in the same ISP, and more than 85% of the streaming data (in number of bytes) requested by our TELE host is actually uploaded by TELE peers, indicating strong traffic locality at the ISP level in popular programs.
Figure 2 shows the locality in a popular PPLive program. In an unpopular program, it is likely that the peer locality and traffic locality may not be as good as these in a popular program. Figure 3 further shows the ISP-level results when our another TELE host was watching an unpopular program at the same time.
In sharp contrast to Figures 2(a), for this unpopular program, the number of returned peers from TELE and CNC are comparable, as shown in Figure 3(a), and the number from CNC is even a bit larger. However, in Figure 3(c), we
find that about 55% of data transmissions to this TELE peer are still from TELE peers, and about 55% of the downloaded streaming traffic is served by TELE peers, while the traffic downloaded from CNC peers is much smaller, about 18%. The results show that although in unpopular programs with fewer active peers, the traffic locality is still remarkably high. Figure 3(b) shows the number of returned peers from tracker servers and normal peers. The figure again confirms that a peer often gets most peer lists from neighbors in-stead of the tracker servers. Observing the situation from “CNC p” and “TELE p”, we find that a peer often returns a peer list on which most peers belong to the same ISP as the replier. Since a normal peer returns peers that they have connected with, this implicitly indicates that peers tend to connect to peers in the same ISP, which would expectantly result in high ISP level traffic locality.
Above results show the high traffic locality when viewing PPLive programs in China. In order to examine the situation outside of China, we also have our probing hosts to view the same popular and unpopular programs in USA.
Figure 4 shows the results when our university host, also referred to as the Mason host hereafter, was viewing the same popular program. Compared with Figure 2(a), Figure 4(a) shows that more peers on the returned lists are from the Foreign category. In addition, as our node is neither a CNC node nor a TELE node, the numbers of returned peer IPs from CNC and TELE are comparable. While this shows the potential locality, Figure 4(c) shows the actual locality. It shows that over 55% of the data transmissions to our host is from “Foreign” peers, and over 57% of the traffic is uploaded from “Foreign” peers. On the other hand, Figure 4(b) clearly shows that peers in CNC and TELE returned over 75% of IP addresses belonging to their same ISPs. Even the peers in OTHER return considerably more IP addresses belonging to the OTHER category.
Figure 5 shows the results when our Mason host was viewing the same unpopular program. While Figure 5(a) and Figure 5(b) indicate comparable trends as Figure 4(a) and Figure 4(b), the data transmissions requested by our Mason host are mainly to CNC peers, which also results in the most of requested streaming data being uploaded from CNC peers. We believe the reason is that there are too few “Foreign” peers watching this unpopular program.
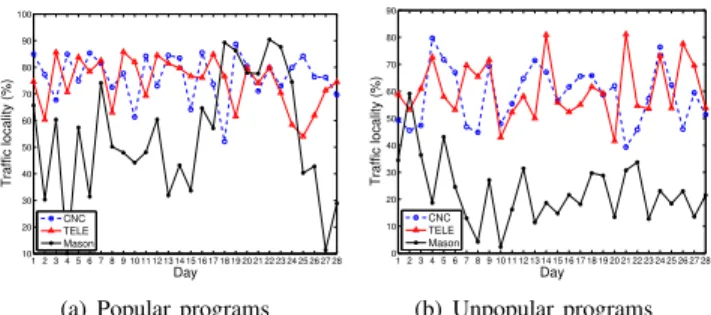
1 2 3 4 5 6 7 8 9 10 11 12 13 14 15 16 17 18 19 20 21 22 23 24 25 26 27 28 10 20 30 40 50 60 70 80 90 100 Day Traffic locality (%) CNC TELE Mason
(a) Popular programs
1 2 3 4 5 6 7 8 9 10 11 12 13 14 15 16 17 18 19 20 21 22 23 24 25 26 27 28 0 10 20 30 40 50 60 70 80 90 Day Traffic locality (%) CNC TELE Mason (b) Unpopular programs Figure 6. The traffic locality in four weeks
Figure 6 further shows the traffic locality in terms of the percentage of traffic served from peers in the same ISP to our measuring peers in the four weeks. Since we have deployed two clients in each of shown ISPs (the peers in CER are not very active and we thus omit them), the figure shows the average of two concurrent measuring results. While the measurement results from China do not vary much, the results measured from Mason vary significantly even for the popular program because the popular program in China is not necessarily popular outside China.
The above measurement results suggest strong traffic locality in PPLive, particularly for popular programs. For unpopular programs, both China hosts and USA hosts have worse traffic locality. We believe this is mainly due to the un-availability of active peers in the same ISP watching the same unpopular program at the same time.
3.3. Peers in the same ISP respond faster to a
requestor
The previous subsection indicates strong traffic locality, which can reduce cross-ISP traffic and improve the network resource utilization. However, how such high traffic locality is achieved is not clear. Since a client immediately makes new connections once it receives a returned peer list, we want to study whether peers in the same ISP would return the peer list faster than peers in a different ISP, and thus leads to traffic locality at the ISP level.
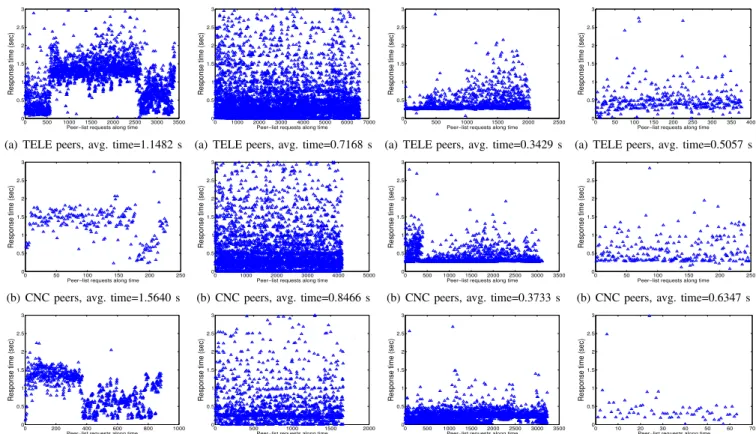
Figure 7 shows the response time to each of our TELE host’s peer-list request in two hours along the playback.
In these figures, the y-axis represents the response time in
seconds, while thex-axis represents each request along time.
The response time is defined as the duration from the time when our host sends the request to the time when the reply arrives. The response time could be affected by a number of factors, such as network congestion, the connected peer’s load and uploading bandwidth, application layer queuing delay. Overall, the response time is a good indicator on how fast the peer list could be delivered to our host. In order to examine whether the response time has any relation with the ISP level traffic locality, we separate the replies into three groups based on the replying peer’s ISP, i.e., replies from peers in TELE, CNC, and OTHER along time. Since there are not many CER peers involved, we combine CER, OtherCN and Foreign peers together in the OTHER category. When calculating the average response time, we count all response time values. But we only show those smaller than 3 seconds in figures for better visual comparisons. Comparing Figures 7 (a), (b), and (c), we can see that on average, the response time from TELE peers is 1.1482 seconds, much shorter than that of CNC peers with an average of 1.5640 seconds. But it is close to the average response time, 0.9892 seconds, of OTHER peers. However, it is noticeable that at the beginning of the playback, about 500 peer list requests were replied in less than one second from TELE peers while it often took more than one second to get replies from
0 500 1000 1500 2000 2500 3000 3500 0 0.5 1 1.5 2 2.5 3
Response time (sec)
Peer−list requests along time
(a) TELE peers, avg. time=1.1482 s
0 50 100 150 200 250 0 0.5 1 1.5 2 2.5 3
Response time (sec)
Peer−list requests along time
(b) CNC peers, avg. time=1.5640 s
0 200 400 600 800 1000 0 0.5 1 1.5 2 2.5 3
Response time (sec)
Peer−list requests along time
(c) OTHER peers, avg. time=0.9892 s Figure 7. Response time to the China-TELE node view-ing the popular program
0 1000 2000 3000 4000 5000 6000 7000 0 0.5 1 1.5 2 2.5 3
Response time (sec)
Peer−list requests along time
(a) TELE peers, avg. time=0.7168 s
0 1000 2000 3000 4000 5000 0 0.5 1 1.5 2 2.5 3
Response time (sec)
Peer−list requests along time
(b) CNC peers, avg. time=0.8466 s
0 500 1000 1500 2000 0 0.5 1 1.5 2 2.5 3
Response time (sec)
Peer−list requests along time
(c) OTHER peers, avg. time=0.9077 s Figure 8. Response time to the China-TELE node view-ing the unpopular program
0 500 1000 1500 2000 2500 0 0.5 1 1.5 2 2.5 3
Response time (sec)
Peer−list requests along time
(a) TELE peers, avg. time=0.3429 s
0 500 1000 1500 2000 2500 3000 3500 0 0.5 1 1.5 2 2.5 3
Response time (sec)
Peer−list requests along time
(b) CNC peers, avg. time=0.3733 s
0 500 1000 1500 2000 2500 3000 3500 0 0.5 1 1.5 2 2.5 3
Response time (sec)
Peer−list requests along time
(c) OTHER peers, avg. time=0.2506 s Figure 9. Response time to the USA-Mason node view-ing the popular program
0 50 100 150 200 250 300 350 400 0 0.5 1 1.5 2 2.5 3
Response time (sec)
Peer−list requests along time
(a) TELE peers, avg. time=0.5057 s
0 50 100 150 200 250 0 0.5 1 1.5 2 2.5 3
Response time (sec)
Peer−list requests along time
(b) CNC peers, avg. time=0.6347 s
0 10 20 30 40 50 60 70 0 0.5 1 1.5 2 2.5 3
Response time (sec)
Peer−list requests along time
(c) OTHER peers, avg. time=0.4690 s Figure 10. Response time to USA-Mason node view-ing the unpopular program
OTHER peers. The prolonged response time of TELE peers after this initial stage is likely due to the popularity of this program: with more users joining the program along the time after it was started, the load on each participating TELE peer increased and thus the replies took longer time. The situation changed again when the playback approached the end with users gradually leaving this channel.
When our TELE host was viewing the unpopular program, Figure 8 shows the corresponding response time results. The average response times of peers from three groups are 0.7168, 0.8466, and 0.9077 seconds for TELE, CNC, and OTHER, respectively. While we can still observe the response time of TELE peers is smaller than that of CNC peers, however, it is also clear that the latency difference is reduced, if compared with Figure 7, because this is an unpopular program with a fewer number of viewers. In addition, compared with Figure 8(a), Figure 7(a) also shows a higher average response time. This confirms that due to more peers in the popular program, a larger packet queuing delay would be expected.
When our Mason nodes were watching the same popular and unpopular programs, Figure 9 and Figure 10 show the corresponding results. As our Mason nodes belong to OTHER, we can observe for this popular program, the
average response time of OTHER peers is 0.2506 seconds, smaller than those of TELE and CNC peers, with an average of 0.3429 and 0.3733 seconds, respectively. Overall, the latency difference is still pronounced enough to make difference in peer connections.
For the unpopular program, OTHER peers also respond much faster than TELE peers and CNC peers, as shown in Figure 10, with an average of 0.4690 seconds, 0.5057 seconds, and 0.6347 seconds, respectively. As fewer peers are viewing this program, our Mason node has fewer choices in neighbor selection. Therefore, we can observe a larger average response time from different groups when compared with those in Figure 9. Note that we have also observed a non-trivial number of peer-list requests were not answered. Table 1. Average response time (s) to data requests
TELE Peers CNC Peers OTHER Peers
TELE-Popular 0.7889 1.3155 0.7052
TELE-Unpopular 0.5165 0.6911 0.6610
Mason-Popular 0.1920 0.1681 0.1890
Mason-Unpopular 0.5805 0.3589 0.1913
peer-list requests of our probing peers show that the response latency indeed impacts how peers are connected with each other, thus leading to traffic locality, Table 1 further shows the average response time to our probing host’s data re-quests. The second row in the table shows the results when our TELE host was viewing the popular program. We can see that the average response time of TELE peers is significantly less than that of CNC peers. Although it is a bit smaller than OTHER peers as well, this is due to the increased latency in the middle of the playback, similar to what we have observed in Figure 7(a). Because more TELE peers were viewing the program, the load on TELE peers is likely to be more than that on OTHER peers.
When our TELE node was viewing the unpopular channel, the third row in the table shows the average data request response time. We can see for this unpopular program (and thus fewer viewers) TELE peers respond faster than CNC peers and OTHER peers. Compared with the results when the popular program was viewed, this indicates that the program popularity plays a role in the response time.
When the Mason node was viewing the popular program, the average response time from OTHER peers is 0.1890 seconds, smaller than that of TELE peers, but not as small as that of CNC peers. On the other hand, when it was viewing the unpopular program, OTHER peers respond faster than both TELE and CNC peers significantly.
The response time to data requests further confirms that peers in the same ISP tend to respond faster, causing high ISP level traffic locality as we have observed before.
3.4. Top 10% of the connected peers provide most
of the requested traffic
At the ISP-level, our measurement results have shown that most of data transmission requests made by our measuring hosts are to peers in the same ISP. In this subsection, we further examine how these requests are distributed. In particular, we are interested in if the connected peers have made similar contributions to our hosts during the playback.
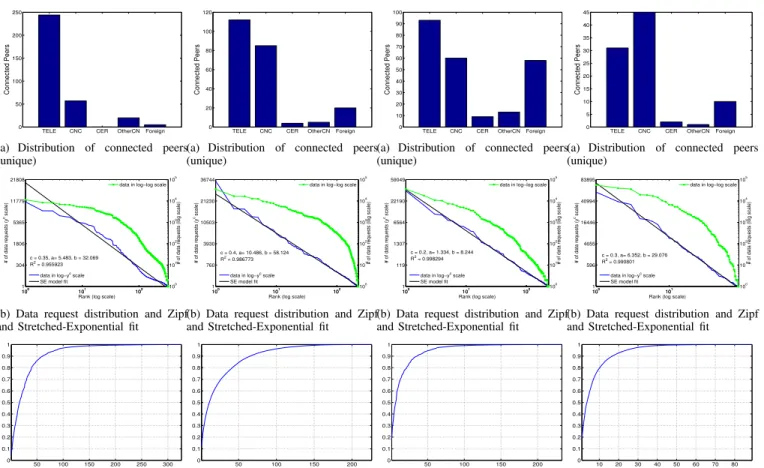
Figure 11(a) shows the number ofuniquepeers that have
been connected for data transferring in the two hours when our TELE host was viewing the popular program. The result indicates that only 326 unique peers were connected for data transmissions, among which over 74% are from TELE, indicating a highly localized peer cluster at the ISP level. Note that on the returned peer list, there are a total of 3812 unique peer IPs, among which only fewer than 9% are actually used, indicating peers are highly connected with each other during the playback.
Since the number of connected unique peers is very limited compared with the number of data transmissions that have been done (see Figure 2(c)), we are interested in how these data requests are made to each of these 326 peers. Figure 11(b) shows the number of data request distribution made by our host to each of these unique peers. Since the number of data requests made by our host show some heavy
tailed properties, we further fit them with the well-known Zipf distribution. The Zipf distribution can be expressed as
yi ∝ i− α
(1 ≤ i ≤ n), where yi is the value, i is the
rank, and α is a constant. In log-log scale, a distribution
following a Zipf-like distribution would be a straight line.
Figure 11(b) shows our fitting result. In this figure, the x
-axis is in log scale, representing rank of unique peers ordered by the number of received data requests from our host. The
right y-axis is in log scale, representing the corresponding
number of data requests. As shown in the figure, it sig-nificantly deviates from a straight-line , indicating that the data request number distribution does not follow a Zipf-like distribution. Instead, it can roughly be fitted with a
stretched exponential distribution as shown by the left y
-axis in powered (by a constant c) scale in Figure 11(b).
In the figure, R2
, the coefficient of determination of the fitting, and the corresponding parameters of the stretched exponential distribution are shown in the figure as well. We
call the combination of log scale inx-axis and powered scale
iny-axis as the stretched exponential (SE) scale.
The stretched exponential distribution has been used to characterize many natural and economic phenomena, as well as the access patterns of Internet media traffic [22]. Its corresponding CCDF function is a Weibull function. If we
rank thenelements in a data set in descending order of the
data value xi (1 ≤ i ≤ n), we have P(X ≥ xi) = i/n.
Substitute xi for yi, the rank distribution function can be
expressed as follows yc i =−alogi+b (1≤i≤n), (1) where a=xc 0 andb =y c
1. Thus, the data distribution is a
straight line in log-yc
plot. If we assumeyn= 1, we have
b= 1 +alogn. (2)
Figure 11(c) further shows the CDF of data contribution made by these peers to our host. As shown in this figure, the top 10% of the connected peers uploaded over 73% of the streaming traffic to our host during the two hours. Correspondingly, the contribution distribution can also be well fitted with a stretched-exponential distribution. We omit the fitting results for this and subsequent three workloads due to page limit.
Figure 12 shows the results when our TELE node was viewing the unpopular program. For this unpopular program, a total of 226 unique peers have been connected for data transmissions while there are a total of 463 unique IPs on returned peer lists. Figure 12(a) shows that 50% of the connected peers are from TELE as well. Our TELE node ac-tually made about 67% of its data requests to the top 10% of the connected peers for data transmissions when viewing this unpopular program. Also shown in Figure 12(b), the number of data request distribution does not follow a power-law distribution, but a stretched-exponential one. Figure 12(c) further shows CDF of the traffic contribution of these peers. Similarly, the top 10% of the connected peers have uploaded
TELE CNC CER OtherCN Foreign 0 50 100 150 200 250 Connected Peers
(a) Distribution of connected peers (unique) 100 101 102 1 304 1806 5365 11779 21808
Rank (log scale)
# of data requests (y c scale) c = 0.35, a= 5.483, b = 32.069 R2 = 0.955923 100 101 102 10 0 101 102 103 104 105
# of data requests (log scale)
data in log−yc scale
SE model fit
data in log−log scale
(b) Data request distribution and Zipf and Stretched-Exponential fit
50 100 150 200 250 300 0 0.1 0.2 0.3 0.4 0.5 0.6 0.7 0.8 0.9 1
(c) CDF of peer’s traffic contributions Figure 11. Connections and contributions to the China-TELE node viewing the pop-ular program
TELE CNC CER OtherCN Foreign 0 20 40 60 80 100 120 Connected Peers
(a) Distribution of connected peers (unique) 100 101 102 1 760 3930 10503 21230 36744
Rank (log scale)
# of data requests (y c scale) c = 0.4, a= 10.486, b = 58.124 R2 = 0.986773 100 101 102 10 0 101 102 103 104 105
# of data requests (log scale)
data in log−yc scale
SE model fit
data in log−log scale
(b) Data request distribution and Zipf and Stretched-Exponential fit
50 100 150 200 0 0.1 0.2 0.3 0.4 0.5 0.6 0.7 0.8 0.9 1
(c) CDF of peer’s traffic contribution Figure 12. Connections and contributions to the China-TELE node viewing the un-popular program
TELE CNC CER OtherCN Foreign 0 10 20 30 40 50 60 70 80 90 100 Connected Peers
(a) Distribution of connected peers (unique) 100 101 102 1 119 1307 6564 22190 59049
Rank (log scale)
# of data requests (y c scale) c = 0.2, a= 1.334, b = 8.244 R2 = 0.998294 100 101 102 10 0 101 102 103 104 105
# of data requests (log scale)
data in log−yc scale
SE model fit
data in log−log scale
(b) Data request distribution and Zipf and Stretched-Exponential fit
50 100 150 200 0 0.1 0.2 0.3 0.4 0.5 0.6 0.7 0.8 0.9 1
(c) CDF of peer’s traffic contribution Figure 13. Connections and contributions to the USA-Mason node viewing the popular program
TELE CNC CER OtherCNForeign 0 5 10 15 20 25 30 35 40 45 Connected Peers
(a) Distribution of connected peers (unique) 100 101 1 596 4655 16446 40994 83895
Rank (log scale)
# of data requests (y c scale) c = 0.3, a= 6.352, b = 29.076 R2 = 0.990801 100 101 10 0 101 102 103 104 105
# of data requests (log scale)
data in log−yc scale
SE model fit
data in log−log scale
(b) Data request distribution and Zipf and Stretched-Exponential fit
10 20 30 40 50 60 70 80 0 0.1 0.2 0.3 0.4 0.5 0.6 0.7 0.8 0.9 1
(c) CDF of peer’s traffic contribution Figure 14. Connections and contributions to the USA-Mason node viewing the un-popular program
about 67% of the total streaming data to our host in the two hours.
Figure 13 shows the results when our Mason node was viewing the same popular program. Among the total of 233 peers that have been connected for data transmissions, 58 are from “Foreign”, same as our Mason host. Although it is still fewer than the number (93) of TELE nodes, it is still a very high number considering there are significantly more viewers in China. In addition, compared with the total 3964 unique IPs from the peer lists, the result indicates a highly localized peer cluster. For this viewing, 86% of the data requests were made to the top 10% of the connected peers and Figure 13(b) shows that such a distribution can be well fitted by a stretched-exponential model, instead of a power-law one. Figure 13(c) further shows the peer’s contribution distribution. As shown in the figure, the top 10% of the connected peers uploaded over 82% of the data during the two hours to our host.
Figure 14 shows the result when our Mason node was instructed to view the same unpopular program. Not surpris-ingly, for this unpopular program, among the 89 peers that
have been connected, Figure 14(a) shows that only 10 are from “Foreign”, which is much smaller than 31 and 45 from TELE and CNC, respectively. These 89 peers account for 20% (89/429) of the unique peers on the returned peer list. Figure 14(b) shows that the number of requests from these peers can still be well fitted with a stretched-exponential distribution, instead of a power-law model. Figure 14(c) shows that during these two hours, the top 10% of the connected peers have uploaded over 77% of the streaming traffic to our host.
These results suggest that (1) the data requests made by a peer to different neighbors also have high locality, resulted from the highly localized (at the ISP level) and highly connected peer clusters in PPLive; (2) the number of data requests follows a stretched exponential distribution. Thus, to speedup downloading and maintain a smooth playback, it might be worth caching these top 10% of neighbors for frequent data transmissions; (3) the high data request locality leads to the peer’s contribution distribution following a stretched exponential distribution as well, with top 10% of the connected peers contributing most of the requested
0 50 100 150 200 250 300 100 101 102 103 104 105
Remote host (rank)
# of data requests Correlation coefficient: −0.654 0 50 100 150 200 250 300 10 −5 10−4 10−3 10−2 10−1 100 101 RTT (sec)
Connection times RTT (raw data) linear fit in log scale
Figure 15. The China-TELE node viewing the popular program 0 50 100 150 200 100 101 102 103 104 105
Remote host (rank)
# of data requests Correlation coefficient: −0.396 0 50 100 150 200 10 −2 10−1 100 101 RTT (sec)
Connection times RTT (raw data) linear fit in log scale
Figure 16. The China-TELE node viewing the unpopular program 0 50 100 150 200 100 101 102 103 104 105
Remote host (rank)
# of data requests Correlation coefficient: −0.679 0 50 100 150 200 10 −5 10−4 10−3 10−2 10−1 100 101 RTT (sec)
Connection times RTT (raw data) linear fit in log scale
Figure 17. The USA-Mason node viewing the popular program 0 20 40 60 80 100 101 102 103 104 105
Remote host (rank)
# of data requests Correlation coefficient: −0.450 0 20 40 60 80 10 −2 10−1 100 101 RTT (sec)
Connection times RTT (raw data) linear fit in log scale
Figure 18. The USA-Mason node viewing the unpopular program
streaming traffic.
3.5. Top connected peers have smaller RTT to the
requestor
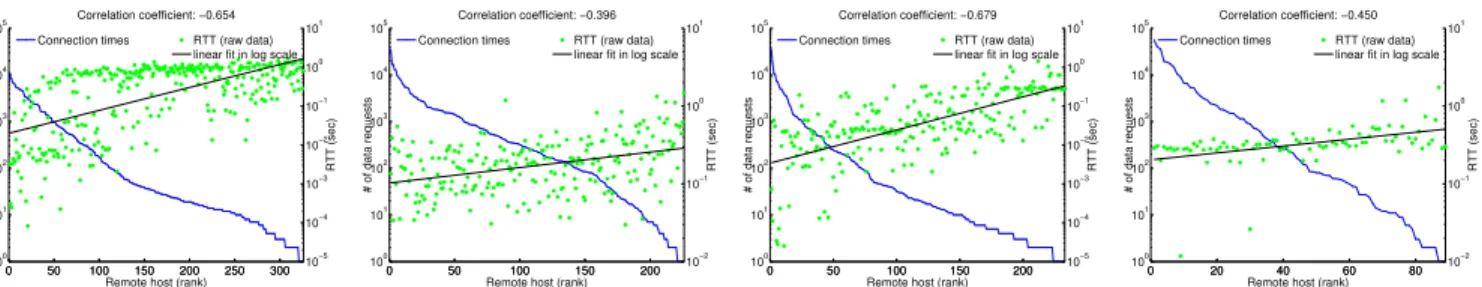
The last subsection shows that at a peer level, the data requests made by a peer also have strong locality. Inside the same ISP, there are many peers available. We are interested in why some peers are connected more frequently for data. As the RTT is one of the intuitive metric, we extracted the RTT from our workloads based on all data transmissions involved each peer. Since what we extract are application level latency, we take the minimum of them as the RTT estimation. Figure 15 shows the number of data requests vs. RTT to each involved peer when our TELE node was
viewing the popular program. In this figure, thex-axis
rep-resents the rank of connected peers, ordered by the number
of data requests from our host, the lefty-axis represents the
corresponding request number in log scale, while the righty
-axis represents the corresponding RTT of these peers to our host in log scale. Further, we fit the RTT in log scale using the least squares fitting. The correlation coefficient between the logarithm of the number of requests and the logarithm of RTT is -0.654, indicating they have negative correlation with each other. We can observe from this figure that the most frequently connected peers tend to have smaller RTT to our TELE node.
Figure 16 shows the corresponding results when our TELE node was viewing the unpopular program. Again, Figure 16 shows that the top connected peers have smaller RTT to our TELE node. Compared with Figure 15, the correlation is less significant, but still prominent, as reflected by the correlation coefficient of -0.396.
When our Mason node was viewing the popular program, Figure 17 shows the corresponding results. Consistent with what we have observed in Figure 15, the results show top connected peers tend to have smaller RTT values to our Mason node and the correlation coefficient is similar to that in Figure 15. Figure 18 shows the results when our Mason node was viewing the unpopular program. As expected, we can see that the top connected peers have smaller RTT values but the correlation between them is less pronounced.
Because RTT (or the hops) is commonly used as an estimation of the proximity and has been demonstrated to be effective [15], the above results show that in PPLive, using a simple latency based strategy when connecting with peers, a PPLive client can also achieve high traffic locality without directing measuring RTT or using other topology information for peer selection.
Summary of Measurement Results:While we did not show the workload details from other days due to page limit, our analysis shows a strongly consistent trend. Through a 4-week measurement, we find that streaming traffic in PPLive is highly localized at the ISP level. But this is achieved with-out any special requirement. Instead, it is simply because a PPLive client uses a decentralized, latency based, neighbor referral policy when selecting peers to connect with. As a result, this automatically addresses the topology mismatch issue to a large extent. Such an approach can be considered in other P2P applications for both user- and network-level performance.
4. Related Work
P2P applications have now contributed for more than half of the Internet traffic due to their inherent scalability and superior user performance. Among these P2P applications, file sharing and streaming are major traffic sources because both of them often involve large file transferring. In parallel to such trends, concerns have been raised about their in-efficient Internet resource utilization due to the topology mismatch between P2P overlay and underlying network layer. As BitTorrent traffic accounts for more than 30% of Internet traffic today [5], recently, a number of studies have examined the topology mismatch and have proposed solutions to address them, such as Ono [15] and P4P [16].
On the other hand, P2P streaming applications are gain-ing increasgain-ing popularity. Different from P2P file shargain-ing, P2P streaming applications often have more stringent QoS requirements. Some early studies have examined the user performance of PPLive via measurement utilizing both pas-sive sniffing and active probing [21], [23], [24], [25]. While most of the above measurements were conducted in Europe and USA, our work is based on the real playback traces
captured in both China, where the majority of PPLive users are located, and USA. Recently, Wu et al. investigated P2P streaming topologies in UUSee [26] and found only about 40% of total connected peers are from the same ISP as the observing peer, while our non-intrusive measurement found quite different results in PPLive. With the increasing popularity of PPLive, PPLive overlay networks keep evolv-ing and demand new studies from time to time, given a significant number of Internet users actively participating in its networks. Most recently, Huang et al. have conducted a large scale measurement to study the PPLive based on-demand streaming [27], but still, the traffic locality issue in P2P streaming applications was not studied. Work [28] aimed to have full ISP awareness to constrain P2P traffic within ISP boundaries. However, this is under the assump-tion that the tracker server maintains the ISP informaassump-tion for every available peer on the overlay, while according to our measurements, peers in PPLive self-organize into a network with high traffic locality at the ISP level spontaneously without using any topology information and without any infrastructure support.
5. Conclusion
With the ever-increasing P2P traffic on the Internet, both industry and the research community are seriously concerned about the deficiency of Internet resource utilization in P2P applications due to the topology mismatch of the P2P overlay and the underlying network. In this work, we study the traffic locality in PPLive, a popular P2P live streaming system via measurements. The analysis results show that the live streaming traffic in PPLive is highly concentrated at the ISP level with a simple decentralized, latency based, neighbor referral peer selection policy, without using any topology information and without requiring any infrastruc-ture support. Our study provides some new insights for better understanding and optimizing the network- and user-level performance in practical P2P live streaming systems.
Acknowledgement
We thank the anonymous referees for providing construc-tive comments. The work has been supported in part by U.S. NSF under grants 0509061, 0621631, and CNS-0746649, and U.S. AFOSR under grant FA9550-09-1-0071.
References
[1] “Skype,” http://www.skype.com. [2] “BitTorrent,” http://www.bittorrent.com. [3] “PPLive,” http://www.pplive.com.
[4] “SETI@home,” http://setiathome.berkeley.edu.
[5] “P2P File Sharing The Evolving Distribution Chain,” http://www.dcia.info/activities/p2pmswdc2006/ferguson.pdf. [6] M. Castro, P. Druschel, A. Kermarrec, A. Nandi, A.
Row-stron, and A. Singh, “Splitstream: High-bandwidth content distribution in a cooperative environment,” inProc. of IPTPS, Berkeley, CA, Feb. 2003.
[7] D. Kostic, A. Rodriguez, J. Albrecht, and A. Vahdat, “Bullet: High bandwidth data dissemination using an overlay mesh,” inProc. of SOSP, Bolton Landing, NY, Oct. 2003.
[8] M. Hefeeda, A. Habib, B. Boyan, D. Xu, and B. Bhargava, “PROMISE: peer-to-peer media streaming using CollectCast,” inProc. of ACM MM, Berkeley, CA, USA, Nov. 2003. [9] N.Magharei and R.Rejaie, “Prime: Peer-to-peer
receiver-driven mesh-based streaming.” in Proceedings of IEEE IN-FOCOM, Anchorage, Alaska, May 2007.
[10] V. N. Padmanabhan, H. J. Wang, and P. A. Chou, “Resilient peer-to-peer streaming,” inProc. of ICNP, Atlanta, GA, USA, Nov. 2003.
[11] V. Pai, K. Kumar, K. Tamilmani, V. Sambamurthy, and A. Mohr, “Chainsaw: Eliminating trees from overlay multi-cast,” inProc. of International P2P Systems Workshop, Ithaca, NY, USA, Feb. 2005.
[12] T. Small, B. Liang, and B. Li, “Scaling laws and tradeoffs in peer-to-peer live multimedia streaming,” inProc. of ACM MM, Santa Barbara, CA, Oct. 2006.
[13] “Comcast Throttles BitTorrent Traffic,” http://torrentfreak.com/comcast-throttles-bittorrent-traffic-seeding-impossible/.
[14] R. Bindal, P. Cao, W. Chan, J. Medved, G. Suwala, T. Bates, and A. Zhang, “Improving traffic locality in bittorrent via biased neighbor selection,” inProc. of ICDCS. Washington, DC, USA: IEEE Computer Society, 2006, p. 66.
[15] D. R. Choffnes and F. E. Bustamante, “Taming the torrent,” in
Proc. of ACM SIGCOMM, Seattle, WA, USA, August 2008. [16] H. Xie, Y. R. Yang, A. Krishnamurthy, Y. Liu, and A. Sil-berschatz, “P4p: Provider portal for applications,” inProc. of ACM SIGCOMM, Seattle, WA, USA, August 2008. [17] J. Leskovec, L. Backstrom, R. Kumar, and A. Tomkins,
“Microscopic evolution of social networks,” inProc. of ACM SIGKDD, Aug. 2008.
[18] “Wireshark,” http://www.wireshark.org.
[19] “PPLive,” http://oaps.lib.tsinghua.edu.cn:8080/dspace/ bitstream/123456789/392/1/025%E6%9D%8E%E5%AE% 87%E6%81%922003011580-2003.pdf.
[20] “Team Cymru, IP to ASN mapping,” http://www.team-cymru.org/Services/ip-to-asn.html.
[21] X. Hei, C. Liang, J. Liang, Y. Liu, , and K. W.Ross, “A measurement study of a large-scale p2p iptv system,” inIEEE Transactions on Multimedia, December 2007.
[22] L. Guo, E. Tan, S. Chen, Z. Xiao, and X. Zhang, “The stretched exponential distribution of internet media access patterns,” inProc. of PODC, Toronto, Canada, August 2008. [23] S. Ali, A. Matur, and H. Zhang, “Measurement of commercial peer-to-peer live video streaming,” inProc. of the Workshop on Recent Advances in Peer-to-Peer Streaming, Waterloo, Canada, 2006.
[24] T. Silverston and O. Fourmaux, “Measuring p2p iptv sys-tems,” inNOSSDAV’07, Urbana, Illinois USA, June 2007. [25] L. Vu, I. Gupta, J. Liang, and K. Nahrstedt,
“Measure-ment and modeling of a large-scale overlay for multimedia streaming,” inProc. of QShine, Vancouver, British Columbia, Canada, August 2007.
[26] C. Wu, B. Li, and S. Zhao, “Exploring large-scale peer-to-peer live streaming,” in IEEE Transactions on Parallel and Distributed Systems, June 2008.
[27] Y. Huang, T. Z. Fu, D.-M. Chiu, J. C. Lui, and C. Huang, “Challenges, design and analysis of a large-scale p2p-vod system,” in Proc. of ACM SIGCOMM, Seattle, WA, USA, August 2008.
[28] C. Wu, B. Li, and S. Zhao, “Multi-channel live p2p streaming: Refocusing on servers,” in Proc. of INFOCOM, Phoenix, Arizona USA, April 2008.