AN IVR CALL PERFORMANCE CLASSIFICATION
SYSTEM USING COMPUTATIONAL INTELLIGENT
TECHNIQUES
Pretesh Bhoola Patel
A thesis submitted to the Faculty of Engineering and the Built Environment, University of the Witwatersrand, in fulfillment of the requirements for the degree of Doctor of Philosophy.
Declaration
I declare that this thesis is my own, unaided work, except where otherwise acknowledged. It is being submitted for the degree of Doctor of Philosophy to the University of the Witwatersrand, Johannesburg. It has not been submitted before for any degree or examination in any other university.
Signed this __ day of _____________20__
Abstract
Speech recognition adoption rate within Interactive Voice Response (IVR) systems is on the increase. If implemented correctly, businesses experience an increase of IVR utilization by customers, thus benefiting from reduced operational costs. However, it is essential for businesses to evaluate the productivity, quality and call resolution performance of these self-service applications. This research is concerned with the development of a business analytics for IVR application that could assist contact centers in evaluating these self-service IVR applications. A call classification system for a pay beneficiary IVR application has been developed. The system comprises of field and call performance classification components. ‘Say account’, ‘Say amount’, ‘Select beneficiary’ and ‘Say confirmation’ field classifiers were developed using Multi-Layer Perceptron (MLP) Artificial Neural Network (ANN), Radial Basis Function (RBF) ANN, Fuzzy Inference System (FIS) as well as Support Vector Machine (SVM). Call performance classifiers were also developed using these computational intelligent techniques. Binary and real coded Genetic Algorithm (GA) solutions were used to determine optimal MLP and RBF ANN classifiers. These GA solutions produced accurate MLP and RBF ANN classifiers. In order to increase the accuracy of the call performance RBF ANN classifier, the classification threshold has been optimized. This process increased the classifier accuracy by approximately eight percent. However, the field and call performance MLP ANN classifiers were the most accurate ANN solutions. Polynomial and RBF SVM kernel functions were most suited for field classifications. However, the linear SVM kernel function is most
field classifiers, the FIS field classifiers did not perform well. The FIS call performance classifier did outperform the RBF ANN call performance network. Ensembles of MLP ANN, RBF ANN and SVM field classifiers were developed. Ensembles of FIS, MLP ANN and SVM call performance classifiers were also implemented. All the computational intelligent methods considered were compared in relation to accuracy, sensitivity and specificity performance metrics. MLP classifier solution is most appropriate for ‘Say account’ field classification. Ensemble of field classifiers and MLP classifier solutions performed the best in ‘Say amount’ field classification. Ensemble of field classifiers and SVM classifier solutions are most suited in ‘Select beneficiary’ and ‘Say confirmation’ field classifications. However, the ensemble of call performance classifiers is the preferred classification solution for call performance.
Acknowledgements
I would like to thank my supervisor, Prof. Tshilidzi Marwala, for his unending assistance, guidance, support and tremendous insight into this research project. I have learnt how to conduct world class research from him. This is a priceless gift that will never be forgotten.
My sincere thanks go to my parents, Bhoola Patel and Yoginiben Bhoola Patel, for their infinite support, patience as well as encouragement during the course of this research. I would also like to thank my fiancée, Deepa Jaga, for continuously reminding me of the importance of this work. She has also been amazingly patient and understanding during the course of this work. My thanks also go to my brother, Ketan Bhoola Patel, who continuously reinforced the idea of hard work will be rewarded. I also thank my sister, Anisha Bhoola Patel and her husband Hanish Patel for their extreme support.
I would like to also acknowledge the support and guidance provided by my colleagues at Intelleca, a division of the Bytes Technology Group. They have continuously reminded me of the value of this research. I sincere thank you goes to Carlos Goncalves and Jivko Mladenov.
Most importantly, I would like to thank my Lord, Bhagwan Swaminarayan and my Guru, Pramukh Swami Maharaj. They have made me achieve all that I have and it is
I dedicate this thesis to Bhagwan Swaminarayan, Pramukh Swami Maharaj, my parents and fiancée.
Table of contents
Declaration ...i
Abstract ...ii
Acknowledgements ...iv
List of Figures ...ix
List of Tables ...xi
Nomenclature ...xii
1 Business Analytics and Interactive Voice Response systems...1
1.1 Introduction... 1
1.2 Interactive Voice Response systems ... 2
1.3 Business analytics for IVR... 7
1.4 Research objectives and thesis contribution ... 16
1.5 Importance of the research... 18
1.6 Structure of the thesis... 19
1.7 Publications... 21
2 Computational Intelligent techniques...22
2.2 Artificial neural network... 23
2.2.1 Artificial neural network architectures ... 25
2.3 Genetic Algorithm (GA) ... 30
2.3.1 Chromosome representation ... 31
2.3.2 Selection function ... 32
2.3.3 Genetic operators ... 34
2.3.4 Initialization, termination and evaluation functions ... 36
2.4 Fuzzy Inference System ... 38
2.5 Support Vector Machine (SVM)... 41
3 The call classification system...45
3.1 Introduction... 45
3.2 Source of the data... 47
3.3 Architecture of the call classification system... 51
3.4 Selection and preprocessing of data... 58
4 Artificial Neural Networks classifiers...66
4.1. Introduction... 66
4.2. MLP and RBF classifiers ... 67
4.2.1 Optimization of Artificial Neural Network architecture... 69
4.2.2 Evaluation of Genetic Algorithm solutions employed ... 71
4.2.3 Optimization of classification threshold... 75
4.2.4 Comparison of field and call performance Artificial Neural Network classifiers... 78
5.1. Introduction... 84
5.2. FIS classifiers... 85
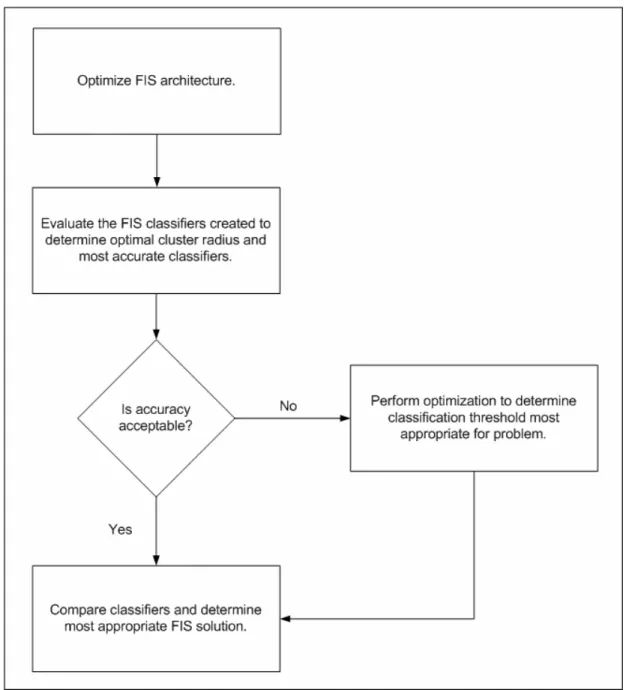
5.2.1 Optimization of the Fuzzy Inference System architecture... 86
5.2.2 Optimization of the classification threshold ... 88
5.2.3 Comparison of field and call performance Fuzzy Inference System classifiers... 91
6 Support Vector Machine classifiers...93
6.1. Introduction... 93
6.2. SVM classifiers ... 94
6.2.1 Optimization of the Support Vector Machine classifier Architecture...96
6.2.2 Comparison of field and call performance Support Vector Machine classifiers... 98
7 Comparison of the computational intelligent methods considered and the selection of the superior classifiers...101
7.1. Introduction... 101
7.2. Comparison of results achieved ... 102
7.3. Ensemble of classifiers... 103
8. Conclusions and further work...110
8.1. Conclusion ... 110
8.2. Further work and recommendations... 116
List of Figures
Figure 2.1: Feed-forward neural network topology ... 27
Figure 2.2: Radial Basis Function Artificial Neural Network ... 29
Figure 2.3: GA solution optimization process ... 37
Figure 2.4: Support Vector Machine process... 43
Figure 3.1: Extract of an IVR log event file ... 47
Figure 3.2: Sequence of child elements within parent field element ... 49
Figure 3.3: Example of VoiceXML field code ... 50
Figure 3.4: Corresponding IVR log field events generated ... 50
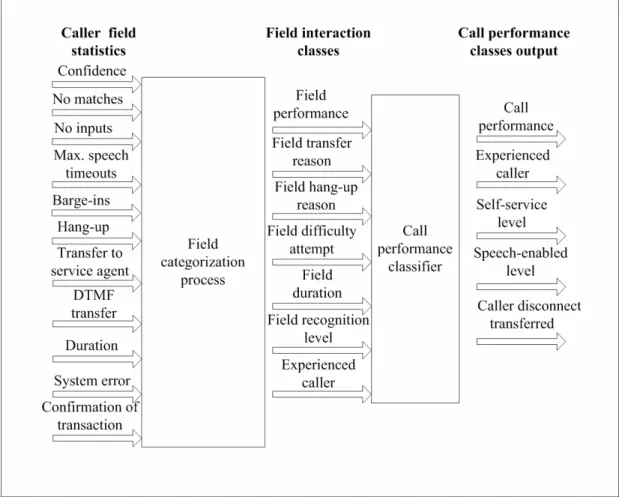
Figure 3.5: Call classification system ... 54
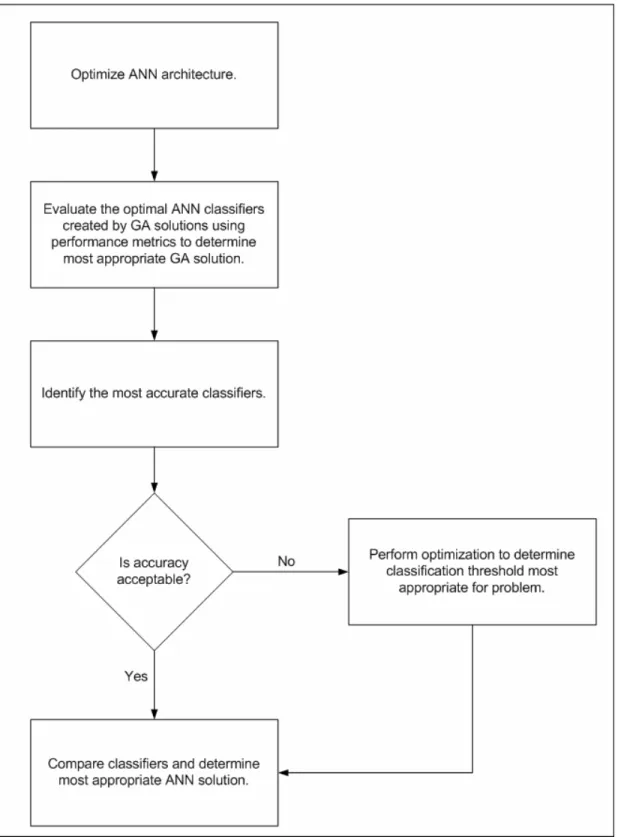
Figure 4.1: Artificial Neural Network implementation process followed ... 68
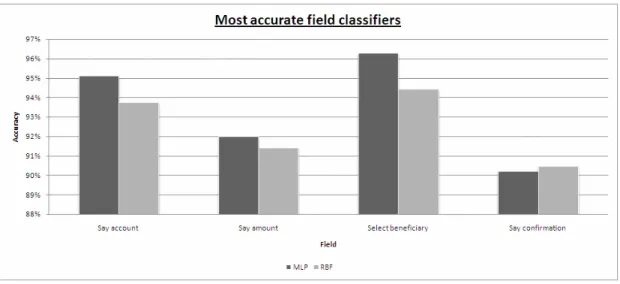
Figure 4.2: MLP ANN Field classifier results (Validation)... 79
Figure 4.3: MLP ANN Field classifier results (Test)... 79
Figure 4.4: RBF ANN Field classifier results (Validation) ... 81
Figure 4.5: RBF ANN Field classifier results (Test) ... 81
Figure 4.8: Call performance classifier results (Test)... 83
Figure 5.1: FIS system implementation process followed... 86
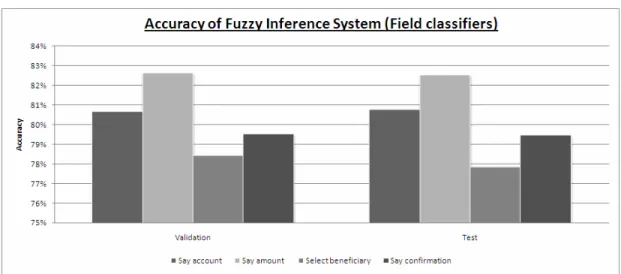
Figure 5.2: FIS Field classifier results ... 92
Figure 5.3: FIS Call performance classifier results... 92
Figure 6.1: SVM implementation process ... 95
Figure 6.2: Support Vector Machines Field classifier results (Validation) ... 99
Figure 6.3: Support Vector Machines Field classifier results (Test) ... 99
Figure 6.4: Call performance Support Vector Machines classifier results ... 100
Figure 7.1: Results of field classifier implementations... 102
Figure 7.2: Results of call performance classifier implementations... 103
Figure 7.3: Ensemble of field classifiers... 104
Figure 7.4: Ensemble of call performance classifiers ... 105
Figure 8.1: Field transcription classifier ... 118
List of Tables
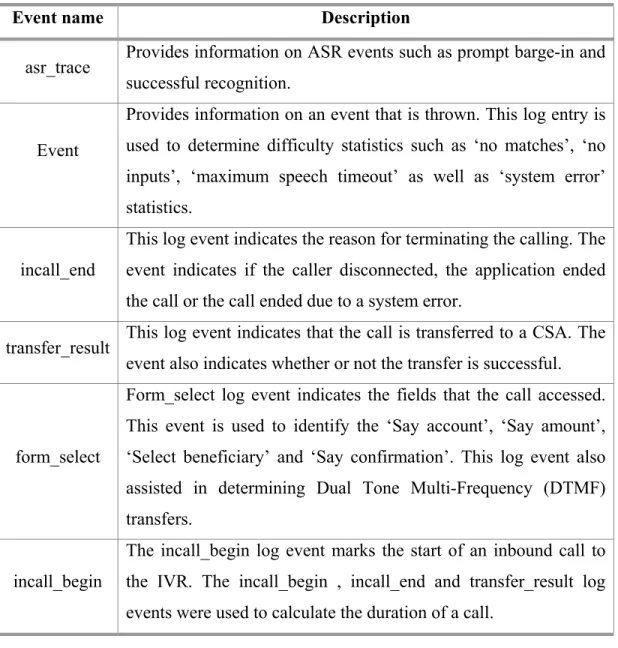
Table 3.1: Descriptions of log events used to generate data sets ... 48
Table 3.2: Field classification component inputs and outputs ... 55
Table 3.3: Call performance classification component inputs and outputs ... 57
Table 3.4: Field performance classifier interaction output class rules... 60
Table 3.5: Rules followed to compute call performance classifier output classes... 61
Table 3.6: Binary notation of inputs to field classifiers ... 62
Table 3.7: Binary notation of field output interaction... 63
Table 3.8: Binary notation of call performance classification classes ... 65
Table 4.1: ANN classifier implementation results... 73
Table 4.2: Results of call performance RBF ANN classifier threshold optimization. 77 Table 5.1: Results of FIS cluster radius optimization... 88
Table 5.2: Results of FIS threshold optimization... 90
Table 6.1: Results of SVM implementation... 97
Table 7.1: Classifiers used in Ensemble solution ... 106
Nomenclature
Abbreviation Description
AA Auto Attendants
AI Artificial Intelligence
ANI Automatic Number Identification
ANN Artificial Neural Network.
ASR Automated Speech Recognition
CEA ClickFox Customer Experience Analytics
CPU Central Processing Unit
CRM Client Relationship Management
CSA Customer Service Agent
DNIS Dialed Number Identification Service
DTMF Dual Tone Multi-Frequency
ERM Empirical Risk Minimization
ERP Enterprise Resource Planning
ETL Extract Transform Load
FIS Fuzzy Inference System.
FSVM Fuzzy Support Vector Machines
GA Genetic Algorithm
Abbreviation Description
GUI Graphical User Interface
HME Hierarchical Mixture of Expert
HTML Hypertext Markup Language
IVR Interactive Voice Response
MLP Multi-Layer Perceptron
RBF Radial Basis Function
RMS Root Mean Square
RNN Recurrent Neural Network
ROC Receiver Operating Characteristic
SOM Self-Organizing Map
SRM Structural Risk Minimization
SV Support Vector
SVM Support Vector Machine
TTS Text-to-speech VIA Call-Analytics Virtual Interactive Analyst
VoiceXML Voice Extensible Markup Language
VRU Voice Response Units
Chapter 1
Business Analytics and Interactive Voice Response systems
1.1
Introduction
Customer satisfaction fosters loyalty, increases the probability of selling additional products and services as well as reduces the chances of competitive replacement. However, customer dissatisfaction results into direct revenue losses due to customer churn and indirect losses such as damage to reputation. Improving the customer experience is a vital priority for contact centers across different industries.
In order to provide customers with access to convenient and reliable information fast, Interactive Voice Response (IVR) systems have been adopted by businesses. If implemented correctly, these systems can assist in improving the customer experience (Nichols, 2006). This thesis details the implementation of a caller classification system that can be utilized within a business analytics for IVR solution. The objective of the solution is to assist contact centers in determining caller experience metrics, thereby assisting businesses in identifying areas of improvement within self-service applications.
This chapter begins with an explanation of IVR systems that will examine the benefits and current deployment techniques employed by businesses. Thereafter, business analytics for IVR is defined and current products that are available will be described. The chapter also states the research objectives, thesis contribution and the importance of the research. The structure of the thesis is also explained. The chapter ends with a list of publications that were published as a result of this research.
1.2
Interactive Voice Response systems
Interactive Voice Response (IVR) market is a rapidly growing contact center technology sector. The IVR market yielded approximately two billion US dollars in revenue in 2007, thus establishing this market as the second largest contact center technology sector (DMG Consulting LLC, 2009). Due to the current economic condition, businesses are under tremendous pressure to reduce operational expenses. When deployed correctly, IVR systems can automate twenty to ninety five percent of incoming calls, thus resulting in dramatic reduction in operational expenses (DMG Consulting LLC, 2009).
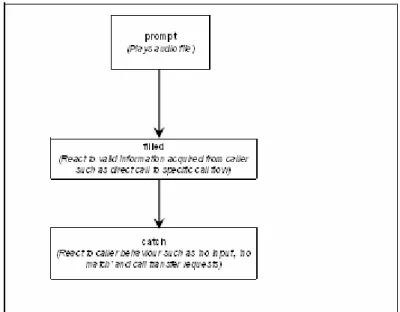
An IVR system is an automated telephony system that interacts with callers, gathers relevant information and routes calls to the appropriate destinations (Nichols, 2006). The inputs to the IVR system can be voice, Dual Tone Multi-Frequency (DTMF) keypad selection or a combination of the two. IVR systems can provide appropriate responses in the form of voice, fax, callback, e-mails and other media (Nichols, 2006). An IVR system solution may consist of telephony equipment, software applications, databases and supporting infrastructure. A major objective of an IVR system is to improve customer experience, while lowering operating costs.
Initially, Auto Attendants (AA) and Voice Response Units (VRU) were used to provide menu options and scripting tools to direct callers to certain queues as well as
IVR systems provided the capability to integrate enterprise information systems and to interact with callers to tailor questions as well as responses according to customer requirements. Today, Advanced Speech Recognition (ASR) tools utilized within the IVR systems provide conversational interactions with callers, thus providing an effective method of gathering caller input information for customization (Ascent Group, Inc, 2008).
IVR system acceptance by businesses has taken more than a decade to grow. However, many businesses identified that at the expense of automation, their customers were being alienated. As a result, during the recent years, the importance of the relationship between customer experience, customer satisfaction and profitability have been emphasized by many businesses (Ascent Group, Inc, 2008). These businesses began actively addressing IVR system usability through customer-friendly application call flow designs. Due to continuous improvement processes implemented by businesses that enhance the IVR usability and functionality, the number of calls handled completely within IVR systems has increased. However, the initiative for call automation has been moderated as there are businesses that also deploy IVR systems as an option for customers to help themselves, rather than forcing callers to utilize IVR system services (Ascent Group, Inc, 2008).
IVR technology provides businesses more cost effective management through call segmentation, automated call handling and informational messaging. IVR systems can also assist businesses manage peak call volumes, enabling contact centers to respond to a large number of customers. IVR technology provides customers twenty four hour services as well as privacy (Ascent Group, Inc, 2008).
Additionally, new standards in speech technology are providing substantial advances in the predominantly proprietary IVR technology market (Ascent Group, Inc, 2008). In order to effectively as well as efficiently interact with customers, new voice
telecommunications infrastructure. Technologies such as Voice Extensible Markup Language (VoiceXML) are enabling the development of solutions that execute on multiple platforms, thus providing businesses with the capabilities of managing web-based and IVR self-service applications utilizing the same infrastructure as well as language (VoiceXML Forum, 2009). As a result, businesses have the capabilities of providing feature rich value added self-service applications faster with reduced implementation costs, thus resulting in an increase in IVR application deployments.
VoiceXML is a scripting language utilized for defining voice enabled IVR applications (VoiceXML Forum, 2009). It is the ‘Hypertext Markup Language (HTML)’ for telephony based speech applications. VoiceXML hides the complexities of the telephony platform from IVR application developers. The language enables easier IVR voice application integration with internet-based applications. VoiceXML enables IVR applications to be developed in an environment familiar to web developers. The major objective of VoiceXML is to provide the advantages of web-based development and content delivery to IVR applications. VoiceXML utilizes ASR and DTMF for user input. Prerecorded audio and Text-to-speech (TTS) attributes are employed as output. The VoiceXML technology is proposed by the VoiceXML forum (VoiceXML Forum, 2009). VoiceXML is an international standard for defining telephony based voice applications.
Currently, IVR systems have been deployed in a number of industries such as financial services, telecommunication, manufacturing, insurance, utilities, consumer products as well as entertainment. The major motivation for IVR system implementation is automation and customer satisfaction (Ascent Group, Inc, 2008). Typical self-service IVR applications that are provided to callers are account inquiry, account payment, fault reporting, status inquiry, ordering of products or services, automated assistance in resolving technical problems as well as general company information (Ascent Group, Inc, 2008).
Majority of businesses implement IVR systems to selectively force callers through these self-service applications prior to interacting with a Customer Service Agent (CSA). This deployment strategy increases system utilization and success, particularly for callers that are unfamiliar with the system options and functionality provided. This strategy encourages IVR usage for routine tasks while complex inquiries are resolved through CSA interaction. During peak call volume periods, businesses can also selectively force callers through self-service IVR applications as well as after office hours. However, when the contact center is not experiencing large call volumes, the caller can be presented with an option whether or not to use the self-service applications (Ascent Group, Inc, 2008).
Many businesses also deploy IVR systems to provide optional services to callers. Businesses also implement these systems for efficient call routing (Ascent Group, Inc, 2008). There are businesses that have the capabilities to route a percentage of calls received to an IVR hosted by an outsourced vendor, transparent to the customer. This capability is usually found in large contact centers. In order to improve the efficiency of the contact centers during peak call volume periods, this option is exercised (DMG Consulting LLC, 2009).
In 2006 it has been reported that the speech technology adoption rate was on the increase (Nichols, 2006). This trend continues as indicated in (Global Industry Analysts, 2008) and (Datamonitor, 2008). Speech recognition provides another dimension to IVR system design. ASR self-service applications can dramatically improve IVR utilization. The benefits provided by speech recognition driven self-service applications are shorter call durations, increased usage, natural conversation interactions and, therefore, increased customer satisfaction. Due to the implementation of ASR IVR applications, businesses have reported an increase in IVR utilization from thirty five to seventy percent (Ascent Group, Inc, 2008). Therefore, if implemented correctly, callers prefer speech-enabled IVR applications.
Today, customers interact with many businesses that provide excellent services. These interactions set customer expectations. As a result, in order to outperform in the current market, all customer-facing technologies should be scrutinized to ensure that these implementations support business service strategies and, therefore, deliver the expected, if possible, preferred customer experience.
In order to achieve this, in relation to IVR systems, best practices state that businesses should evaluate the performance of the self-service applications as the business would CSA productivity, quality and call resolution (Ascent Group, Inc, 2008). Businesses should have the capabilities to measure the IVR system performance from the perspective of the caller that is the influence the automated application had on accomplishing the objective of the customer. The best results are achieved through constant monitoring and refinement of IVR applications (Miller, 2007).
Business analytics for IVR can provide contact centers with these essential capabilities. These solutions compute performance measures such as caller disconnects at the various stages of the applications. This assists businesses in determining caller satisfaction or dissatisfaction with the system. For example, due to frustration experienced, the customer may have given up and therefore abandoned the call. The caller may have received the required information and, as a result, ended the call. Business analytics for IVR solutions also provide transfers to CSA statistics, which aid contact centers to determine if the caller is provided with sufficient information to complete transactions. These measures also assist in determining whether or not customers are familiar with the application call flows. This research entails the development of such a business analytics for IVR solution that employs computational intelligent methodologies.
1.3
Business analytics for IVR
In this research, business analytics for IVR is defined as systems that effectively use IVR application data to determine the manner in which callers are utilizing the automated system and, through the use of this information, assists contact centers in identifying areas for Voice User Interface (VUI) improvement. As a result, business analytics for IVR solutions assist contact centers in enhancing the customer experience by analyzing the automated applications from the perspective of the customer. An increase in the performance of the automated IVR services can result in satisfied customers, increase in customer retention, increase in self-service containment, decrease call duration and lower contact center costs.
Business analytics for IVR assist contact centers in determining the number of tasks that were completed, the number of callers that selected to transfer to CSA and the number of caller disconnects. These solutions also provide further details such as the tasks where the caller disconnect or transfer to CSA occurred. The reason for the transfer to CSA such as due to system errors or callers preferring to interact with CSA is also provided. Currently, there are business analytics for IVR solutions that also provide implementation detail measurements such as speech recognition accuracy per task as well as out of grammar or invalid option selections (Miller, 2007).
Typical business analytics for IVR solutions analyze information such as transcribed voice recordings, application data and caller or customer feedback (Miller, 2007). IVR application data includes log files and reporting database information. Caller or customer feedback for IVR applications are usually determined through the use of automated call surveys. Once, the caller has completed a transaction with the automated service, these applications are typically presented to the customer.
However, there are contact centers that use outbound IVR applications to conduct the survey after the caller has disconnected (opinion-8, 2009).
Business analytics for IVR solutions provide contact centers the ability to monitor specific events within the IVR applications. These solutions are the basis for predicting and enhancing the quality of future customer interactions. In order to achieve this, business analytics for IVR solutions utilize “insight engines” that process databases consisting of call detail records, stored transcribed voice recordings or utterances and other call interaction information to identify patterns that result into crucial information that assist contact centers to manage future interactions. A major objective of these solutions is to generate sufficient detailed information to assist contact centers isolate decision points that indicate customer dissatisfaction.
Majority of business analytics for IVR solutions provide the capabilities to determine system status, call progress and exit analysis information (Miller, 2007). System status information provides statistics such as the duration various components of the IVR system were enabled and active as well as disabled. This information also provides statistics that indicate where failures are occurring. Call progress information assists in determining call patterns that illustrate the manner in which customers are proceeding through the IVR applications. Exit analysis assists contact centers in determining the major technique calls within the IVR applications at specific modules are terminated that is due to caller disconnects or transfer to CSA.
Majority of the current business analytic for IVR solutions employ a four-stage process towards customer experience improvement (Miller, 2007). This process involves isolating self-service difficulties, capturing customer care concerns, increasing the duration in IVR systems and identifying time as well as the cause of exit from the IVR systems. Isolating self-service difficulties involve detecting modules within the IVR applications high levels of caller disconnects or transfers to
IVR application does not recognize a callers input due to the caller saying too few digits in the response to account number information queried, the IVR application continuously re-prompts a caller with no reason for the unsuccessful attempt would be a cause of caller frustration.
IVR system caller satisfaction levels are mainly determined by the manner in which self-service solutions address customer expectations. Capturing customer care concerns entails correlating call survey results with specific characteristics of the customer interaction. This involves analyzing customer feedback and utilizing this information to identify modules within the self-service applications that require enhancements to improve the caller experience. Increasing the duration in IVR systems is an objective of many contact centers as this may correlate to callers successfully using the IVR applications. The contact center is reducing costs as these queries do not require interaction with CSA, which has a high cost. However, if this caller behaviour is also accompanied with high levels of frustration, the IVR application is analyzed to determine the cause. Identifying the time and cause of exit from the IVR applications assists in determining whether the call ended successfully or the call transferred to a CSA for completion.
Typically, business analytics for IVR solutions begin an implementation by reviewing IVR application reporting or logging information as well as IVR application documentations to identify specific events that map crucial modules within the automated systems. IVR application documentations may include functional and technical specifications. Application logging events that identify critical caller interaction such as speech recognition events are also identified. The mapped events are then utilized to define important business events such as business success task completion modules. Each contact center may interpret these events differently. For example, a contact center may regard transfer to CSA as a successful task completion as the caller exercised the available “transfer me” option and the IVR
center may interpret the transfer to CSA event as unsuccessfully task completion as the transaction had not been completed within the IVR solution. A CSA concluded the task. As a result, the outcome of this process can be business specific. Thereafter, the information determined is utilized to compute statistics that provide insight into the performance of the IVR applications. These are then presented to businesses through reports, websites or dashboards. An iterative analyze of these statistics assist in identifying areas of improvement.
Currently, there are many third-party vendors that provide business analytics for IVR solutions. However, ClickFox Customer Experience Analytics (CEA), Call Analytics Virtual Interactive Analyst (VIA), pureXML business analytics for IVR and VoiceObjects analyzer solutions are examined in this research.
PureXML provides a hosted web based business analytics for IVR solution. As a result, the solution caters for remote access. In order to implement the analytics solution, pureXML follows a process that maps IVR logging information such as application metric files into a standard analytics Extensible Markup Language (XML) structure. An Extract Transform Load (ETL) process is employed to populate the standard XML structure. Thereafter, businesses have secure access to a web based visual representation of caller activity per module or node. The representation illustrates all IVR application nodes mapped. When a particular module is selected, the previous node or nodes that could lead to the current module is displayed as well as the node or nodes that could follow. The relevant module caller behaviour statistics calculated are also illustrated. As a result, pureXML provides the contact center with a detail interactive call flow illustration (pureXML, 2007).
The pureXML business analytics for IVR solution computes caller disconnects, difficulties experienced and transfer to CSA caller behaviour statistics. These statistics are calculated per IVR application module. Caller difficulties represent
automated prompt. The solution also provides the business with transaction complete success and failure metrics. As a result, in order to deliver a successful pureXML analytics solution, the accuracy of the mapping process of log event files to an XML structure is crucial.
ClickFox CEA is an analytical solution that employs a patented “customer behavior pattern recognition engine”, which identifies and models the actual paths that occur within the channels that form a customer interaction across the enterprise (Clickfox, 2009). ClickFox offers hosted as well as on premises deployments. Similar to the pureXML solution, the ClickFox CEA solution implementation conducts a detailed analysis of IVR application logged information and supporting design documentation such as functional specification to map logged information to key business performance indicators. Thereafter, a robust interactions repository tailored to business requirements and processes is created. This forms the foundation of all analysis conducted. The patented technology utilized by ClickFox CEA aggregates data across all customers and all communication access points such as websites and IVRs, to produce a visual illustration of how customers are interacting with these systems across the enterprise. ClickFox assists businesses in discovering opportunities for improvements by identifying correlations and trends across all customer interactions as well as by determining optimal methods for handling each type of inquiry or interaction.
ClickFox CEA provides businesses with capabilities to conduct various types of analysis (Clickfox, 2009). Traffic analysis provides individual customer experience information such as the time taken before, after and between modules within a process. Task analysis enables businesses to examine dominant as well as unique process flow paths, caller difficulties, caller disconnect and transfer to CSA events. This analysis provides insights into customer behaviour and the impact of this behaviour on operational outcomes. Pattern analysis entails the constant evaluation of
This analysis is accomplished through the use of a series of automated patented technologies and processes. ClickFox CEA also utilizes an Artificial Intelligence (AI) recommendations engine that identifies discrepancies in system design, customer experience and the manner in which different customers interact with these systems (Clickfox, 2009). The AI recommendation engine provides recommendations on new, enhanced or simplified paths that effectively as well as efficiently processes customer inquiries or interactions within these applications. The business analysis views such as high level trending dashboards can be populated by analytical data computed during task and traffic analysis. These views can also incorporate the results returned by the AI recommendation engine, thus providing contact centers with the ability to examine crucial information such as key performance indicators, essential process flows, and self-service completion rates.
VoiceObjects Server is a component of VoiceObjects 7 family of products (VoiceObjects, 2009). It is phone application server that provides businesses such as enterprises and telecommunication carriers with the capabilities to develop VoiceXML self-service applications, which during a live call, utilizing information from the Client Relationship Management (CRM) solution or other databases, forms personalized dialogs with a customer. VoiceObjects 7 family of products also provides businesses to develop multimodal phone applications that could employ voice, video, graphics and text interfaces. Integration between the VoiceXML applications and CRM solutions, Enterprise Resource Planning (ERP) solutions as well as other databases is provided by Web service support. This enables self-service applications to access required customer as well as organization resource information. VoiceObjects 7 family of products also provides businesses with an execution environment for these applications that permits remote management, monitoring of multimodal applications as well as online application maintenance for enhancements. Detailed application analysis is also provided (VoiceObjects, 2009).
Enterprise Edition and Network Edition versions of VoiceObjects 7 family of products are available (VoiceObjects, 2009). Network Edition, together with the capabilities provided in the Enterprise Edition, provides businesses such as telecommunication carriers with a multi-tenant environment, thus enabling these businesses to host various phone applications for other organizations.
VoiceObjects Analyzer is the component within the VoiceObjects 7 suite of software that provides businesses with self-service application analysis (VoiceObjects, 2009). It is a complete service analysis environment that can be utilized throughout the enterprise to determine system usage, system as well as application performance, caller bahaviour and speech recognition success. The analytics capabilities of VoiceObjects Analyzer are based on the statistics functionality of VoiceObjects Infostore. VoiceObjects Infostore, the application logging component within the VoiceObjects 7 family of products, enables businesses to store data that is retrieved and transformed from VoiceObjects Servers in a standardized data model (VoiceObjects, 2009).
VoiceObjects Analyzer is designed to process this data into information that assists businesses to gain insight into factors that influence the profitability of their services. Through the use of VoiceObjects Analyzer, businesses can continuously tune and enhance the deployed self-service applications to improve customer acceptance of these services. VoiceObjects Analyzer provides businesses with information that assists contact centers in determining the self-service task completion rates, the dominant paths callers are using within self-service applications, application dialog usage trends, the application system error rate and caller duration statistics. Physical server hardware analysis capabilities are also provided such as workload on servers, current port utilization and balance of load on clusters.
automatically populated with application and system usage information as a caller accesses the self-service applications, the time consuming ETL process is eliminated. When applications are enhanced or extended to provide additional services, modifications to the logging database schema is also no longer required.
Call Analytics VIA is an IVR application and Computer Telephony Integration (CTI) analytics solution (Call Analytics, Inc, 2007). The solution provides caller behaviour statistics required by call center managers, telephony managers, IVR application developers and department managers. The solution provides call center managers with the ability to track the progress of callers through automated IVR self-service solutions. The automated alerts that can be scheduled to be sent to telephony managers when specific defined thresholds are exceeded such as the number of ports available on an IVR platform has exceeded seventy five percent, allows the managers to obtain complete call data when required. IVR application developers are provided with information to determine the bottle-necks within these applications, thus enabling the developers to optimize the self-service solutions. Call Analytics VIA provides reports that assist department managers to ensure that their customers are satisfied with the IVR solutions provided. The Speech module captures complete call utterances for further analysis (Call Analytics, Inc, 2007).
The solution also provides a dashboard view real-time status of the IVR applications and platform performance. This information is displayed in Snapshot, Counter and Trend sections (Call Analytics, Inc, 2007). The Snapshot section summaries the current self-service success rates as well as the overall health of the IVR applications. Snapshot section also includes errors and contained call information. The Counter section illustrates the number of calls received grouped by language selection, account lookup success, menu utilization, transactions as well as Dialed Number Identification Service (DNIS). The Trend section displays graphs of total calls received, menu utilization statistics and calls per DNIS for daily, weekly, monthly or
dashboard and assist in communicating early warnings of potential IVR application as well as platform issues.
The dashboard view, predefined and ad-hoc reports can be accessed utilizing a Graphical User Interface (GUI). Call Analytics VIA also allows reports to be exported to Microsoft Excel for further analysis (Call Analytics, Inc, 2007). The solution also has the capabilities of filtering data in combinations of call date time, caller response input, prompt visited, IVR application name, IVR name, IVR port, transfer to CSA extension number, Automatic Number Identification (ANI), DNIS or call end reason. Furthermore, when a report has been defined, it can be saved for future use (Call Analytics, Inc, 2007).
Call Analytics VIA solution consists of standard predefined reports such as Call end summary, Payments report, Error report, Port capacity report, Frequent caller by account number or ANI report, Total number of call reports, Contained call summary report, Transfer by CSA extension summary report and Total calls per Prompt summary report. The Total number of call reports is daily, weekly, monthly and yearly (Call Analytics, Inc, 2007).
Call Analytics VIA solution can accommodate reporting for multiple IVR platforms. Call Analytics offers hosted as well as on premises deployments. Due to the solution comprising of four components, flexibility is provided in deployment. The solution can be implemented utilizing a single or multiple servers. Call Analytics VIA system comprises of Database, Call Analyst, Call Logger and Utilization Service components (Call Analytics, Inc, 2007).
However, these solutions are expensive (pureXML, 2007), (Clickfox, 2009), (VoiceObjects, 2009) (Call Analytics, Inc, 2007). A number of businesses do implement a solution that has been created by internal resources. These solutions are
The following section details the research objectives and contribution.
1.4
Research objectives and thesis contribution
Earlier in this chapter, section 1.2 gave an introduction to IVR systems. These systems may experience large call volumes. Business analytics for IVR solutions have been implemented to better understand the caller experience as well as behaviour within these systems. The emergences of computational intelligent methods such as Artificial Neural Network (ANN), Fuzzy Inference System (FIS) and Support Vector Machine (SVM) have presented an alternate approach to modeling, which is potentially beneficial. These methods are capable of utilizing large data sets to derive relationships within the data presented.
This research entails the development of a business analytics for IVR application that employs AI methodologies. The classification system is to provide businesses with the capabilities to measure business intelligence performance metric levels such as customer satisfaction, call containment, task completion, efficiency and usability.
Call containment and task completion metrics assist businesses to determine the percentage of callers completing transactions within the IVR successfully, without interacting with a CSA. Efficiency and usability metrics provide businesses with indications of the call durations and difficulties callers experience within the automated applications. In relation to the caller experience, the customer satisfaction metric provides the contact center with a single inclusive indicator of the complete call performance. This metric is based on the above performance measures. The call performance classification system should also provide businesses with implementation detail performance indicators that assist businesses to improve the IVR application performance and therefore caller experience. Metric levels such as
field performance, field attempts and field recognition levels provide IVR application developers with the ability to identify areas of improvement rapidly.
In order to effectively improve customer experience within IVR systems, businesses require not only information such as the number of calls that were contained within the IVR applications and transferred to a CSA, businesses also require detailed measures. The objective of the call classification system is to provide the metrics to improve IVR applications in relation to customer experience and therefore customer satisfaction. As a result, the classification system is to provide businesses with the capabilities to measure essential metrics required by contact centers to enhance IVR applications. Measures such as the number of calls that completed transactions successfully within the automated application as well as the number of calls that were abandoned or transferred to CSA due to recognition difficulties are also to be provided.
The aim of this research is thus to:
1 Design a business analytics for IVR solution based on computational intelligence to assist contact centers in determining IVR application performance in relation to caller experience.
2 Develop a component within the proposed business analytics for IVR solution that assists contact centers to compute implementation detail performance indicators using computational intelligent techniques such as ANN, FIS and SVM. As a result, provide IVR application developers with the capability to identify areas of improvement rapidly.
3 Utilizing ANN, FIS and SVM to develop a component within the proposed business analytics for IVR solution that provides contact centers
4 Propose and implement an ensemble of classifiers for each of the proposed components.
5 Compare the classifiers implemented to determine the superior approach for this application problem.
The major contribution of this thesis is to, therefore, illustrate how computational intelligence methods can be utilized to model caller behaviour based on application logging information to provide businesses with performance indicators. These performance metrics will assist contact centers to improve the caller experience and therefore customer satisfaction.
1.5
Importance of the research
As earlier stated in previous sections, IVR systems experience large call volumes. These call volumes result in vast amounts of application logging events that detail caller interaction. In order to assist contact centers in interpreting and thus effectively utilizing this information, business analytics for IVR solutions have been developed as presented in section 1.3. In this research, computational intelligence methods are utilized to model caller interaction information. As a result, this research proposes another approach into caller behaviour modeling. The other main contributions of this research are:
• Introduce a new research direction into caller interaction modeling through the utilization of computational intelligent methodologies.
• Introduce a new research direction into caller experience performance modeling through the utilization of computational intelligent methodologies.
• Providing an application to understand caller behaviour within IVR systems, which can subsequently be used by businesses to improve caller experience and, therefore, increase caller satisfaction levels. The application will also assist businesses in reducing resources as well as time spent in analyzing information to understand caller behaviour within IVR systems.
• Investigate the capabilities of ANN, FIS and SVM classification techniques in categorizing data extracted from application logging event files.
1.6
Structure of the thesis
Chapter 1 of this thesis has presented vital information that is required to understand the research problem of concern. As a result, IVR systems and business analytics for IVR solutions have been examined. This chapter also states the major objectives and research contributions of this work.
Chapter 2 provides a background on the computational intelligent techniques to be utilized within the proposed IVR caller classification application. These techniques include ANN, Genetic Algorithm (GA), FIS and SVM. A thorough analysis of these techniques is presented.
Chapter 3 describes the proposed call classification system. The source of the data, the application logging event file, is examined. Thereafter, the architecture of the call classification system is presented, thus providing detail into the components of the system. Selection of data and preprocessing techniques utilized are also described.
Chapter 4 examines the components implemented by utilizing ANN computational intelligent techniques. The results yielded by the developed ANN classifiers are
illustrated. The findings of the investigation are presented together with concluding remarks.
Chapter 5 describes the implementation process of the components utilizing FIS computational intelligent techniques. The results achieved by the developed FIS classifiers are examined together with concluding remarks.
Chapter 6 details the utilization of SVM methods in implementing the call classification system components. The results yielded by the developed SVM classifiers are illustrated. The findings of the investigation are examined together with concluding remarks.
Chapter 7 compares the ANN, FIS and SVM classifiers to determine the superior computational intelligent approach for this research problem. Ensembles of classifiers are also presented. The results obtained are illustrated together with conclusions drawn from the analysis.
Finally, Chapter 8 presents the overall conclusion of the thesis, which illustrates the manner in which the research objectives have been achieved. Also, possible further research work is proposed in this chapter.
1.7
Publications
From this research, the following journal and conference publications were made:
- Patel, P. B and Marwala, T:2009, Caller Behaviour Classification: A Comparison of SVM and FIS Techniques, Advances in Computational Intelligence, Springer-Verlag, vol.116/2009, pp.199-208.
- Patel, P.B and Marwala, T.: 2009, Caller Interaction Classification: A Comparison of Real and Binary Coded GA-MLP Techniques, Advances in Neuro-Information Processing: Lecture Notes in Computer Science, Springer-Verlag, vol. 5507, pp. 728-735.
- Patel, P. B. and Marwala, T.: 2008, Interactive Voice Response field classifiers, 2008 IEEE International conference on Systems, Man and Cybernetics, pp. 3425-3430.
- Patel P. B. and Marwala, T.: 2009, Genetic Algorithms, Neural Networks, Fuzzy Inference System, Support Vector Machines for Call performance classification, IEEE 2009 International Conference on Machine Learning and Applications, accepted, to be published.
- Patel P. B. and Marwala, T.: 2009, Caller behaviour classification using computational intelligent methods, International Journal of Neural Systems (IJNS), under review.
Chapter 2
Computational Intelligent techniques
2.1
Introduction
This chapter examines the computational intelligent techniques that have been considered in the research. Artificial Neural network (ANN), Genetic Algorithm (GA), Fuzzy Inference System (FIS) and Support Vector Machines (SVM) are therefore examined.
2.2
Artificial neural network
Due to the difficulty and complexity of statistical techniques as well as the high level of proficiency required to utilize such methods, there has been a significant increase in the usage of ANNs. This increase has also been attributed to the fact that ANNs can be applied to virtually every field in industry. For example, ANNs can be utilized in medical diagnosis, machine fault diagnosis, fingerprint recognition as well as financial creditworthiness evaluation applications. These networks can also be employed in product line development to control the quality of products manufactured. ANN research has gathered enormous momentum in recent years. As a result, this field of study has been introduced in many universities.
ANNs were introduced based on the understanding of neurology in the early 1940s. They have been motivated by the fact that scientists are challenged to effectively utilize machines on tasks currently solved by humans (Smith, 2003), (Orr, 2006), (Bishop, 1995). ANNs can be considered as an exceptionally robust data-modeling tool that consists of a network of interconnected simple processors or units, which individually operate on local data and together these units capture as well as numerically represent the intricate input output relationships of complex systems (Neuro Solution Technologies, 2009), (Haykin, 1998). These networks are data-mining techniques that have been inspired by the desire to develop artificial systems capable of performing ‘intelligent’ computations similar to those performed within the human brain. An ANN acquires its knowledge through repeated presentations of data. It ‘learns’ by adjusting the weights of the network connections, which is similar to adjusting the synaptic weights within the inter-neuron connections within the human brain (Neuro Solution Technologies, 2009). The ANN creates its own organization or representation of the application problem information during training from the data observed. Thereafter the network will exhibit some capability for
generalization in obtaining rather accurate outputs when presented with new unseen data.
An advantage of ANNs is their ability to represent both linear as well as non-linear relationships. As a result, these networks are able to approximate any computable function to arbitrary precision and are known as universal approximators (Bishop, 1995). ANNs are effective within application problems in which an algorithmic solution cannot be formulated. ANNs have the capabilities of adaptive learning; the network learns how to do tasks based on training data or initial experience (Bishop, 1995). ANNs require short computational times for modeling of systems.
ANNs do not experience the many drawbacks statistical techniques on handling data possess (Smith, 2003), (Orr, 2006). Statistical methods do impose restrictions on the number of input data. However, ANNs do not. Statistical regressions are performed utilizing unrealistic simple dependency linear and logarithmic functions. ANNs do not require intensive mathematical techniques to transform data. However, statistical methods do require intensive mathematical transformations. Due to ANNs non-linear nature, these methodologies are better able to account for complexity of human behaviour and also these techniques provide tolerance to missing or erroneous information.
The integration of ANNs into the modern environment is a major challenge in industry. This is due to ANNs, when applied to large scale problems, at times, become unstable. Also, due to ANNs negligence of the effects of noise, these networks, at times, do not react appropriately to abrupt changes within the application problem data. ANNs are also viewed as black boxes with unknown rules that are utilized internally.
2.2.1 Artificial neural network architectures
There exists a great diversity of ANN architectures, such as: - Multi-Layer Perceptron (MLP)
- Radial Basis Function (RBF) - Recurrent Neural Network (RNN) - Hierarchical Mixture of Expert (HME) - Self-Organizing Map (SOM)
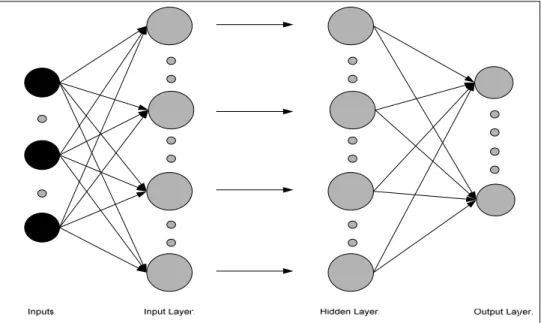
However, the most common, and often used in practical applications, is that of a feed-forward structured neural network (Nabney, 2002), (Bishop, 1995). It has been stated that these ANN architectures with a single hidden layer, provided with sufficient data, can be used to model any function (Beale and Jackson, 1990). It should be mentioned that there are situations where it is necessary or worthwhile in utilizing two or more hidden layers. This is dependent on the primary purpose of the ANN within the application.
Among the family of feed-forward structured networks, the MLP and the RBF ANN architectures are possibly the most extensively employed ANNs in pattern classification (Nabney, 2002). MLP networks employ correlation-based algorithms, whereas RBF networks utilize distance-based algorithms (Reyneri and Sgarbi, 1997). Both networks function in a supervised manner. Due to the non-linear capabilities of these networks, they are said to be excellent universal approximators that provide highly accurate solutions (Bishop, 1995). As a result, these networks produce very practical tools for classification and inverse problems.
Due to the fact that RNN require to be unfolded (Bishop, 1995), these ANN are complex to design. HME networks result in ANNs that over-fit the application problem data and SOM networks have characteristics of overcrowding as well as
result, the MLP and RBF feed-forward structured ANNs have been considered in this research. These ANNs will be examined in the following section.
Multi-Layer Perceptron (MLP)
The MLP network evolved from the combination of many simple components. The most fundamental of these is the mathematical model of the neuron. In 1943 McCullock and Pitts proposed this neural model, which then formed the basis for formal calculus of brain activity (Chen, 1991). In 1958 Rosenblatt introduced the Perceptron model. This was an elementary visual system that could be taught to recognize a limited class of patterns (Chen, 1991). It was this model that then formed the foundation upon which most forms of AI were born (Huang and Lippmann, 1988). A perceptron can be considered as a device that computes the weighted sum of its inputs. It then propagates this sum through an activation function to produce the output. This activation function can be linear or nonlinear (Chen, 1991). However, a network of linear perceptrons was found to have serious computational limitations (Chen, 1991). These limitations were overcome by adding layers of nonlinear perceptrons that resulted in the MLP ANN.
Figure 2.1 illustrates a feed-forward structured network. As mentioned above, the MLP ANN has a feed-forward structured network architecture whereby each unit receives inputs only from lower layer units. Feed-forward structured networks do not have connections between units in the same layer. These networks usually comprises of input, hidden and output layers, all of which are interconnected with respect to the hidden layer.
The training of these networks is accomplished through backpropagation and a complex nonlinear hidden as well as output weights optimization. At iterations, the error of the network is assessed by forward propagating the inputs through the
network and the derivative of this error is calculated with respect to each weight within the network.
The error function generally used in ANN computation is the squared difference between the actual and desired outputs. Optimization techniques, such as the scaled conjugate gradient method, are then used to minimize the error function by altering the weights, initially in the output layer and then the hidden layer. Essentially, the error is backpropagated from the output of the network, through the output weights and to the hidden weights (Bishop, 1995).
During the development of the MLP ANN, over-fitting as well as under-fitting should be avoided. This can be accomplished by dividing the data into three sets. Over-fitting occurs when the network does not generalize but rather tends to memorize the training data. Under-fitting occurs when the network does not follow the data at all (Bishop, 1995). The data is divided into training, validation and test sets. The training data set is used to train the ANN to find the general pattern between its inputs and outputs. The validation data set is used to assess the network and the test data is used to confirm the prediction quality of the developed networks.
The hidden and output layers contain activation functions. The choice of the hidden-unit activation function for the MLP network is mainly dependent on the application of the network (Bishop, 1995). However, it has been determined that the hyperbolic tangent activation function offers a practical advantage of giving rise to faster convergence during training (Nabney, 2002). There are three major forms of the MLP network output-unit activation function. These are the linear, logistic sigmoidal and softmax activation functions (Nabney, 2002). It has been stated that the appropriate selection of the MLP network output-unit activation function for a pattern classification problem is the logistic sigmoidal function (Nabney, 2002). Equation 2.2.1 illustrates this activation function.
) exp( 1 1 k k a y − + = (2.2.1) where,
a= output value of hidden layer activation function
k = 1,...,c
c = total number of network outputs
Radial Basis Function (RBF)
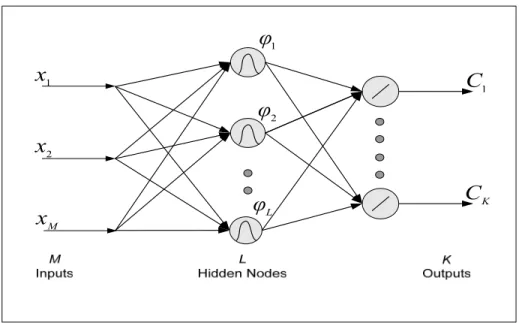
The RBF networks have become a popular alternative to the MLP network approach (Haykin, 1998). RBF networks are inspired from traditional statistical classification techniques (Haykin, 1998). These are based on Cover’s theorem on the separability of patterns. This theorem states that nonlinearly separable patterns can be separated linearly if the pattern is cast nonlinearly into a higher dimensional space. Therefore, the RBF network converts the pattern to a higher dimension after which it classifies the pattern linearly (Haykin, 1998).
The RBF network hidden layer, utilizing a set of basis functions, performs a nonlinear mapping from the input space into a higher dimensional space in which the patterns become linearly separable. In order to accomplish this, the RBF network employs a Gaussian hidden-unit activation function. The output layer usually implements a linear weighted sum of the hidden layer outputs (Haykin, 1998). As a result, a linear activation function is utilized within the RBF network output layer. Figure 2.2 illustrates the RBF ANN architecture.
1
x
2x
Mx
1φ
2φ
Lφ
1C
KC
Similar to the MLP ANN implementation, during the development of the RBF ANN, over-fitting and under-fitting should be avoided. This can be accomplished by dividing the data into training, validation and test sets. The training data set is used to train the RBF ANN to identify the general pattern between its inputs and outputs. The validation data set is employed to evaluate the network and the test data is utilized to confirm the prediction quality of the developed RBF ANN.
2.3
Genetic Algorithm (GA)
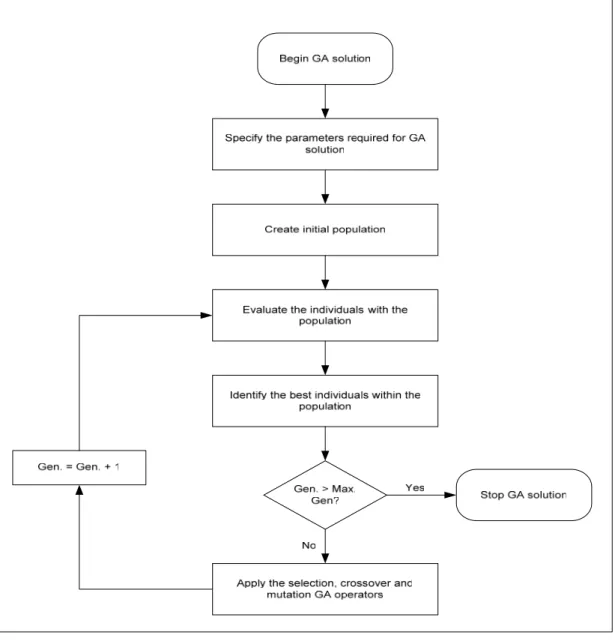
Utilizing a form of directed random search process, evolutionary methods conduct an exploration to identify optimum solutions, without previous problem knowledge. GA solutions are evolutionary techniques employed to resolve optimization problems (Goldberg, 1989). Due to the intuitiveness, ease of implementation and ability to effectively solve highly nonlinear problems that are typical of complex engineering systems, these algorithms have been popular in academia and industry. After the original work conducted by Holland (Holland, 1975), GA solutions were developed. These are powerful set of stochastic global search techniques that have yielded good results in a range of problems across different industries (Rababaah et al., 2005), (Selouani and O’Shaughnessy, 2003), (Sasaki et al., 2001).
GA solutions have been considered as an optimization technique in this research due to its superiority over other optimization techniques (Michalewicz, 1992). Due to GA solutions considering a population of candidate solutions rather than a single candidate solution, the GA methodology differs from conventional optimization techniques. The populations of candidate solutions undergo a process of reproduction of individuals that advances individuals with better fitness values than the other individuals in the previous generation (Michalewicz, 1992). GA solutions provide an alternate technique to the existing conventional optimization methods in resolving problems where these methods are inappropriate. GA techniques are feasible and
optimum solutions than conventional methods. GA solutions transform the optimization problem into an appropriate form as opposed to other evolutionary approaches that process the problem unchanged.
GA solutions have been employed in resolving engineering problems that are complex and difficult to solve using conventional optimization methods. These algorithms manage, maintain and manipulate populations of candidate solutions utilizing a survival of the fittest strategy in their quest for an optimal better solution. In order to improve successive generations, the fittest individuals of any population tend to reproduce. However, as evident in biological evolution, inferior individuals can also survive and reproduce. The implementation of GA solutions involves the identification and determination of the chromosome representation, selection function, genetic operators, initialization function, termination function as well as evaluation function to be used (Holland, 1975), (Booker et al., 1989). A description of these essential components within GA solutions follows.
2.3.1
Chromosome representation
The chromosome representation scheme defines the manner in which the problem is structured in the GA solution. The representation used also governs the genetic operators that are to be employed (Booker et al., 1989). An individual or chromosome comprises of a sequence of genes. Various types of chromosome representations such as binary digits, floating point numbers, integers, symbols and matrices exist.
In traditional GA solutions, binary representation has been used for chromosomes (Houck et al., 1995). This results in an even discrete depiction of the real optimization problem. Within these binary coded GA solutions, binary substrings representing each parameter with a desired precision are concatenated to form a chromosome. Therefore, a large number of variables in a real world problem would result in
chromosomes encoded in long strings. Also, there is a discrepancy between the binary representation space and the actual problem space. For example, two points close to each other in the real space might be far away in the binary represented space. However, natural representations are more efficient and may result in better solutions.
In order to resolve these problems, floating point representation of parameters as a chromosome is utilized (Michalewicz, 1996). It has been stated, in relation to Central Processing Unit (CPU) time, floating point or real coded representations are more efficient. This representation also produces higher precision with more consistent results across replications (Michalewicz, 1996). In these real coded GA solutions, a chromosome is coded as a finite length string of the real numbers corresponding to the real world problem variables. Real coded GA solutions are robust, accurate as well as efficient because they are conceptually closest to the real world problem and moreover, the string length reduces to the number of variables. It has been reported that the real coded GA solutions outperformed binary coded GA solutions in many design problems (Janikow and Michalewicz, 1991). This research will determine if this is true in relation to the application problem of concern.
2.3.2
Selection function
In order to produce successive generations, the selection of individuals is important within GA solutions. The selection function identifies the individuals that will survive and proceed onto the next generation. A probabilistic selection is performed based upon the fitness of the individual such that the superior individuals have a higher possibility of being selected and therefore advancing onto the next generation. Several selection methods such as roulette wheel selection and its extensions, scaling techniques, tournament, elitist models and ranking selection techniques do exist (Houck et al., 1995). However, in this research normalized geometric ranking and
tournament selection functions are employed within the GA solutions developed. As a result, these selection functions are described below.
Ranking selection function methods utilize the evaluation function to map individual solutions to a completely ordered set, thus allowing minimization and negativity. When all individual solutions are sorted, these selection function techniques assign Pi
based on the rank of individual solution i. Normalized geometric ranking selection function, defines Pi for each chromosome or individual solution using equation
(2.3.1) (Houck et al., 1995). 1 1− − ′ =q( q)r i P (2.3.1) P q q q ) 1 ( 1− − = ′ (2.3.2) where,
q = probability of selecting the best individual
r = rank of the individual, where best equals 1
P = population size
The tournament selection function is a common selection mechanism used within GA solutions (Booker et al., 1989). This selection function method is simple to implement and is efficient for both non-parallel and parallel architectures. Similar to the ranking methods, the tournament selection function method only requires the evaluation function to map individual solutions to a partially ordered set. However, this selection technique does not assign probabilities to the individual solutions. This selection method begins by randomly selecting a number of individuals from the current population. The number of individuals is set by the tournament size. In this research, three individual solutions competed within each tournament. The selection method then compares the fitness of these individuals competing and inserts the
individual solution with the best fitness value into the new population. This process is repeated until an appropriate population is achieved.
2.3.3
Genetic operators
Crossover and mutation genetic operators are employed to provide basic search mechanisms for the GA solution. These operators produce new solutions based on existing individual solutions in the population. Crossover genetic operators employ two individuals as parents to produce two new individual solutions. However, mutation operators alter one individual to yield a single new solution. Simple, arithmetic and heuristic crossover operators are usually utilized. Commonly employed mutation operators are boundary, non-uniform, uniform and multi-non-uniform operators. However, the types of operators used are dependent on the chromosome representation employed within the GA solution. In this research, binary and real coded chromosome representations were considered. As a result, the binary coded GA solutions employed binary mutation and simple cross over genetic operators. However, the real coded GA solutions utilized non-uniform mutation and arithmetic cross-over genetic operators (Houck et al., 1995). Therefore, these genetic operators are described in this thesis.
Equation (2.3.3) illustrates the binary mutation that entails flipping each bit in every individual within the population with probability pm (Chang and Lin, 2001).
⎪⎩ ⎪ ⎨ ⎧ − < = otherwise , ) 1 , 0 ( if , 1 ' i x m p U i x i x (2.3.3)
Equation (2.3.4) and equation (2.3.5) illustrates the simple crossover genetic operator that employs randomly generated number r from a uniform distribution between 1
⎩ ⎨ ⎧ < = otherwise , if , ' i i i y r i x x (2.3.4) ⎩ ⎨ ⎧ < = otherwise , if , ' i i i x r i y y (2.3.5)
As illustrated in equation (2.3.6), the non-uniform mutation genetic operator employed by the real coded GA solutions selects one variable, j, and sets this variable equal to a non-uniform random number. This is mathematically represented as follows (Chang and Lin, 2001):
⎪ ⎩ ⎪ ⎨ ⎧ ≥ + − < − + = otherwise , , 5 . 0 if ) ( ) ( , 5 . 0 if ) ( ) ( ' 1 1 i i i i i i i i x r G f a x x r G f x b x x (2.3.6) where, b G G r G f( ) ( (1 )) max 2 − = (2.3.7)
r1, r2 = uniform random numbers between 0 and 1.
G = current generation.
Gmax = maximum number of generations.
b = shape parameter.
Equation (2.3.8) and equation (2.3.9) illustrates the arithmetic crossover operator that produces complimentary linear combinations of the parents (Chang and Lin, 2001).
Y r X r X' = +(1− ) (2.3.8) Y r X r Y' = (1− ) + (2.