Micro-Batching Growing Neural Gas for Clustering Data
Streams using Spark Streaming
Mohammed Ghesmoune, Mustapha Lebbah, Hanene Azzag
University of Paris 13, Sorbonne Paris CityLIPN-UMR 7030 - CNRS
99, av. J-B Cl´ement – F-93430 Villetaneuse, France [email protected]
Abstract
In recent years, the data stream clustering problem has gained considerable attention in the literature. Clustering data streams requires a process capable of partitioning observations continuously while taking into account restrictions of memory and time. In this paper we present MBG-Stream, a Micro-Batching version of the growing neural gas approach, aimed to clustering data streams by making one pass over the data. MBG-Stream allows us to discover clusters of arbitrary shapes without any assumptions on the number of clusters. The proposed algorithm is implemented on a “distributed” streaming platform, the Spark Streaming API, and its performance is evaluated on public data sets.
Keywords: Data Stream Clustering, GNG, Topological Structure, Micro-Batch Streaming
1
Introduction
When applying data mining techniques, or more specifically clustering algorithms to data streams, restrictions in execution time and memory have to be considered carefully. Cur-rently, distributed streaming systems are based on two processing models,record-at-a-time and micro-batching. On a record-at-a-time processing model, long-running stateful operators pro-cess records as they arrive, update internal state, and emit new records. On the other side, the micro-batching processing model runs each streaming computation as a series of deterministic batch computations on small time intervals. Among the available frameworks that implements themicro-batching processing model, we can find Spark Streaming [1]. It is an extension of the core Spark API that enables high-throughput, reliable processing of live data streams.
In a previous work, G-Stream [2] was proposed as a data stream clustering approach based on the Growing Neural Gas algorithm. G-Stream uses a stochastic approach to update the prototypes, and it was implemented on a “centralized” platform. In this paper, we propose MBG-Stream, a novel algorithm for discovering clusters of arbitrary shape in an evolving data
Volume 53, 2015, Pages 158–166 2015 INNS Conference on Big Data
158Selection and peer-review under responsibility of the Scientific Programme Committee of INNS-BigData2015 c
stream. MBG-Stream is implemented on a distributed streaming platform based on the micro-batching processing model, i.e., the Spark Streaming API. In the proposed algorithm, the topological structure is represented by a graph wherein each node represents a cluster, which is a set of “close” data points and neighboring nodes (clusters) are connected by edges. Starting with only two nodes, the graph size is not fixed but may also evolve as several nodes (clusters) are created in each iteration. We use an exponential fading function to reduce the impact of old data whose relevance diminishes over time. For the same reason, links between nodes are also weighted by an exponential function. The data received in each interval is stored reliably across the cluster to form an input dataset for that interval. Once the time interval is completed, this dataset is processed via deterministic parallel operations, such asmap and reduce to produce new datasets representing either program outputs or intermediate states [1]. The input data is split and the master assigns the splits to Map workers. Each worker processes the correspond-ing input split, generates key/value pairs and writes them to intermediate files (on disk or in memory). The Reduce function is responsible for aggregating information received from Map functions. The remainder of this paper is organized as follows: Section 2 is dedicated to related works. Section 3 describes the MBG-Stream algorithm. Section 4 reports the experimental evaluation on both synthetic and real-world data sets. Section 5 concludes this paper.
2
Related Works
This section discusses previous works on data stream clustering problems, and highlights the most relevant algorithms proposed in the literature to deal with this problem. Most of the existing algorithms divide the clustering process in two phases: (a) Online, the data will be summarized; (b) Offline, the final clusters will be generated. Both CluStream [3] and Den-Stream [4] use a temporal extension of the Clustering Feature vector(called micro-clusters) to maintain statistical summaries about data locality and timestamps during the online phase. By creating two kinds of micro-clusters (potential andoutlier micro-clusters),DenStream over-comes one of the drawbacks of CluStream, its sensitivity to noise. In the offline phase, the micro-clusters found during the online phase are considered aspseudo-pointsand will be passed to a variant of k-means in the CluStream algorithm (resp. to a variant of DBScan in the DenStream algorithm) in order to determine the final clusters. ClusTree[5] is an anytime algo-rithm that organizes micro-clusters in a tree structure for faster access and automatically adapts micro-cluster sizes based on the variance of the assigned data points. Any clustering algorithm, e.g. k-means or DBScan, can be used in its offline phase. The merge step is performed by a means of a data structure, named thebucket set. The reduce step is performed by a significantly different summary data structure, the coreset tree. [6], [7] and [8] give approximations of thestreaming k-means algorithm. G-Stream [2] is an extension of the GNG algorithm to data streams. Whereas all the previous algorithms are implemented on “centralized” platforms, we propose in this paper a new approach for clustering data streams implemented on a distributed platform.
3
Micro-Batching Clustering
In this section we introduce Micro-Batching Growing Neural Gas for Clustering Data Streams (MBG-Stream) and highlight some of its novel features. MBG-Stream is based on Growing Neural Gas (GNG), which is an incremental self-organizing approach that belongs to the family of topological maps such as Self-Organizing Maps (SOM) [9] or Neural Gas (NG) [10]. It is
an unsupervised algorithm capable of representing a high dimensional input space in a low dimensional feature map. Typically, it is used for finding topological structures that closely reflect the structure of the input distribution. We assume that the data stream consists of a sequenceDS={x1,x2, ...,xn}ofn (potentially infinite) elements of a data stream arriving at timest1, t2, ..., tn, where xi= (x1i, x2i, ..., xdi) is a vector ind. We denote byX1={x1, ...,xp} where pis the size of the window, thus DS ={X1,X2, ...,XL}. At each time, MBG-Stream is represented by a graph C where each node represents a cluster. Each node c ∈ C has (a) a prototype wc = (w1c, wc2, ..., wdc) representing its position; (b) πc representing the weight of this node; (c) error(c) an error variable representing the distance between this node and the assigned data-point. When data arrive in a stream, we may want to estimate clusters dynamically, updating them as new data arrive. An implementation of a Growing Neural Gas algorithm over Data Stream on a “centralized” platform would be as follows [2]: Starting with two nodes, and as a new data point is reached, the nearest and the second-nearest nodes are identified, linked by an edge, and the nearest node with its topological neighbors are moved toward the data point. Each node has an accumulated error variable and a weight, which varies over time using a fading function. Using an edge management procedure, one, two or three nodes are inserted into the graph between the nodes with the largest error values. Nodes can also be removed if they are identified as being superfluous.
However, the design of a “distributed” version of G-Stream [2] would raise difficulties. MBG-Stream can discover clusters of arbitrary shape in an evolving data stream. It operates with parameters to control the decay (or “forgetfulness”) of the estimates. The algorithm uses a generalization of the mini-batch GNG update rule. In the adaptation step of the GNG algorithm, the nearest node and all of its neighbors are moved in the direction of the data point. However, in MBG-Stream (see Algorithm 1 for detail), for each batch of data Xp, we assign all points xi to their best match unit, compute new cluster centers, then update each cluster. The update rule, i.e., the adaptation step, in a mini-batch version without taking into account the neighbors of the referent would be as described in Equation 1:
w(ct+1)= w(ct)n( t) c α+z( t) c m( t) c n(ct)α+m( t) c (1)
whereas Equation 2 updates the number of points assigned to the cluster, where w(ct) is the previous center for the cluster,n(ct)is the number of points assigned to the cluster thus far,z(ct) is the new cluster center from the current batch, andm(ct)is the number of points added to the clusterc in the current batch.
n(ct+1)=n( t) c +m(
t)
c (2)
In most data stream scenarios, more recent data can reflect the emergence of new trends or changes in the data distribution [11]. There are three window models commonly studied in data streams: landmark, sliding and damped. We consider the damped window model, in which the weight of each data point decreases exponentially with time via afading function. The weight of each node decreases exponentially with timetvia a decay factor parameter 0< α <1, i.e.,
π(ct+1)=π( t)
c α (3)
If the weight of a node is less than a threshold value then this node is considered as outdated and then deleted (with its links). The decay factor can be used to ignore the past: with α= 1 all data will be used from the beginning; withα= 0 only the most recent data will be used. This is analogous to thefading function [11] which is defined as follows : f(t) = 2−λt, whereλ >0.
In a general case, when the referent moves toward a data-point, it also moves its neighborhood toward this point [9]. In our model, we use Equation 4 to carry out the adaptation step:
w(ct+1)= w(ct)n( t) c α+ r∈CK(r, c)z (t) r m( t) r n(ct)α+ r∈CK(r, c)m (t) r (4) wherez(rt)is the previous center for the clusterr(which is a neighbor of the considered referent node),K is called theneighborhood function defined in Equation 5, whereδ(r, c) is the length of the shortest path between nodesrandc:
K(r, c) = exp −δ(r, c) T . (5)
The function updateRule performs operations related to updating graph edges. The way to increase the age of edges is inspired by the fading function in the sense that the creation time of a link is taken into account. Contrary to thefading function, the age of the links will be strengthened by the exponential function 2λage(t−t0), whereλ
age>0, defines the rate of growth of the age over time, t denotes the current time andt0 is the creation time of the edge. The next step is to add a new edge that connects the two closest nodes. The last step is to remove each link exceeding a maximum age, since these links are no longer useful because they were replaced by younger and shorter edges that were created during the graph refinement in step 9. The input data is split and the master assigns splits to Map workers. Each worker processes
Algorithm 1:MBG-Stream
Input: DS={x1,x2, ...,xn},α,λage, the number of nodes to add at each iteration, πmin,agemax
Output: set of nodesC={c1, c2, ...} and their prototypesW={wc1,wc2, ...}
1 Initialize of the model by creating a graph of two nodes (the first 2 data-points)
2 whilethere is a micro-batch to proceed do
3 Dt←get the micro-batch of data points arrived at time intervalt
4 Apply themapping step as described in Function map
5 Apply thereduce step as described in Function reduce
6 Adaptation step: updateRule(pointStats,α,λage,agemax)
7 Update the variable error of each node
8 Applyfading, delete isolated nodes
9 Add new nodes as described in Function addNewNodes
10 Decrease the error of all units
11 end
the corresponding input split, generates key/value pairs and writes them to intermediate files (on disk or in memory). Thekeycorresponds to thebmuwhereas itsvalue represents a tuple of (bmu2,error,point, 1). Then the master will launchreduce tasks that take as input both the results of the maps and the results of the previous interval’s reduces. The Reduce function is responsible for aggregating information received from Map functions. For each key, the Reduce function works on the list of values,closest. To compute the centroid of each node, the Reduce function groups bybmuand sums the values received in theclosestlist. The final output is the list pointStats. Each element ofpointStats contains a bmu, as key, with the second nearest node, the sum of errors, the sum and the count of points assigned to each node, as thevalue.
Functionmap(Dt: thet-th micro-batch of data points)
1 foreach xti∈ Dt do
2 Key←bmu1, the nearest node
3 Value←(bmu2, error,xti,1) such as: bmu2is the second nearest node, and error=xti−wbmu12
4 Emit (Key, Value)
5 end
Functionreduce(keyt, List closest)
Output: centroidt: centroid of thet-th micro-batch,countt: number of data points in thet-th micro-batch
1 bmu2←0;errort←0;sumt←0;countt←0;
2 foreach valuet∈closestdo
// such as valuet is the corresponding value of the pair (keyt, Value)
3 bmu2←bmu2 + the 1-st value of tuplevaluet
4 errort←errort+ the 2-nd value of tuplevaluet
5 sumt←sumt+ the 3-th value of tuplevaluet
6 countt←countt+ the 4-th value of tuplevaluet
7 end
8 centroidt← countsumt t
4
Experimental Evaluations
In this section, we present an experimental evaluation of the MBG-Stream algorithm. We compared our algorithm with several well-known and relevant data stream clustering algorithms, including ClusTree, DenStream, and the MLlib implementation of Streaming-KMeans. Our experiments were performed on Spark Streaming platform using real-world and synthetic data sets. All the experiments are conducted on a PC with Core(TM)i7-4800MQ with two 2.70 GHz processors, and 8GB of RAM, which runs Ubuntu 13.10 operating system.
FunctionupdateRule(List pointStats,α, λage,agemax)
// Decrease the weight of nodes
1 foreachc∈ C do πc ←α.πc ;
2 foreachps∈pointStatsdo
// ps is a tuple: (bmu, (bmu2, error, sum, count))
3 Calculate the new centroid as described in Equation 4
4 Increment the age of all edges emanating frombmuand weight them
5 if bmu andbmu2 are connected by an edge thenset the age of this edge to zero ;
6 elsecreate an edge betweenbmuandbmu2, and mark its time stamp;
7 end
8 Remove the edges whose age is greater thanagemax. If this results in nodes having no emanating edges, remove them as well
FunctionaddNewNodes(η : number of nodes to add)
1 forj←1 to η do
2 Find the node with the largest error
3 Find the neighborf with the largest accumulated error
4 Add the new noderhalf-way between nodesqandf: wr←0.5(wq+wf)
5 Insert edges connecting the new unitrwith units qandf, and remove the original edge betweenqandf. Remove the original edge betweenqandf
6 Initialize the weight ofrand the age of edges emanating fromrto zero
7 Decrease the error variables ofq andf by multiplying them with a constant where: 0< <1
8 Initialize the error variable ofrwith the new value of the error variable ofq
9 end
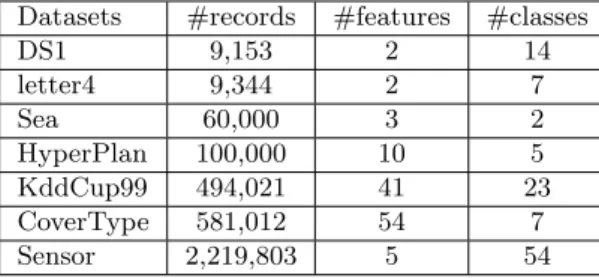
Table 1: Overview of all data sets.
Datasets #records #features #classes
DS1 9,153 2 14 letter4 9,344 2 7 Sea 60,000 3 2 HyperPlan 100,000 10 5 KddCup99 494,021 41 23 CoverType 581,012 54 7 Sensor 2,219,803 5 54
4.1
Data Sets and Quality criteria
To evaluate the clustering quality and scalability of the MBG-Stream algorithm both real and synthetic data sets are used. The synthetic data sets used are DS1 and letter4. All the others are real-world publicly available data sets. Table 1 overviews all the data sets used. DS1 is generated by http://impca.curtin.edu.au/local/software/synthetic-data-sets.tar. bz2. The letter4 data set is generated by a Java code https://github.com/feldob/ Token-Cluster-Generator. The Sea data set was taken from http://www.liaad.up.pt/ kdus/products/datasets-for-concept-drift. The HyperPlan data set was taken from [12]. The real-world databases were taken from the UCI repository [13], which are the KDD-CUP’99 Network Intrusion Detection stream data set (KddCup99) and the Forest CoverType data set (CoverType) respectively.
The algorithms are evaluated using three performance measures: Accuracy (Purity), Normal-ized Mutual Information (NMI) and Rand index. The value of each measure lies between 0 and 1. A higher value indicates better clustering results. The Accuracy (Purity) averages the fraction of items belonging to the majority class of in each cluster. Acc =
K i=1
|N di| |Ni|
K ×100%,
where K denotes the number of clusters,Nd
i denotes the number of points with the dominant class label in clusteri, andNi denotes the number of points in clusteri. Intuitively, the accu-racy (purity) measures the purity of the clusters with respect to the true cluster (class) labels that are known for our data sets [4]. Normalized mutual information provides a measure that is independent of the number of clusters as compared to purity [14]. It reaches its maximum value of 1 only when the two sets of labels have a perfect one-to-one correspondence. The Rand index measures how accurately a clusterer can classify data elements by comparing cluster labels with
Table 2: Comparing G-Stream with different algorithms.
Datasets MBG-Stream Streaming-KMeans DenStream ClusTree DS1 Acc 0.9773 0.8067 0.7740 0.6864 NMI 0.7019 0.7274 0.6973 0.7064 Rand 0.8473 0.8657 0.8491 0.8442 letter4 Acc 0.8566 0.4848 0.8110 0.8110 NMI 0.6844 0.4672 0.1637 0.2425 Rand 0.8542 0.6915 0.5019 0.5514 Sea Acc 0.8374 0.6269 0.8240 0.8224 NMI 0.1381 0.0018 0.1646 0.1583 Rand 0.4708 0.503 0.4700 0.4917 HyperPlan Acc 0.4282 0.3883 0.4250 0.4380 NMI 0.0203 0.0056 0.0208 0.0170 Rand 0.7056 0.6257 0.6038 0.6529 KddCup99 Acc 0.9262 0.9832 0.9544 0.8182 NMI 0.6622 0.7035 0.6290 0.5724 Rand 0.8367 0.8382 0.8164 0.8289 CoverType Acc 0.6527 0.4957 0.5850 0.5850 NMI 0.1653 0.0727 0.0475 0.0362 Rand 0.6233 0.5931 0.4604 0.5080 Sensor Acc 0.1086 0.0690 0.5850 0.5850 NMI 0.1471 0.0970 0.0475 0.0362 Rand 0.9738 0.9555 0.4604 0.5080
the underlying class labels.
4.2
Evaluation and performance comparison
This section aims to evaluate the clustering quality of the MBG-Stream and compare it to well-known data stream clustering algorithms. As explained in section 3, MBG-Stream algo-rithms start with two nodes. For comparison purposes, we used the MLlib implementation of Streaming-KMeans (this latter algorithm was also coded in the Spark Streaming platform) 1. Comparison is also performed with DenStream [4] and ClusTree [5] from thestream R pack-age [15]. Streaming-KMeans was evaluated by setting the k parameter to the right number of classes of each dataset. DenStream was evaluated by performing a variant of the DBScan algorithm in the offline step. ClusTree was evaluated by performing the k-means algorithm in the offline step by setting the k parameter to 10. All experiments were repeated 10 times and the results (the average value) are reported in Table 2. In this Table, it is noticeable that G-Stream’s Accuracies (Acc) are higher for all data sets as compared to Streaming-KMeans, DenStream and CluStree, except for ClusTree for the HyperPlan data set and for Streaming-KMeans for the KddCup99 data set. Its NMI values are higher than the other algorithms except for Streaming-KMeans for DS1 and KddCup99 data sets. Its Rand index values are higher than the other algorithms except for Streaming-KMeans for Sea and DS1 data sets. We recall that MBG-Stream proceeds in one single phase whereas Streaming-KMeans, DenStream and ClusTree proceed in two phases (online and offline phase).
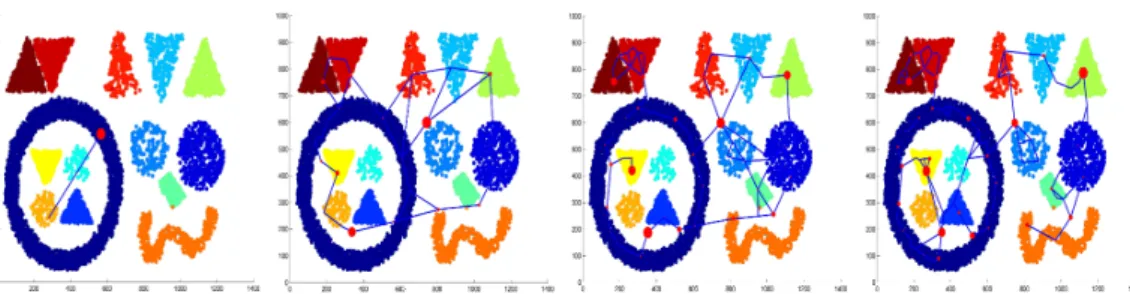
Figure 1: Evolution of graph creation of MBG-Stream on DS1 (data set and topological result). The intermediate graph after seeing the first window’s data points; the 1/3 of all windows; the 2/3 of all windows; and the final graph.
4.3
Visual Validation
Figure 1 shows the evolution of the node creation by applying MBG-Stream on the DS1 data set (colored points represent data points of the data stream and red points are nodes of the graph with edges in blue lines; each color of the data points correspond to class of labels and the size of the nodes of the graph are proportional to their weight). It illustrates that MBG-Stream manages to recognize the structures of the data stream and can separate these structures with the best visualization.
5
Conclusion
In this paper, we have proposed MBG-Stream, an efficient method for topological clustering an evolving data stream in an online manner. In MBG-Stream, the nodes are weighted by a fading function and the edges by an exponential function. MBG-Stream is implemented on a distributed streaming platform based on the micro-batching processing model. Experimental evaluation over a number of real and synthetic data sets demonstrates the effectiveness and efficiency of Stream in discovering clusters of arbitrary shape. The performance of MBG-Stream, in terms of clustering quality as compared to three relevant data stream algorithms are promising. We plan in the future to test the speed-up of MBG-Stream on large clusters, to extend it to deal with binary, categorical, and mixed data streams, and also to make our algorithm as autonomous as possible.
Acknowledgments: This research has been supported by the French Foundation FSN, PIA Grant Big data-Investissements d’Avenir. The project is titled ”Square Predict” (http://square-predict.net/). We thank anonymous reviewers for their insightful remarks.
References
[1] M. Zaharia, T. Das, H. Li, S. Shenker, I. Stoica, Discretized streams: An efficient and fault-tolerant model for stream processing on large clusters, in: Proceedings of the 4th USENIX Conference on Hot Topics in Cloud Ccomputing, HotCloud’12, USENIX Association, Berkeley, CA, USA, 2012, pp. 10–10.
URLhttp://dl.acm.org/citation.cfm?id=2342763.2342773
[2] M. Ghesmoune, H. Azzag, M. Lebbah, G-stream: Growing neural gas over data stream, in: Neural Information Processing - 21st International Conference, ICONIP 2014, Kuching, Malaysia,
Novem-ber 3-6, 2014. Proceedings, Part I, 2014, pp. 207–214.doi:10.1007/978-3-319-12637-1_26. URLhttp://dx.doi.org/10.1007/978-3-319-12637-1_26
[3] C. C. Aggarwal, T. J. Watson, R. Ctr, J. Han, J. Wang, P. S. Yu, A framework for clustering evolving data streams, in: In VLDB, 2003, pp. 81–92.
[4] F. Cao, M. Ester, W. Qian, A. Zhou, Density-based clustering over an evolving data stream with noise, in: SDM, 2006, pp. 328–339.
[5] P. Kranen, I. Assent, C. Baldauf, T. Seidl, The ClusTree: indexing micro-clusters for anytime stream mining, Knowledge and information systems 29 (2) (2011) 249–272.
[6] N. Ailon, R. Jaiswal, C. Monteleoni, Streaming k-means approximation, in: Advances in Neural Information Processing Systems 22: 23rd Annual Conference on Neural Information Processing Systems 2009. Proceedings of a meeting held 7-10 December 2009, Vancouver, British Columbia, Canada., 2009, pp. 10–18.
URLhttp://papers.nips.cc/paper/3812-streaming-k-means-approximation
[7] V. Braverman, A. Meyerson, R. Ostrovsky, A. Roytman, M. Shindler, B. Tagiku, Streaming k-means on well-clusterable data, in: Proceedings of the Twenty-Second Annual ACM-SIAM Symposium on Discrete Algorithms, SODA 2011, San Francisco, California, USA, January 23-25, 2011, 2011, pp. 26–40. doi:10.1137/1.9781611973082.3.
URLhttp://dx.doi.org/10.1137/1.9781611973082.3
[8] M. Shindler, A. Wong, A. Meyerson, Fast and accurate k-means for large datasets, in: Advances in Neural Information Processing Systems 24: 25th Annual Conference on Neural Information Processing Systems 2011. Proceedings of a meeting held 12-14 December 2011, Granada, Spain., 2011, pp. 2375–2383.
URLhttp://papers.nips.cc/paper/4362-fast-and-accurate-k-means-for-large-datasets [9] T. Kohonen, M. R. Schroeder, T. S. Huang (Eds.), Self-Organizing Maps, 3rd Edition,
Springer-Verlag New York, Inc., Secaucus, NJ, USA, 2001.
[10] T. Martinetz, K. Schulten, A ”Neural-Gas” Network Learns Topologies, Artificial Neural Networks I (1991) 397–402.
[11] J. de Andrade Silva, E. R. Faria, R. C. Barros, E. R. Hruschka, A. C. P. L. F. de Carvalho, J. Gama, Data stream clustering: A survey, ACM Comput. Surv. 46 (1) (2013) 13.
[12] X. H. Zhu, Stream data mining repository (web site) (2010). URLhttp://www.cse.fau.edu/~xqzhu/stream.html
[13] K. Bache, M. Lichman, UCI machine learning repository (2013). URLhttp://archive.ics.uci.edu/ml
[14] A. Strehl, J. Ghosh, Cluster ensembles — a knowledge reuse framework for combining multiple partitions, Journal of Machine Learning Research 3 (2002) 583–617.
[15] M. Bolanos, J. Forrest, M. Hahsler, stream: Infrastructure for Data Stream Mining, r package version 0.2-0 (2014).