MPRA
Munich Personal RePEc Archive
Indian IT industry: a performance
analysis and a model for possible
adoption
Mathur, Somesh Kumar
RIS
01. January 2007
Online at
http://mpra.ub.uni-muenchen.de/2368/
INDIAN IT INDUSTRY: A PERFORMANCE ANALYSIS AND A MODEL
FOR POSSIBLE ADOPTION
SOMESH K MATHUR1
Synopsis
India's software and services exports have been rising rapidly. The annual growth rate ranges between 20 -22% in IT services and nearly 55 % in IT-enabled services (ITES), such as call centres, Business Process Outsourcing ( BPO) and other administrative support operations. Together they are predicted to grow at 25% pa till 2010.The IT industry is highly export oriented and the exporters are predominantly Indian. The Indian BPOs (ITES) are moving up the value chain, handling high end data for airline information, insurance, banking sector and mortgage companies, enterprise resource planning, among others. Some of the companies have already moved into significantly higher value added segments such as mission- critical applications, development and support, product design, HR Management, knowledge process outsourcing for pharmaceutical companies and large complex projects.
Software exports make up 20 % of India's total export revenue in 2003-04, up from 4.9 % in 1997.This figure is expected to go up to 44% of annual exports by 2010. Though India accounts for just about 3 % of the world market for information technology services, this sector has been growing at a scorching pace, helped by a large pool of English-speaking workers, nearly 4 million engineers and the increasing tribe of tech-savvy entrepreneurs in the country.
The Information Technology industry currently accounts for almost 4.8 % of India's GDP. It will account for 7 % of India's GDP by 2010.
Software and IT enabled services have emerged as a niche sector for India. This was one of the fastest growing sectors in the last decade with a compound annual growth rate exceeding 50 per cent. Software service exports increased from US $ 0.50 million in 1990 to $5.9 billion in 2000-01 to 23.6 billion dollars in 2005-06 recording a 34% growth. A compound annual growth of over 25% per annum is expected over the next 5 years even on the expanding base. The impact on the economy of projected software and IT enabled service exports of $ 60 billion by 2010 is likely to be profound. One manifestation is that India notched up a current account surplus in 2001-02, for the first time in 24 years. India further needs an open environment under GATS to promote exports of services through outsourcing and off-shoring2.
1
Fellow, RIS (www.ris.org.in) and Senior Lecturer in Economics,JMI. Email: [email protected],[email protected]. All Caveats Apply. Most of the IT figures come from NASSCOM(www.nasscom.in) and IDC. The study builds on the paper presented at the Joint Conference of KEBA, RCIE, and KIET entitled “Globalization and Regional Economic Development” held on December 15-16, 2006, Gyeong Ju, Korea http://faculty.washington.edu/karyiu/confer/GJ06/papers.htm
2
Cross border IT enabled services are services provided from one country to another over telecommunication or data networks; and are either externally contracted (outsourced) or provided by a remote subsidiary of the same company( off-shored /out-located). Offshore outsourcing jobs can be performed at a fraction of the cost in low wage countries such as India and China. Though issues such as wage inflation and rising competition from other low-cost contenders has narrowed their overall lead. Due to a revolution in digital technology and reduction in telecommunication costs, jobs related to functions such as software programming and design, call center operations, accounting and payroll operations, medical record transcription, paralegal services, and software research and testing etc., can be performed at a foreign location and transferred through the internet. Also, rise of protectionism in the West as a reaction to growing outsourcing poses a major threat to trade in services emanating from the Developing Countries like India and China. This calls for determined and innovative GATS negotiating strategies(the theme of the present work though is different)
The present study examines the growth performance of India’s IT industries, with particular attention paid to the role of policy in this process. The study recognizes that emergence of a strong Indian IT industry happened due to concerted efforts on the part of the Government, particularly since 1980s, and host of other factors like Government-Diaspora relationships, private initiatives, emergence of software technology parks, clustering and public private partnerships. In this study we further look at the major parameters of the Indian IT and ICT industry in global context and give justification for including the main factors responsible for the IT boom in India. The study has looked into the past and present trends of the Indian IT industry and has considered further needs of IT sector to act as a catalyst of growth and development. The study has examined whether the Indian IT growth does have enough lessons for other countries to model their IT policy which may help them to shape their IT industry as driver of growth and development. IT firms were actually required to export software in the early days of the industry. This arose in the context of a shortage of foreign exchange in India in the 1970s and early 1980s.Software firms that needed imported inputs were required to earn foreign exchange themselves through export of software. This enabled them to get an idea of global markets very early. Besides formulating the national vision to promote software industry in India in the early 1980s by the government, there were deliberate attempt by the companies to promote software production like compilers, device drivers and operating system to cater to the domestic hardware sector. The high tariffs for the hardware sector had meant that the production of domestic hardware segment (including PCs which were introduced in the same period) had to be sustained requiring necessary software’s like operating system and drivers. Subsequently by mid 1980s, software started coming up unbundled with the hardware. This further gave fillip to the software industry and exports. The 1990s and early 2000 saw the rise of Software Technology Parks and formation of the Ministry of Information Technology, respectively. Despite liberalization of the 1991, the software industry flourished signifying the inherent strength that it developed due to benign and enabling environment provided over a period of time and also the fact that the 1990s saw the dramatic decline in telecommunication costs (government explicit intervention) and the commercialization of the internet along with the Y2K “problem”.
The Data Envelopment Analysis (DEA) model is used to work out technical efficiency of Information and Communication Technology ( ICT) Industry in host of countries which are front runners as far as ICT is concerned. India lags behind the most as far as ICT (not IT) is concerned. However, information and Communication technology industry has brought revolution in India because it has reduced intermediation in business and society, provided solutions across sectors and is increasingly becoming an important tool for national development. DEA is also applied to benchmark the performance of the 92 Indian Software Companies for 2005- 2006. The impact of various determinants on technical efficiency of the Indian Software companies is worked out using tobit regression. The impact of the explanatory factors on net exports of 92 software firms in 2005-06 is also worked out using simple regression exercise. The study also works out technical efficiency of 36 telecommunication firms in India and examines the determinants for new technology adoption by such industries. The study uses a Malmquist index to estimate total factor productivity changes decomposed into efficiency change( catching up to the frontier technology) and technical change( movement of the frontier) for the common software firms existing between 1996 and 2006
E-government is the application of Information and Communication Technologies (ICT) by government agencies. Its use promises to enhance the effectiveness and efficiency of government
and alter its relationship with the public. The study outlines E-Governance models for effective governance and for higher agricultural growth and development.
E-Commerce primarily refers to buying, selling, marketing and servicing of products or services over internet and other computer networks. E-Commerce in India is just taking off with the advent of Railway and Online Air bookings and Net banking. The business is likely to grow to Rs 2300 crore by 2007 .Electronic commerce allows efficient interactions among customer, suppliers and development partners cutting down on transaction time and reducing the costs of doing business. The role of government is to facilitate the development of E-Commerce.
For promoting South-South Cooperation and making it meaningful, the governments of the member countries need to pool resources and capabilities in R&D and human resource development for harnessing the fruits of Information and Communicating technologies. The study spells out in detail a number of examples where ICT has been used by rural communities for their benefit and for policy and development goals of the government in general.
Web based software development and software product development (like device drivers) is necessary for providing complete business and consumer oriented solutions. These are also areas of interest for the Indian IT entrepreneurs to work upon in times to come.
India’s relatively unsafe e-security environment is costing the BPO/ITES industry. The new IT Act (2000) needs to crucially define cyber harassment, phishing and cyber stalking to take care of cyber crimes in India. With the Indian IT/BPO exports to reach $60 billion by 2010, such companies need to invest in upgrading security measures3 for sustaining competitiveness. Organizations are not obliged under the IT Act to implement data security measures to protect consumers and clients. All this makes it obvious that qualitative progress cannot be made without enacting comprehensive data protection legislation.
The Information and communication technologies (ICT) indicators of India are 13 million PCs, 40 million internet users- country with the fifth-largest number of Internet users,143 million mobile phones and 60 million subscribers for fixed lines in 2006. These are modest figures in comparison with the ICT penetration indicators achieved by the front runners like Taiwan, South Korea, Japan, UK, US, Nordic countries in Europe, among others (see the text for our strength and weaknesses in the ICT infrastructure in comparison with some other front runner countries). India’s Strengths lies in its availability of pool of scientists and engineers and quality of maths and science education along with quality of business schools. We are also ranked quite high in terms of cluster development, foreign technology licensing and Government prioritization of ICT. The weaknesses are the telecommunication infrastructure and speed of new business registration. However, Information and communication technologies(ICT) has brought about revolution in India particularly since 1990s .This is because it has reduced intermediation in business and society, reduced mobile and fixed telephony rates(because of concerted policy interventions by the government), provided solutions across sectors, provided both CDMA and GSM mobile technologies4 (and now Wi-Max technologies for internet access at different public places using PC), re-organizing firm level behavior, empowering individuals by providing them with more information and is increasingly
3Please see Hindustan Times (national daily) dated September 18, 2006 on how convergence of satellite communication, wired/ wireless telephony, microwaves has created new vulnerabilities.
4
The mobile industry in India is divided between the two technologies GSM and CDMA. While the earlier service providers had adopted the GSM technology, the new players have been using CDMA technology and have now a significant share of the Indian market. GSM stands for Global System for Mobile Communications and CDMA stands for Code Division Multiple Access. They represent different systems of sharing of the radio spectrum for communication. The technologies are normally evaluated on the following three parameters namely the data transmission capacity, security and radiation levels.
becoming an important tool for national and rural development through E-governance, E-Banking and E- Commerce programmes. In addition, the success of the Information Technology industryin India is intertwined with information and communication technologies as most of the Information technology enabled services use such technologies for providing their services.
The quantitative results of the paper answers the following- what orientations in inputs should be done by inefficient software and telecommunication firms and ICT Industry in general to reach the ‘ best practice frontier’( and have operational excellence), examines the relationship between technical efficiency and net exports of software firms along with the impact of host of explanatory factors like size of firms in terms of sales and total cost, among others on technical efficiency and net exports for cross section of software firms using tobit analysis, gives some reasons for relatively low ICT penetration in India and what can be done to transform India’s relatively good ICT readiness and ICT environment into higher ICT usage, answers why telecommunication firms are adopting new technologies and estimates total factor productivity changes in software firms which can be further used to model wage and price estimation of products and services offered by software firms over time. The paper confirms the improvements in productivity, efficiency change and technical change of the Indian Software industry from 1996 to 2006.
Synopsis Chapter Wise
Chapter one describes the major parameters of the Indian Information Technology (IT)
Industry in India today and in the immediate past. The chapter further analyzes the reason for the ‘boom’ in the Indian IT sector. We also outline an electronic governance Model which can become a tool for effective governance.DEA is applied to benchmark the performance of the 92 Indian Software Companies for 2005- 2006. The impact of various determinants on
technical efficiency of the Indian Software companies is worked out using tobit regression. The impact of the explanatory factors on net exports of 92 software firms in 2005-06 is also worked out using simple regression exercise. . Further this chapter uses a Malmquist index to estimate total factor productivity changes decomposed into efficiency change and technical change for the common software firms existing between 1996 and 2006.
Chapter two gives an account of the position of the Indian Information Technology (IT) Industry and the Indian Information and Communication Technology (ICT) Industry in the global context and analyzes the strengths and weaknesses of ICT Infrastructure across some countries. Technical Efficiency of the Indian ICT sector is worked out using the mathematical model of Data Envelopment Analysis. The study also works out technical efficiency of 36 telecommunication firms in India and examines the determinants for new technology adoption by such industries.
Chapter Three describes why and how the Indian IT industry can act as a catalyst of growth and development. An account of an effective electronic governance model for Agriculture Sector is also given.
Chapter Four looks at the past of IT industry since 1960s keeping policy in mind. This chapter also outlines an export success model . Such models can be emulated by other countries.
Chapter five describes the hurdles and constraints faced by the India IT industry and give an account of the policies and strategies which can be adopted to address the hurdles and
concerns of the ICT sector.
The last Chapter gives the conclusions, suggestions and policy advice for making IT as a tool for addressing some core inadequacies in the system like poverty, inequality, healthcare and education, among others.
CHAPTER ONE:
INDIAN IT INDUSTRY PERFORMANCE ANALYSIS : SOME INDICATORS OF SUCCESS AND REASONS FOR THE BOOM
The Indian IT-ITES5( Information Technology enabled services) sector continues to chart double-digit growth and is expected to exceed $36 billion in annual revenue in FY06, an increase of nearly 28 percent in this current fiscal. Out of this, software and services exports are estimated to grow by 32%, to reach $23.4 billion in FY06 (National Association of Software and Service Companies-NASSCOM estimates).Exports account for nearly two-thirds of the total revenues. Riding high on the outsourcing wave6, India is likely to witness software and services exports growth of 25-28%( clocking revenues of $36-38 billion) in fiscal year 2007.IT- ITES exports are likely to grow by 27-30% in FY 06-07, posting revenues between $29-31 billion, according to (NASSCOM estimates). The observed growth in the domestic market reflects the strength of the Indian economy, which has grown at an annual rate of nearly 7 per cent since 2002 and at more than 8 per cent over the first three quarters of the fiscal year (FY 2005-06). The domestic market in India has come of age now and beyond 2006 it is expected to show faster growth compared to the IT/ITeS exports revenue. This makes India a great market with significant domestic consumption and not just a sourcing base. IT-ITES sector contributes around 4.8 per cent of GDP in FY06 (NASSCOM Strategic Review, 2006 available on NASSCOM website). Engineering and R&D, software products hold significant
5
Information technology essentially refers to the digital processing, storage and communication of information of all kinds. IT can be defined as computing and telecommunication technologies that provide automatic means of handling information. IT includes software and hardware. The role of IT in services i.e., IT-led services includes the following : Product support Process outsourcing, Hardware & software maintenance, Training & education IT outsourcing, System integration & application development .Therefore, IT can potentially be used in every sector of the
economy(Nirvikar Singh,2003). The true impact of IT on growth and productivity continues to be a matter of debate, even in the United States, which has been the leader and largest adopter of IT. However, there is no doubt that the IT sector has been a dynamic one in many developed countries, and India has stood out as a developing country where IT, in the guise of software exports, has grown dramatically, despite the country’s relatively low level of income and development. An example of IT’s broader impact comes from the case of so-called IT-enabled services, a broad category covering many different kinds of data processing and voice interactions that use some IT infrastructure as inputs, but do not necessarily involve the production of IT outputs. IT enabled services include call centres, medical transcription, back office operations, revenue accounting, insurance claim processing ,legal database, payroll records, logistic management, content development/animation, entertainment software, graphics and design, computer animation, among others. Communication Technology is the term used to describe telecommunications equipment, through which information can be sought and accessed, for example, phones, faxes, modems and computers
6
Outsourcing is a business strategy that many corporations have used for decades. The most common processes that carriers are outsourcing are software development, system maintenance, core systems hosting and other systems hosting. In the last decade, the IT and BPO industries have seen substantial offshoring. India has been the leading offshore destination during this period, and now accounts for 65 per cent of the global industry in offshore IT and 46 per cent of the global Business Process Offshoring (BPO)industry. Traditionally, off shored functions have involved IT enterprise applications, infrastructure management, and IT support. However, recently we have increasingly seen off shoring extending to more mainstream functions such as HR back office, payroll, benefits administration, and inbound call centers. New entrants in this market include recruitment and staffing functions, tax planning, budgeting and reporting, risk management, and also the operations planning and scheduling functions. According to a report on global sourcing published by Gartner, the leading provider of research and analysis on the global IT industry, India remains the undisputed leader in terms of offshore centers, with China and Russia emerging as strong contenders. Countries such as India, Malaysia, and the Philippines are popular because they offer well-educated, English-speaking workers at a fraction of what they would cost in the US, and are therefore reaping rich dividends. Other countries benefiting from outsourcing are Mexico (where the first jobs from the US moved), Bangladesh and Sri Lanka. India holds the upper hand with a perfect time zone difference that enables a 24/7 service to US firms. The areas of greatest global sourcing expansion over the next three years are expected to be Eastern Europe and Southeast Asia. In general access to global talent, economies of scale, process engineering and enhancements, wage arbitrage, increased profit margins and improvements in quality are some of the gains that outsourcing companies have realized.
opportunity for India, growing at 37% and 43% (CAGR FY 2003-06E), respectively. Indian IT-ITES sector is on track to achieve the targeted $60 billion in exports by FY 2010. Over a period of time, India has established itself as a preferred global sourcing base in these segments and they are expected to continue to fuel growth in the future. These segments have been evolving over the years into a sophisticated model of operations. Indian IT and ITES companies have created global delivery models (onsite-near shore-offshore), entered into long term engagements with customers, expanded their portfolio of services offerings, built scale, extended service propositions beyond cost savings to quality and innovation, evolved their pricing models and have tried to find sustainable solutions to various issues such as risk management, human capital attraction and retention and cost management. A key demand driver for the Indian IT services and ITES industry has been the changing global business landscape which has exerted performance pressures on multinational enterprises. The IT industry and IT-enabled services, which are rapidly growing offer opportunities for FDI as well, India has emerged as an important venue for the services sector including financial accounting, call centers, and business process outsourcing. There is considerable potential for growth in these areas. Biotechnology and Bio informatics, which are on government's priority list for development, offer scope for FDI.
India’s strength has emerged through large client wins, cross border mergers and acquisitions, and the movement of the industry towards a stable pricing model. With low costs no longer being the deciding factor for foreign companies looking for developing software in India, research, chip design and financial analytical modeling are some of high-end services increasingly coming to India. In an industry which has been one of the flywheels of robust economic growth in India gaining a reputation for being able to handle complex contracts, the country top firms are now looking at large-sized, multi-year orders to boost revenue stability. India's large English-speaking engineering workforce and cheaper wages have helped to attract outsourcing. The top three Indian software exporters, flagship Tata Consultancy Services Ltd, Infosys Technologies Ltd. and Wipro Ltd., each boast more than a billion dollars in annual revenue.
The industry has crossed $27 billion dollar mark in 2005 and NASSCOM estimates that the Industry will cross $87 billion in 2008(out of which export earnings are expected to be between 50-60 billion US$). Software exports accounted for 20% of Indian export revenues in 2003-04.By 2008 it would account for 7% of India’s GDP and would contribute 30% of total Indian export revenues. The IT sector is likely to give employment to 9 million people in India by 2008 and also generate $87 billion in annual revenues & $225 billion in market value by 2008 (see McKinsey Report, quoted in the Department of Information Technology webpage http://www.mit.gov.in/dbid/eproduction.asp-appendix Table I). In addition to the nearly 1.3 million-strong workforce employed directly in the industry, Indian IT-ITES is estimated to have helped create an additional 3 million job opportunities through indirect and induced employment ( see Nasscom Mckinsey Report in the Appendix). Indirect employment includes expenditure on vendors including telecom, power, construction, facility management, IT, transportation, catering and other services. Induced employment is driven by consumption expenditure of employees on food, clothing, utilities, recreation, health and other services. While the software export target is set at $50 billion, the target for export of hardware has been kept at $10 billion by 2008.India's share in the overall global software market is expected to increase from the present 2 per cent to 7 per cent by the terminal year of the Tenth Plan.
It is a surprise that India has been able to achieve as much as it has in IT development (Srinivasan, 2005). Many scholars have termed this as leapfrog development. Even data on information and communication indicators tend to support the hypothesis. The number of personal computers per 1000 people in India in 2002 at 7.2 is just about the average of 6.9 for low income countries and a fourth of China’s 27.6.Internet users per 1000 people at 17 is just about the average of 16 for low income countries, but still a quarter of China’s 64.India spent 3.7% of GDP on IT compared to
China’s 5.3%(World Bank World Development Indicators on CDROM,2005).This points out to the concerted policies and vision by the government and industry to promote software exports and transfer of technology and telecommunication links in 1980s and particularly in 1990s.
Since 1984 under the rule of Prime Minister Rajiv Gandhi, India has been pursuing liberalization policies that have helped the IT industry develop. More specifically the computer policy of 1984 and 1986 policy on computer software export and software development and training7 gave a much needed fillip to the software industry. On the other hand, the People’s Republic of China provided little state support for this endeavor until the late 1990s. Now lagging behind, China is trying to catch up by replicating India’s model.
The government recognizes the significant economic opportunity that the information technology (IT) explosion represents to India and is committed to the policies, infrastructure development and education investment to maintain the growth. The Government of India is providing for more liberal policy framework for the IT sector. As stated above one of the major factors of excellent and consistent growth of Indian software industry can be attributed to continuous liberalization of policies of the Government of India. NASSCOM and the government have worked together in close co-operation over a long time for forming and implementing these policies. During 1991, NASSCOM lobbied with the Government and for the first time, secured income tax exemption from profits of software exports. Later, Government, systematically and gradually, reduced import duty on computer software from a high 114 percent to nil. Copyright laws were also amended.
The Ministry of Information Technology is meant to act as a nodal institution for the promotion of the sector, facilitating and coordinating the various initiatives of the central and state governments and the private sector. Priority is given to e-governance, development of software in Indian languages, IT for the masses, distance education, e-commerce, cyber security and HRD.
Postgraduate education and research in IT is pursued for promoting R&D in the emerging areas of Bluetooth technology8, e-commerce, and nano-technology and bioinformatics solutions. Foreign investment in the sector is encouraged by simplifying policies and strengthening and upgrading telecommunication and IT infrastructure. Establishing an interface of computers with diverse Indian languages, the endeavor will be to develop suitable software and technologies to enable the people to use computers in local languages. Attempts to take IT to the masses will be accelerated by
promoting Internet accessibility9, content creation in local languages, IT applications for various disabilities, empowerment of the masses with special thrust on women and children, rural healthcare systems, digital libraries in order to preserve the country's cultural heritage and social identity. The Indian federal and state governments are committed to developing and broadening e-governance. Fourteen state governments have specific priority policies and many have implementing IT-related projects. Enrolment in Indian technology schools is expecting to reach 600,000 by 2008. The
7The policies reflected in various government documents emphasized that : Effective software export promotion on a sustained basis can be effective in the long run only if it is planned as a part of an overall software promotion scheme covering both export and internal requirements including import substitution. Also planning for software development is integrally connected with the plan for hardware development and system engineering (Government of India,1985).The policies ,for example, called for the setting up of a separate Software Development Promotion Agency under the erstwhile Department of Electronics. The import of inputs needed for software development was also made more liberal.
8 Bluetooth connectivity — one that helps you talk handsfree with a wireless headset, or send data from one phone to the other wirelessly.Bluetooth is not a technology owned by one company, but by a conglomerate called the Bluetooth Special Interest Group (SIG), led by promoter companies comprising Microsoft, Intel, Nokia, IBM, Motorola, Toshiba, Ericsson, and Agere.Bluetooth-enabled products include printers, accessories, presentation systems, MP3 players, and mobile phones.
9
India has an estimated 40 million Internet users, making it the country with the fifth-largest number of Internet users. It is likely that there will be 100 million internet users by 2008(Internet and Mobile Association of India). Yet, today that number ( 40 million) only represents 3.6 per cent of the total population. The USA, with over 100 million Internet users, has a penetration rate of 68.7 per cent and Australia, with approximately 14 million users, has a penetration rate of 68.2 per cent.
government has set a target of 20 million broadband users by 2010. Thus, we see that India’s proactive government played and will continue to play an instrumental role in encouraging the IT industry.
A number of studies have looked into different aspects of India’s IT software export boom (Schware , 1987,1992; Sen,1995; Heeks,1986; Kumar, 2000a,b, 2001; Arora et.al, 2001,2002;Joseph,2006, Joseph and Harilal,2001;Kumar and Joseph,2005; Parthsarthi and Joseph, 2002; Joseph,2002 , Mathur ,2006, Pulapre Balakrishnan, 2006).Arora and Athreye (2002) argue that the software sector has contributed to Indian economic performance well beyond the macroeconomic indicators of GDP share, employment and foreign exchange earnings. In particular, they argue that software companies have come to represent models of good corporate governance that other enterprises can and
increasingly emulate. This creates productivity spillovers to other sectors. Among the practices the authors cite are: (i) increased investment in staff training;(ii) incentive pay linked to corporate performance;(iii) flat hierarchies and team organization, designed to encourage knowledge
sharing(iv)IT sector in promoting entrepreneurship. The international competitiveness of the Indian software industry has been developed in two stages. First, via long-term investment by the state in technical education and science and technology, with neither necessarily directed at the production of software. Subsequently, an incipient software industry with recognizably high export potential has been targeted via fiscal incentives and the provision of export-enabling infrastructure (Pulapre Balakrishnan, 2006)
INDIAN IT INDUSTRY IN THE IMMEDIATE PAST- 1990-2005 & PROJECTIONS: SOME STATISTICS AND ANALYSIS
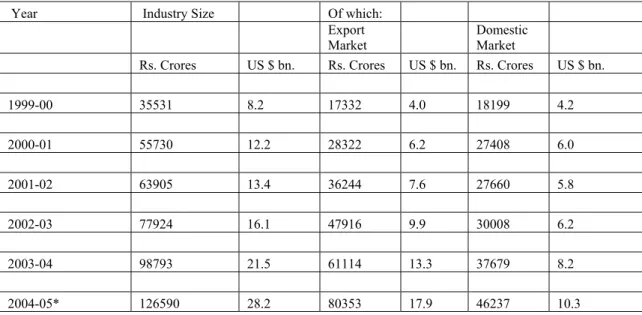
The Indian industry size (domestic IT market and IT exports) till 2004-05 was 28.2 billion US $(see table I below).Out of the this Export market constituted 17.9 billion US $ and domestic market constituted 10.3 billion US$ in 2004-05.Compound annual rate of growth for the period 2004-2005 was relatively higher for export market clocking 34.9 %, while domestic sector grew at CAGR 19.7 % in the same corresponding years. IT industry as a whole grew at the healthy rate of 250% in the period 1999-2005. Domestic market grew by nearly 22% in FY 2006. Strong demand over the past few years has placed India amongst the fastest growing IT markets in the Asia Pacific region. Growth in the domestic market is witnessing the early signs of service line depth that characterizes maturing markets. Global product companies are also looking to introduce localized versions of their software products to drive usability and penetration.
Table I: GROWTH OF INDIAN IT AND IT ENABLED SERVICES INDUSTRY: 1999-00 to 2004-05
Year Industry Size Of which:
Export Market Domestic Market Rs. Crores US $ bn. Rs. Crores US $ bn. Rs. Crores US $ bn.
1999-00 35531 8.2 17332 4.0 18199 4.2 2000-01 55730 12.2 28322 6.2 27408 6.0 2001-02 63905 13.4 36244 7.6 27660 5.8 2002-03 77924 16.1 47916 9.9 30008 6.2 2003-04 98793 21.5 61114 13.3 37679 8.2 2004-05* 126590 28.2 80353 17.9 46237 10.3
CARG (%) 28.9 28.0 35.9 34.9 20.5 19.7
Note: * Estimates
Source: Statistical Outline of India on CDROM 2006, Tata Statistical Services, Department of Economics and Statistics
The bulk of the software export activity from the early 1980s to mid 1990s comprised of body shopping or onsite delivery. The advantage of the Indian enterprises in the onsite work emanating largely from the lower salaries of Indian software professionals compared to those available in the developed nations. However, Indian companies have progressively demonstrated their technological and project management skills by successfully completing turnkey projects (Kumar 2005). Recent trends have showncoming of age of Indianmultinationals as well. Global majors are continuing to significantly ramp-up their offshore delivery capabilities -- predominantly in India10.Indian market is moving towards an era of Outsourcing Services in the domestic space. Over FY 2001-05, India’s share in global sourcing11 has grown from 62 per cent to 65 per cent for IT and 39 per cent to 46 per cent for ITES-BPO. India’s leadership is also reflected in the strong preference shown by customers for sourcing various services from the country. India remains the most preferred offshore location for sourcing a broad range of business services.
The visibly higher preference for India is driven by its unmatched superiority when measured across a range of parameters that influence the choice of a sourcing location. India ranks highest in a detailed analysis comparing 40 sourcing destinations across the world. So far, the domestic market has been dominated by plain vanilla support services like software and hardware deployment and support, which includes revenue streams like AMC (Annual Maintenance Service Contract) revenues
With the emergence of end-to-end operators in the services space and with more confidence on outsourcing service providers, end-users are awarding more contracts with long-term perspectives in mind. Deals like IBM - Bharti, HP - Bank of India, Wipro - Sanmar group, TCS - Department of Company Affairs etc. show a definite change in the mindset of even the PSU/Government vertical to go for similar deals, where the complete work of IT Infrastructure can be taken up by the specialist providers.
Discrete activities like Network & Desktop management, Applications management, ASP services etc. are also hugely popular and clients availing these managed services could go in for
comprehensive outsourcing depending on the relationship and satisfaction they have from the discrete managed services operators in existing deals. Thus, service providers would be able to provide more value in the contracts.
10
On site services are delivered on the clients’ site itself ; off-site software services are developed in India and then exported, either on physical terms (disks), or, for the bulk of them, in non physical terms (satellites, e-mails) (RBI, 2000). The bulk of export services
take place in this latter form. While physical software exports are reported as part of merchandise exports in India, non physical exports (on site and offsite services) are recorded under computer services as a part of the non-factor services in the balance of payments. Arora et al(2001) classify software services exports from India into three types according to where they are developed and how the development is managed and organized.1)Onsite consultancy,2)Offshore development and 3) The Offshore Development Centre( a hub with an umbrella contract with many Indian companies for taking advantage of the large pool of skilled labour available at a lower cost in India)
11
The past few years have witnessed steady evolution in the ecosystem for global sourcing of IT-ITES. Outsourcers have graduated to basing their decisions on a larger set of factors such as service level maturity, scalability and sustainability, infrastructure
availability and a favourable business environment – in addition to the financial benefits achievable from global sourcing. In parallel, global sourcing has been adapted to a combination of near-shore and offshore models that allow companies to maximize their gains.
So far traction in the managed services space has been mainly from the BFSI and Telecom sectors, but in the coming times more traction can come from untapped sectors like Manufacturing,
Government and niche verticals like Retail, Utilities etc. IDC estimates that Managed Services (Outsourcing Services) would be 24% of the total domestic IT Services market vis-à-vis 22% for Technology Product Services (TPS) in CY 2006.
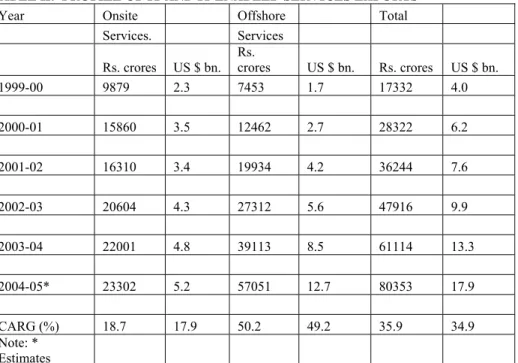
Traditionally India-centric, indigenous players have begun to build noticeable presence in other locations -- through cross border acquisitions and organic growth in other low-cost locations. Portfolio of services sourced globally continued to expand into higher-value, more complex activities. Having aligned their internal processes and practices to international standards such as ISO, CMM, Six Sigma, etc., companies in India are seeking to further increase the quality and productivity benchmarks by introducing adaptations more suitable for remote service delivery. Table II below has shown that offshore activities have grown at CAGR of 49.2 % for 2004-2005 while onsite services have increased at 17.9% in the same period.
TABLE II: PROFILE OF IT AND IT ENABLED SERVICES EXPORTS
Year Onsite Offshore Total
Services. Services
Rs. crores US $ bn. Rs. crores US $ bn. Rs. crores US $ bn.
1999-00 9879 2.3 7453 1.7 17332 4.0 2000-01 15860 3.5 12462 2.7 28322 6.2 2001-02 16310 3.4 19934 4.2 36244 7.6 2002-03 20604 4.3 27312 5.6 47916 9.9 2003-04 22001 4.8 39113 8.5 61114 13.3 2004-05* 23302 5.2 57051 12.7 80353 17.9 CARG (%) 18.7 17.9 50.2 49.2 35.9 34.9 Note: * Estimates
Source: Statistical Outline of India on CDROM 2006, Tata Statistical Services, Department of Economics and Statistics
In the coming years, many software companies in India are increasingly likely to adopt a global delivery model (NASSCOM Strategic Review, 2004 page 39). This will have four components 1) One Onshore (same country as client) location for:
Account Management
Domain expert’s consulting assistance High-Level design (alternative) Emergency bug fixes (alternative) Assessment/estimates
2) On site (client site) for: Management office Requirement definition Prototyping
User-interface design Usability testing Integration testing Acceptance testing Implementation/ cutover User training Warranty maintenance Small, dedicated staff
3) Near shore (country near to client country) for:
High level design (alternative) Quick turnaround development Emergency bug fixes
Interactive development Prime-time support Testing
Risk diversification for onshore/offshore tasks Online applications management
4) Offshore (India) for Project management Detailed design Coding Unit testing Usability testing Documentation Bug fixing Warranty maintenance Ongoing maintenance
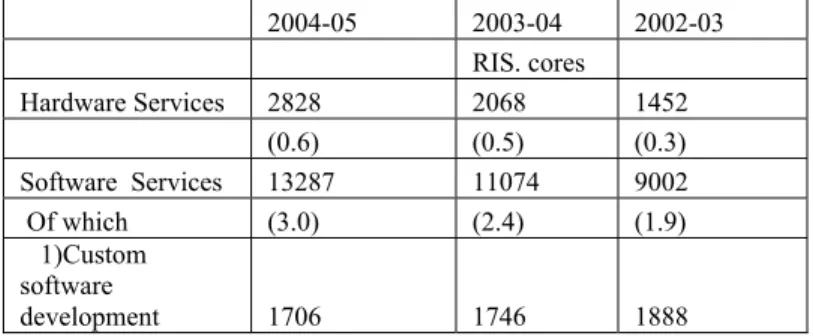
Segment wise domestic IT services from 2002-2005 below show that the revenues from software services is highest among other IT services like hardware services, software products and training ,clocking revenues of 13287 cores in 2004-05(see Table III below).Despite its smaller size relative to global standards, the software services market has shown signs of maturity including: outsourcing of facility management and IT operations, consolidation of servers, storage and networks into data centers, outsourcing of automated help desks and IT services, and the formulation of security policies and procedures. In 2004-05 we find from Table III that turnkey projects( a combination of systems integration and network integration activities) among the various software services gives the highest revenue followed by captive development, consulting and then custom software
development.In order to grow on a global scale, companies need to shift their focus from services to product development.
Table III: SEGMENTWISE DOMESTIC IT SERVICES & SOFTWARE INDUSTRY (Revenues):2002-2005
2004-05 2003-04 2002-03 RIS. cores Hardware Services 2828 2068 1452 (0.6) (0.5) (0.3) Software Services 13287 11074 9002 Of which (3.0) (2.4) (1.9) 1)Custom software development 1706 1746 1888
(0.4) (0.4) (0.4) 2) Turnkey projects 4534 3354 2565 (1.0) (0.7) (0.5) 3) Consulting 3142 1976 1162 (0.7) (0.4) (0.2) 4) Captive Development 3950 4044 3388 (0.9) (0.9) (0.7) Training 1077 1103 1210 (0.2) (0.2) (0.3) Software Products 2200 2114 1984 (0.5) (0.5) (0.4) Total 19437 16404 13600 (4.3) (3.6) (2.8) Note: Figures in brackets are in US $ ban. * Estimates
Source: Statistical Outline of India on CDROM 2006, Tata Statistical Services, Department of Economics and Statistics
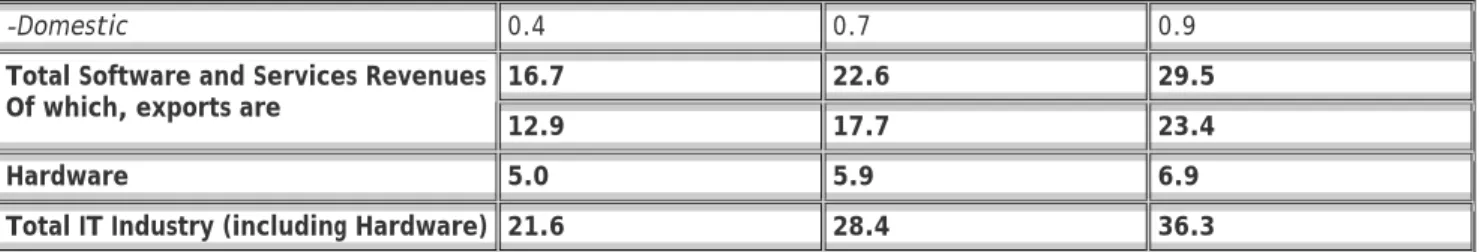
To better reflect how the industry and customer markets view the portfolio of services sourced from India, NASSCOM has re-classified the manner in which it reports the various segments included within IT-ITES. For instance, this year onwards, engineering and R&D services are being identified as an independent service line and will be reported separately. Consequently, some of the services (e.g. GIS), earlier included under ITES-BPO, will now be reported under engineering and R&D services. Further, NASSCOM has increased its overall estimate of industry exports for the previous year (FY 2004-05), based on the details reported to NASSCOM and STPI by individual companies. As a result of the re-classification and the revision of estimates, the historical values for a few segments have changed(see Table IV below).The total IT industry(including hardware) is expected to generate revenues worth 36.3 USD billion in 2006 of which total software and services revenue are expected to generate 29.5 billion USD while hardware alone is expected to generate 6.9 USD Billion in 2006.IT services among the various sector within the total software and services sector (comprising of IT services, ITES-BPO, Engineering Services and R&D, Software Products) is expected to show the highest revenue of 17.5 billion USD in 2006 up from 10.4 US Billion USD in 2004.Export of software services are expected to clock revenues worth 23.4 billion USD in 2006 of which IT services export is likely to clock revenues of 13.2 Billion US D in 2006.
Table IV: IT Industry-Sector-wise break-up (new segmentation)
USD billion FY 2004 FY 2005 FY 2006E
IT Services 10.4 13.5 17.5 -Exports 7.3 10.0 13.2 -Domestic 3.1 3.5 4.3 ITES-BPO 3.4 5.2 7.2 -Exports 3.1 4.6 6.3 -Domestic 0.3 0.6 0.9
Engineering Services and R&D,
Software Products 2.9 3.9 4.8
-Domestic 0.4 0.7 0.9
16.7 22.6 29.5
Total Software and Services Revenues Of which, exports are
12.9 17.7 23.4
Hardware 5.0 5.9 6.9
Total IT Industry (including Hardware) 21.6 28.4 36.3
Source: NASSCOM
Total may not match due to rounding off * NASSCOM estimates have been reclassified to provide greater granularity
- Historical values for a few segments have changed- For ease of comparison, details for two preceding years have been restated as per the new classification
The below given chart (see pie diagram) shows the IT segmentation according to the new classification given by NASSCOM. As earlier, IT services provides around 55 % of the total IT industry revenues in 2005 followed by ITES-BPO segment (25%), Engineering Services and Products (17%) and Hardware (3%).The right side of the chart below shows that total IT industry export revenues (excluding hardware but including IT services, ITES (BPO), Engineering Services and Software Products) have shown an increasing trend since 2004 till date. IT Services exports revenues have shown relatively higher growth rates as compared to other segments of the total IT Industry (right side of the table).
Source: NASSCOM
The below given table (V) gives an account of the trends in software and service exports from 1991-92 to 2004-05.The data shows that exports have increased from 164 million US $ in 1991 to US $ 12200 million is 200412.The export intensity of the Indian software industry is increasing and points to the competitiveness of India’s software exports13. Also, it leads us to the recognition that the rise of the software industry must be linked to the development of this competitiveness (see chapters on how internationally competitive levels of human capital available to Indian software firms have been developed over years of promotion of higher education by the Indian state and a drive to develop an autonomous scientific-industrial complex in India.).
Table V: Software and Services Export Trends (1991 to 2004)
Rs. Crores Y-o-Y % US $ Mn. Y-o-Y %
Change Change 1991 430 72.0 164 28.1 1992 675 57.0 225 37.2
12 As stated above due to change in classification there is a discrepancy in the export and other figures given by NASSCOM and other agencies like TATA Statistical Services.
1993 1020 51.1 330 46.7 1994 1535 50.5 485 47.0 1995 2520 64.2 734 51.3 1996 3900 54.8 1085 47.8 1997 6530 67.4 1759 62.1 1998 10940 67.5 2600 47.8 1999 14732 34.7 3400 30.8 2000 24210 64.3 5300 55.9 2001 29568 22.1 6200 17.0 2002 34364 16.2 7100 14.5 2003 42274 23.0 9200 29.6 2004* 54876 29.8 12200 32.6 Note: * Provisional.
Source: Statistical Outline of India on CDROM 2006, Tata Statistical Services, Department of Economics and Statistics
The growth of Indian IT and Related Business Services Exports FY 2001-6(see chart below) shows that growth of ITES exports has led to steady increase in earnings of foreign exchange.2006
estimates show that 139 billion US$ worth of foreign exchange was earned through IT-ITES exports.
Growth of Indian IT and Related Business Services Exports FY 2001-06 ($ bn)
Source: International Data Cooperation (IDC)
IT Services Exports by Verticals
Services exports in FY 2004-05 witnessed continued strength in traditional vertical market segments including BFSI, manufacturing and telecommunications.
Underlying the increasing geographic and vertical market penetration is the continuing supply-side maturity of the Indian industry. This is reflected in the ongoing scale expansion without
compromising on quality or productivity and growing deal sizes; demonstrated abilities of India-based firms to broaden their service portfolio, leverage productivity and utilization levels to sustain
competitiveness and enhance their global service delivery capabilities - while maintaining high levels of growth.
The below given chart shows that share of financial services is the highest, followed by others, manufacturing and high tech/telecom services in IT-ITES exports. IT spending in the financial market includes IT spending by banks, insurance companies, and securities firms. According to a survey conducted by IDC in 2003, IT spending by banks is driven by initiatives to meet regulatory requirements, manage customer relationships, manage risks, reduce costs and attract customers. Banks are trying to provide web based trade support, value added transaction services, basic online transaction services and basic online information services, to attract and retain customers.
Indian Services (IT-ITeS) Exports: Share of Key Vertical Markets ($ bn)
Source: NASSCOM Mckinsey Report 2005
The Indian IT-enabled Business Services (referred to as ITES-BPO) segment continues to chart strong year-on-year growth, estimated at 52 per cent for FY 2005-06(NASSCOM estimates). Growth is being driven by a steady increase in scale and depth of existing service lines, and by the addition of newer vertical-specific and emerging, niche business services (see chart below).
Indian ITES-BPO (re-classified) exports are estimated to have grown from USD 3.1 billion in FY 2003-04 to USD 4.6 billion in FY 2004-05, recording a growth of nearly 48 per cent, and are estimated to reach USD 6.3 billion by the end of the current fiscal year (FY 2005-06).
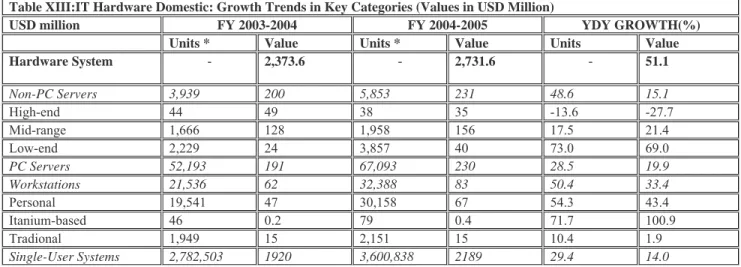
A more detailed segmentation of Indian IT Services Exports shows (see below table VI) that project oriented engagements gives relatively the highest export revenue, followed by custom application development and followed by outsourcing engagements and Application management. Custom application Development and Application Outsourcing has the highest offshore component(about 85% can be done offshore) and Indian companies can bank on existing strengths such as skilled manpower, domain and technical knowledge, to further consolidate their hold on this relatively high-margin segment.
Table VI :Indian IT Services Exports: Growth Trends in Key Service Categories ($bn)
Service Categories FY 2004 FY 2005 FY 2006E
Project-oriented engagements 4.04 5.58 7.39 Custom application development 3.71 4.98 6.6
IT consulting 0.13 0.25 0.33
Systems integration 0.15 0.2 0.26 Network consulting and integration 0.05 0.15 0.2 Outsourcing engagements 2.57 3.29 4.36
Application management 2.27 2.69 3.56
Support and training 0.64 1.1 1.45
TOTAL 7.25 9.96 13.2
*Includes network and desktop outsourcing (NDOS), hosting infrastructure services, infrastruture management services
Source: NASSCOM
Geographical Breakdown of Exports
Traditionally the major ITES exports are the Americas (68.4%) followed by Europe (23.1%).Please refer to the table VII below. Growth in other regions could have been restricted due to local
competition, language and cultural issues and outsourcing inexperience.
Table VII Indian Services (IT-ITeS) Exports* ($ mn)
Country 2002 - 03 2003 - 04 2004 - 05 Share (%) Value Share (%) Value Share (%) Value Americas 69.1 6,590 69.4 8,884 68.4 12,107 Brazil 0.01 1 0.01 1 NA NA Canada 1.1 101 1.1 143 0.9 159 Mexico 0.01 1 0.01 1 NA NA USA 67.7 6,464 68.2 8,725 66.5 11,769 Rest of America 0.2 24 0.1 13 1 178 Asia, Oceania & Middle-East 7.9 757 7.4 943 8.0 1416 Austriala 0.8 76 0.8 105 0.8 139 China 0.1 10 0.1 15 0.1 24 Hong Kong 0.2 19 0.2 26 NA NA Japan 2.8 269 3 385 2.8 500 Singapore 1.7 166 1.8 227 1.7 300 South Korea 0.2 16 0.2 23 0.0 7 Rest of Asia, Oceania and
Middle-East 2.1 201 1.3 161 2.6 460 Europe 22.2 2,123 22.6 2,894 23.1 4,093 UK 14.0 1,336 14.5 1,857 14.0 2,478 Germany 2.6 248 2.8 354 2.3 400 France 0.5 46 0.5 65 0.4 72 Italy 0.1 9 0.1 12 NA NA Finland 0.4 40 0.5 61 NA NA Sweden 0.5 51 0.6 76 0.6 100 Netherlands 1.1 101 1 129 1.4 250 Switzerland 0.7 64 0.7 91 0.7 120 Rest of Europe 2.4 228 1.9 249 3.8 673 Others 0.8 74 0.6 81 0.5 90 Grand Total 100.0 9,544 100.0 12,800 100 17,705
*Excludes hardware exports due to lack of granuality in data Totals may not add-up due to rounding-up of individual figures.
Source: Nasscom
An interesting industry trend that has been noticed in recent years is the expansion of the Indian IT industry's presence from beyond traditional destinations, to newer geographies. The industry's focus is no longer on English-speaking countries alone, and a key strategy for Indian IT majors has been to harness local talent to tap domestic markets and de-risk the revenue model by reducing their
dependence on one geographical region.
Americas and Europe remain the key markets, accounting for over 90 per cent of IT-ITES exports. However, export earnings from markets other than the US and the UK are also witnessing significant double-digit year-on-year growth.
While Indian service providers have built delivery centers in key source markets (e.g. US), they are expanding their footprints in specialist locations like China for engineering and design; South Africa for insurance, and near-shore locations like Eastern Europe and Mexico. Apart from companies in the US, organizations from Europe, South East Asia, Australia, Japan, Hong Kong, New Zealand, etc. are also reaching out for Indian software expertise, supported by the conducive policy
environment and incentives for software exports offered by India (see Table VIII). Table VIII: Geographical Breakdown of Exports
Location FY 2004 FY 2005
Americas 69.4% 68.4%
Australasia 22.6% 23.1%
Europe 7.4% 8.0%
Others 0.6% 0.5%
Strong Outlook for IT Spending in India
INDIAN IT INDUSTRY: Knowledge Professionals
Indian software and services industry’s strong value proposition – existence of a large, English speaking, technically qualified manpower, competitive billing, high productivity gains and scalability - which had helped the country emerge as a key IT services outsourcing destination, continue to hold India in good position. A key element in taking the country forward and
maintaining its growth momentum will be the provision of a highly skilled and competent global workforce.
IT manpower development today, is not only crucial for sustaining the growth of the Indian economy, it is also important for maintaining the country’s edge in the global markets, where competition is on the rise.
Growth of IT and ITeS Professionals in India
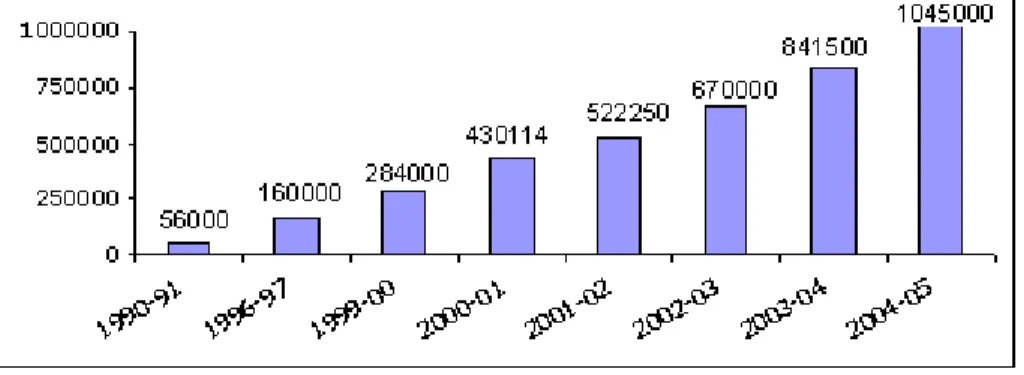
The total number of IT and ITES professionals employed in India has grown from 284,000 in 1999-2000 to over 1 million in 2004-05, growing by over 200,000 in the last year alone(see figure below).
Source: NASSCOM
Break-up of Professionals in the IT industry
Most of the new recruits in the industry are fresh graduates indicating the availability of a large pool of fresh resources each year as opposed to the siphoning off of resources from other industries. A break-up of the 1 million professionals in different sectors indicate that the number of employees in the ITES-BPO segment has witnessed the highest levels of growth over the last few years –
attributed to the tremendous growth in demand for these services(See Table IX,X and XI). ITES companies recruited approx. 100,000 professionals in 2004-05. Companies in the IT software
exports sector recruited 75,000 professionals in 2004-05, compared to 65,000 professionals recruited in 2003-04.
Table IX: Indian IT and ITES Sectors: Professionals Employed
2001-02 2002-03 2003-04 2004-05
Software Exports sector 170,000 205,000 270,000 345000
Software-domestic sector 22,000 25,000 28,000 30000
Software- in house captive staff 224,250 260,000 290,000 322000
ITES-BPO 106,000 180,000 253,500 348000
Total 522,250 670,000 841,500 1045,000
Table X: Supply pool of IT professionals
Indian IT sector: Labour Supply
(in '000s) 2003-04 2004-05 2005-06E 2006-07E
No. of Engineering Graduates 215 284 348 382
No. of IT (Computer Science, Electronics, Telecom)
professionals 141 165 181 193
No. of IT professionals entering the workforce 80 94 103 109 No. of non-IT engineers entering the workforce 40 40 40 40 No. of graduates (other disciplines) entering the IT
workforce 30 30 30 30
Total fresh IT labour supply 150 164 173 180
Source: NASSCOM
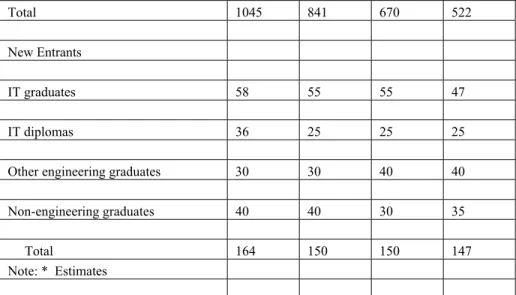
.Table XI: IT MANPOWER ESTIMATES-2001 TO 2005
2004-05* 2003-04 2002-03 2001-02
'000s
Knowledge Professionals
Employed
Software exports sector 345 270 205 170 Software domestic sales 30 28 25 22 Software - captive in user organizations 322 290 260 224 IT enabled services 348 253 180 106
Total 1045 841 670 522 New Entrants IT graduates 58 55 55 47 IT diplomas 36 25 25 25
Other engineering graduates 30 30 40 40
Non-engineering graduates 40 40 30 35 Total 164 150 150 147 Note: * Estimates
Source: Statistical Outline of India on CDROM 2006, Tata Statistical Services, Department of Economics and Statistics
With India poised to be US$ 70 billion software market in 2009, providing direct employment to more than 2.2 million (and nearly twice the number by way of indirect employment), it is essential to strengthen professional education (through curricula, faculty, infrastructure, pedagogy
improvements) in line with the IT industry’s requirements and further catalyze the interface between the academia and corporate/industry.
Given the growing demand for skilled professionals, and the rapid changes in technology, there is an increasing need to keep the academia abreast of the skill set requirement of the industry. To meet this requirement, NASSCOM signed a Memorandum of Understanding (MoU) with University Grants Commission (UGC). As part of the MoU, NASSCOM and UGC will jointly undertake a ‘Faculty Development Programme’ (FDP) for up-gradation of the skill-sets and knowledge base (in the area of emerging technologies, project management skills related to information technology) of the existing technical faculty in partnership with IT industry.
The IT-ITES industry also needs people who are not only technology experts, but also those who can manage customer interface at all levels. To address this, NASSCOM is working with the IT industry and Academia closely, and is organizing Industry-Academia workshops in various cities, wherein industry experts talk about the need to have expertise in non-technical areas like management and soft skills as well.
Employment trends
Total IT Software and services employment to reach 1,287,000 in FY06. Industry has already initiated several initiatives to further enhance the availability of and access to suitable talent for IT-ITES in India.
A NASSCOM Survey has forecast the following opportunities for IT-enabled services from India(Table XII)
1998 2008 (Projections)
IT-enabled services Employed Rs.
Crore
Can be employed
Rs. Crore
Back Office operations/ Revenue accounting/data entry conversion
9,700 420 2,60,000 19,000
Remote maintenance and support 1,600 65 1,80,000 13,500 Medical Transcription/Insurance claim processing 3,800 140 1,60,000 11,000 Call Centres 1,400 40 1,00,000 6,000 Database services 1,000 45 1,00,000 6,500 Content development 5,500 270 3,00,000 25,00 23,000 980 11,00,000 81,000
SOURCE: NASSCOM SURVEY
INDIAN IT INDUSTRY STRUCTURE
Appendix Table II presents the list of the top 19 IT Software and Service exporters and their export volumes during 2004-05 from India. Note that the top three exporters have crossed the one billion dollar mark. Also, note the feature that the top five exporters are exclusively Indian. However, at present the Indian IT services industry comprises a diverse group of companies-large, near billion dollar global companies and small start ups, Indian companies and multinationals. Growth rate across companies is quite varied
1) Tier 1 companies (i.e the top 5 firms) account for about 32 % of total software exports (NASSCOM Strategic Review 2004) and have benefited from customer’s recent scaling of operations
2) Tier 2 companies( with revenues between Rs 1 Billion and Rs 10 Billion) account for about 24 % of the industry, and face the challenge of differentiation from Tier I players. The revenues of these companies are under pressure because of fierce bidding by those in Tier 1 3) MNC Back ends account for about 26% of the industry
4) Focused companies( about 3-4 % of the industry) include those with a focus on a particular domain/service line/products, who are facing the challenge of cutbacks in key markets such as telecom, and managing to diversify their offerings
5) Small companies, with revenues of less than Rs 1 billion, account for 12-14 % of the market. The key to survival and growth is innovation and ability to spot market discontinuities. Scale of business does matter in IT services business. However, constant technological churn and the lure of entrepreneurial success has led to many small and medium companies flourishing in the IT services market.
Appendix Table VI benchmarks the performance of 92 Indian Software firms (as in 2005- 2006) in terms of technical efficiency- how judicious are firms in converting inputs into outputs. We have used Data Envelopment Analysis14 for working out technical efficiency. Data Envelopment Analysis
14DEA is a LP Problem (using simplex method): LP Primal Problem is- Maximize ratio of weighted outputs to weighted inputs subject to the condition that such ratio for each decision making unit is less than equal to one. The solution is the weights of both outputs and inputs. Weights are assumed to be greater than zero and universally applied. Such exercise is repeated for each decision making unit. We most of the time work with the dual of this primal problem ( as in this study) because apart from working out input oriented technical efficiency, it gives how much orientation in inputs and outputs is needed for each DMU to maximize the ratio of weighted outputs to weighted inputs AND THERBY REACH ITS BEST PRACTICE FRONTIER. Weights can help us to determine the orientation of inputs and outputs (answers what needs to be done) The value of the
uses linear programming to calculate technical efficiency of each decision making unit in respect to the ‘ best practice production frontier’. A score of one means most efficient among the software firms. Technical efficiency means how judicious a particular firm is in transforming inputs into outputs .We have used two outputs namely sales and net exports as outputs and number of employees, years in business and total costs as inputs. We have used data of 2005- 2006 of the Prowess data base published by CMIE.16 firms out of the total are operating at the ‘best practice frontier’ i.e. are most efficient and have scored one. These include Infosys Technologies, Tata Consultancy Limited, Patni Computers, NIIT Technology, HCL, Wipro, Hewlett Packard; among others (see Appendix Table VI). The average technical efficiency of 92 firms works out to be 0.69 as in 2005-2006.
Technical efficiency of the 92 firms was further regressed on its explanatory factors using tobit regression. Tobit regression or censored regression was used as values of technical efficiency are constrained by the upper limit of one.
Sales of the firm (proxy for size of firm) and net exports had positive and significant impact on the technical efficiency while total cost had negative and significant impact on technical efficiency. Number of employees and total number of years had insignificant impact on technical efficiency. However, R square could only explain only 20 % of the variation in the dependent variable signifying that rest 80 % variation in the dependent variable is explained by other factors which could not be included in our study. These may be affiliation to the MNC, R& D intensity, SEI-CMM certification (quality), advertising intensity, HR policy, organization climate and culture and
technology imports in terms of royalty paid, E-Regulation, among others. This will be taken up by researcher in future. The results are summarized below.
Dependent Variable: SER01(Technical Efficiency) Method: ML - Censored Normal (TOBIT)
Date: 09/21/06 Time: 05:01 Sample: 1 92
Included observations: 92 Left censoring (value) series: 0 Right censoring (value) series: 1 Convergence achieved after 6 iterations
Covariance matrix computed using second derivatives
Coefficient Std. Error z-Statistic Prob.
C 0.739256 0.066925 11.04600 0.0000
SER02(Sales) 0.000155 8.85E-05 1.746333 0.0808 SER03(Net Exports) 6.19E-05 3.44E-05 1.800198 0.0718
SER04(Number of Years in Business) -0.004087 0.004238 -0.964382 0.3349 SER05(Number of Employees) -1.99E-05 1.82E-05 -1.089722 0.2758 SER06(Total Costs) -0.000185 0.000101 -1.831703 0.0670 Error Distribution SCALE:C(7) 0.284898 0.024606 11.57830 0.0000
R-squared 0.208708 Mean dependent var 0.694239 Adjusted R-squared 0.152852 S.D. dependent var 0.269094 S.E. of regression 0.247676 Akaike info criterion 0.764012 Sum squared resid 5.214178 Schwarz criterion 0.955887 Log likelihood -28.14453 Hannan-Quinn criter. 0.841454 Avg. log likelihood -0.305919
Left censored obs 3 Right censored obs 16
Uncensored obs 73 Total obs 92
primal and dual objective function comes out to be same due to duality theorems. If technical efficiency of each decision making unit works out to be one then he is on the ‘best practice frontier’. If technical efficiency is less than one say .89 and one uses input oriented technical efficiency then the concerned DMU needs .11 units scaling back in its inputs to reach the best practice frontier. Appendix Table X gives the necessary equations to estimate the technical efficiency using input and out orientation.
Regressing net exports on its determinants yielded the following results. We used tobit regression analysis in this exercise as well. This is because we have some zero net export figures for some software firms. The firms in general have to make two set of decisions-one whether to trade and second if yes then how much.
We find that size of the Software Company (in terms of sales of the software company), number of employees and total costs (negatively) do matter for net exports. Years in business and technical efficiency are insignificant factors in explaining variation in net exports across the 92 software firms. While net exports have a significant impact on technical efficiency, technical efficiency does not seem to have an impact on net exports. Also, while number of employees statistically worked out to be insignificant factor in explaining variation in technical efficiency across the 92 software firms, the same factor is significantly impacting the net exports of the software firms. R square worked out to be 0.98 signifying that 98 % variability in net exports can be explained by the variation in the explanatory variables.
Table 2
Dependent Variable: SER03(net exports) Method: ML - Censored Normal (TOBIT) Date: 01/16/07 Time: 20:33
Sample: 1 92
Included observations: 92
Left censoring (value) series: -1454 Right censoring (value) series: 56996 Convergence achieved after 1 iterations
Covariance matrix computed using second derivatives
Coefficient Std. Error z-Statistic Prob.
C 139.0825 407.3644 0.341420 0.7328 SER01(Technical Efficiency) 276.8291 460.7969 0.600762 0.5480 SER02(Sales) 1.742858 0.208107 8.374808 0.0000 SER04(Years in Business) -3.169337 15.89504 -0.199392 0.8420 SER05(Number of Employees) 0.109599 0.032001 3.424915 0.0006 SER06(Total Cost) -1.684311 0.256464 -6.567437 0.0000 Error Distribution SCALE:C(7) 1130.700 83.35629 13.56466 0.0000 R-squared 0.984500 Mean dependent var 2482.118 Adjusted R-squared 0.983406 S.D. dependent var 8870.783 S.E. of regression 1142.717 Akaike info criterion 17.05123 Sum squared resid 1.11E+08 Schwarz criterion 17.24311 Log likelihood -777.3568 Hannan-Quinn criter. 17.12868 Avg. log likelihood -8.449531
Left censored obs 0 Right censored obs 0
Uncensored obs 92 Total obs 92
The study also uses a Malmquist index ( as outlined by Fare, et al (1997) to estimate total factor productivity(TFP) changes of common existing software firms( 32) between 1996 and 2006 along with TFP decomposition into efficiency change and technical change. Inputs (total cost and years in business) and output data (sales and net exports) for 32 software firms in two time periods -1996 and 2006 are used using CMIE Prowess data base to work out Malmquist index. The Malmquist index as specified in Appendix XI will be able to determine levels of change in productivity, efficiency change and technical efficiency changes between 1996 and 2006 for