1
Saying more with less?
Disclosure conciseness, completeness and balance in Integrated Reports
Gaia MelloniNorwich Business School – University of East Anglia Ariela Caglio*
Bocconi University – SDA Bocconi School of Management Paolo Perego
RSM Erasmus University
Version January 2017. Forthcoming in the Journal of Accounting & Public Policy Abstract
The Integrated Reporting (IR) Framework of 2013 represents the latest international attempt to connect a firm’s financial and sustainability (i.e., environmental, social and governance) performance in one company report. An IR should communicate “concisely” about how a firm’s strategy, governance, performance and prospects, in the context of its external environment, lead to the creation of sustainable value. At the same time, an IR needs to be “complete and balanced”, i.e., broadly including all material matters, both positive and negative, in a balanced way. Drawing on impression management studies, we examine a selection of performance determinants to gain insights into the factors associated with conciseness, completeness and balance in IR. The results from a sample of IR early adopters show that in the presence of a firm’s weak financial performance, the IR tends to be significantly longer and less readable (i.e., less concise), and more optimistic (i.e., less complete and balanced). We additionally find that firms with worse social performance provide reports that are foggier (i.e., less concise) and with less information on their sustainability performance (i.e., are less complete). Our evidence implies that IR early adopters employ quantity and syntactical reading ease manipulation as well as thematic content and verbal tone manipulation as impression management strategies. The results also suggest that such strategies depend not only on the level of firms’ performance but also on the type of performance (financial versus nonfinancial/sustainability). This paper adds to the limited literature on IR in sustainability accounting as well as to the research in mainstream financial accounting that examines disclosure quality using textual analysis.
Keywords: Integrated Reporting, sustainability, conciseness, completeness, balance, disclosure, textual analysis, impression management.
Acknowledgements: The authors appreciate the helpful comments of the Editors, an anonymous reviewer, and participants at the Journal of Accounting and Public Policy Conference (2016), the European Accounting Association (EAA) Annual Congress (2016), the Centre for Social and Environmental Research (CSEAR) Spain Conference (2015). We thank Lilach Trabelsi for assistance with data collection. Gaia Melloni gratefully acknowledges the financial support from the GOLDEN for Sustainability research network.
* Corresponding author:
Bocconi University, Accounting Department, Via Roentgen 1, 20136 Milano (Italy) Tel: +39 02 5836 2575; e-mail: [email protected]
2
1. Introduction
There is a wide consensus that increasing the extent of corporate information disclosed (i.e., quantity) does not necessarily imply better disclosure (i.e., quality) of a firm’s actual activities (e.g. Plumlee, Brown, Hayes, & Marshall, 2015). In particular, investors and financial analysts denounce a perceived ‘information overload’ from financial disclosures without an increase in corresponding quality and usefulness for users. Increased disclosure quantity might therefore appear as a smokescreen for low disclosure quality and possibly low firm performance. For this reason, international standard-setting bodies have initiated public debates and issued discussion papers in an effort to bring the length of financial reporting disclosures under control and to increase their quality (EFRAG, 2012; ESMA, 2015; IASB, 2013).
The debate is complicated by the extant lack of convergence in the accounting literature on how to define and empirically disentangle disclosure quantity and quality. On the one hand, in the absence of a generally agreed model for disclosure quality, as well as relevant and reliable techniques to measure it, prior studies tend to use disclosure quantity as a proxy for disclosure quality (e.g. Botosan, 1997). On the other hand, researchers suggest that investigating only the volume of disclosure could be misleading (Plumlee, et al., 2015; Toms, 2002). Provided that high quality reports should be concise and focused (i.e., not very long), making “quantity” a proxy of disclosure quality becomes questionable (Hooks & van Staden, 2011). As a result, the question of how disclosure quality is best defined and measured and its relation with disclosure quantity and/or level has yet to be answered (Beyer, Cohen, Lys, & Walther, 2010; Leuz & Wysocki, 2016).
A recent initiative intended to overcome the drawbacks in the format and usefulness of current financial reporting points at the Integrated Reporting movement (Baboukardos & Rimmel, 2016; Eccles & Krzus, 2010; Perego, Kennedy, & Whiteman, 2016; Soderstrom &
3
Potter, 2014) led by the International Integrated Reporting Council (IIRC). This emerging approach represents a relevant shift from existing reporting practices, which generally involve the production of financial statements in accordance with financial accounting standards and a separate, mostly voluntary, stand-alone sustainability report. Sustainability reports have a much broader scope than financial statements and encompass the social, human, environmental, and other dimensions of a firm’s operations. According to IR proponents, having separate reports makes the interconnections between the different dimensions of performance difficult to understand. Moreover, a specific Guiding Principle of the International Framework for Integrated Reporting released in December 2013 (labelled in this paper as ‘<IR>’; IIRC, 2013) is conciseness, which has been used by IR advocates to assert that it will ultimately assist in reducing the reporting burden for many organizations (IIRC, 2013: paragraphs 3.36-3.38). The emphasis on conciseness represents an innovative element with respect to prior attempts to enhance the disclosure quality of financial as well as nonfinancial/sustainability information. While the intention underlying the IIRC Framework is clear, there is nevertheless an “apparent tension” involved in providing a corporate report that is concise but also ‘complete and balanced’ (i.e., broadly including all material matters, both positive and negative, in a balanced way). It has to be noted that, in the IIRC Framework, balance and completeness are “grouped” together because they refer to the same overarching principle of “3F Reliability and completeness” (IIRC, 2013: paragraph 3.39). For this reason, in the following, we refer to completeness/balance1. To the best of our knowledge, we are not aware of any study that examined disclosure conciseness and completeness/balance in the novel setting of IR.
The objective of our paper is twofold. First, we assess conciseness and completeness as key features underpinning an integrated report (IR) by developing a measurement
1 To be consistent with the IIRC Framework, we use the label “completeness/balance”, although in the following analyses we operationalize them separately.
4
approach that draws on both the IIRC Framework (IIRC, 2013) and extant accounting studies applying textual analysis of narrative disclosures in financial reporting (cf. De Franco, Hope, Vyas, & Zhou, 2015; Lang & Stice-Lawrence, 2015; Li, 2008, 2010; Loughran & McDonald, 2016). We identify specific textual attributes that distinguish the concept of conciseness (measured by length and readability) from completeness and balance (captured by scope and tone, respectively) and explore the interplay among them. Second, we examine a selection of a firm’s performance-related determinants to gain insights into the factors associated with IR conciseness and completeness/balance. Our empirical analyses aim at documenting whether lower levels of conciseness and completeness/balance in IR are associated with a weaker firm’s performance. Such a relationship would confirm an impression management approach in an IR disclosure strategy, similarly to the obfuscation strategies detected in narrative disclosures examined in financial accounting (cf. Merkl-Davies & Brennan, 2007) and sustainability/environmental reporting studies (e.g. Arena, Bozzolan, & Michelon, 2015; Cho, Roberts, & Patten, 2010; Michelon, Pilonato, & Ricceri, 2015; Plumlee, et al., 2015).
We examine a sample of IR early adopters that were involved in the IIRC Pilot Programme focusing on all the integrated reports available for the years 2013 and 2014 as of 15th September 2015. Our findings show that, in the presence of a firm’s weak financial performance, the IR tends to be significantly longer, less readable (i.e., less concise) and more optimistic (i.e., less balanced), indicating the manifestation of obfuscation strategies. We also find support for the impression management argument because our results suggest that firms with worse social performance are foggier (i.e., less concise) and disclose less information on their environmental, social and governance issues (i.e., are less complete). Overall, our evidence implies that IR early adopters employ quantity and syntactical reading ease manipulation as well as thematic content and verbal tone manipulation as impression management strategies. We lend empirical support to the studies on narrative disclosures;
5
management may be induced to manipulate an IR through a combination of concealment strategies resulting in syntactically complex reports, the omission of information content and the obfuscation of bad news (Merkl-Davies & Brennan, 2007).
Our study adds to the literature in several ways. First, we contribute to the stream of accounting literature that analyses lexical characteristics of narrative disclosures (De Franco, et al., 2015; Lang & Stice-Lawrence, 2015; Li, 2008, 2010). IR as an object of textual analysis provides a unique empirical setting for various reasons. The principle-based approach taken in developing the IIRC Framework enables variation in reporting practices, with firms having the opportunity to communicate proprietary information to stakeholders without being constrained to report in standardized ways. Such a discretionary approach offers a rich context to detect wide variation in practice that is not mirrored in more regulated, standard-based financial reporting disclosures. The integrated nature of this novel form of reporting allows a deeper understanding of the interconnections among disclosure characteristics that so far have been studied in isolation. Further, the current adoption of IR takes place across institutional settings with an interesting blend of mandatory and voluntary regimes and types of communication channels, making the setting rich in terms of variation in reporting practices and underlying theoretical determinants. Second, our study sheds light on the determinants of a firm’s narrative disclosure by drawing on and bridging two bodies of literature on impression management: the stream focused on voluntary environmental/CSR reporting (e.g. Cho, Michelon, & Patten, 2012) and the stream focused on corporate annual reporting (Merkl-Davies & Brennan, 2007). In addition, our paper examines several key textual attributes because management’s disclosure strategies are unlikely to incorporate separate manipulation strategies in isolation to the exclusion of others. Third, our empirical analyses examine for the first time the textual attributes of IR to assess the adherence of IR to the principles indicated by the IIRC Framework, highlighting some potential policy
6
implications. The IIRC pays a significant amount of attention to defining conciseness and completeness/balance as part of the core Guiding Principles, yet no attempt has been made so far to analyse these key attributes and the potential inherent tensions among them. Our methodology provides a foundation of analytical tools and empirical measures that the IIRC and IR preparers can leverage to benchmark IR disclosure quality.
The remainder of this paper is structured as follows. The next section discusses the background and related literature and elaborates the hypotheses. Section 3 describes the sample examined and the research method. Section 4 presents the results of our main empirical analyses and additional tests. Finally, Section 5 provides conclusions, points at limitations of our study and suggests possible avenues for further research in this emerging area.
2. Literature review and hypotheses development
2.1. Background on Integrated Reporting and related literature
In December 2013, the International Integrated Reporting Council (IIRC) released the first International Framework for IR (IIRC, 2013). In brief, IR combines financial and nonfinancial disclosures of a company’s performance in one report. In terms of the process of IR, a salient feature is ‘integrated thinking’, defined as “the active consideration by an organization of the relationships between its various operating and financial units and the capitals that the organization uses or affects” (IIRC, 2013). An Integrated Report is thus intended to create an organization’s value creation story, by stimulating businesses to think about how they generate value in the short-, medium- and long-term horizons. The adoption of IR is further expected to tackle a number of problems presented by conventional, stand-alone sustainability reports, such as the failure to account for all sources of value creation, the complex interconnections between sustainability and financial performance, and the effective communication of a company’s business model (Eccles & Krzus, 2010).
7
Several initiatives have emerged in different regions of the world to trigger greater ‘integrated thinking’ as promoted by the IIRC Framework (Busco, Frigo, Riccaboni, & Quattrone, 2013; Frías-Aceituno, Rodríguez-Ariza, & García-Sánchez, 2013; IIRC, 2013). South Africa was the first country to mandate listed companies to produce an IR. The IIRC Pilot Programme has actively engaged a group of over 100 companies and 30 institutional investor networks to test IR in their organizations. In addition, current EU legislation, in particular the Directive 2013/34/EU on the annual financial statements, addresses the disclosure of non-financial information and raises the debate on the role of IR in supporting companies to comply with the novel European legislation. Given that IR is still in the early stages of adoption, it is not surprising that a number of conceptual and applied challenges have emerged. Similarly, the research in this area is still embryonic (see Baron, 2014; de Villiers, Rinaldi, & Unerman, 2014; Perego, et al., 2016; Soderstrom & Potter, 2014; Velte & Stawinoga, 2016 for recent reviews of the debate in this novel area). Researchers tend to focus on the expanding sample of IR early adopters to assess whether these firms show specific isomorphic organizational or country-level drivers compared to non-adopting firms. For instance, Frías-Aceituno et al. (2013) document that growth opportunities, the size of a company, board size and board gender diversity are significant drivers of IR for all three corporate governance national models (i.e., Anglo-Saxon, Germanic and Latin). In turn, companies implementing IR are more likely to originate from countries with higher investor protection and be located in civil law countries and regions where indices of law and order are high (Frías-Aceituno, et al., 2013; Jensen & Berg, 2012). Lai et al. (2014) show that firms adopting IR do not face more sever legitimacy threats compared to non-adopters.
Another strand of recent archival studies focuses on the relationship between IR adoption, IR quality and market reactions (see Perego, et al., 2016; Velte & Stawinoga, 2016 for a complete literature review). For example, Barth, Cahan, Chen & Venter (2016),
8
Bernardi & Stark (2016) and Lee & Yeo (2015) provide evidence of a positive link between IR quality and market reactions (e.g., firm value, analyst forecast accuracy and stock liquidity) for IR adopters in South Africa, where a reporting regime change occurred in 2010 (King Report). Other studies (Arguelles, Balatbat, & Green, 2015; Mervelskemper & Streit, 2015) examine worldwide voluntary samples and find a similar positive association between IR adoption or IR quality (measured or proxied differently) and variables capturing market reactions, thereby confirming IR as a beneficial signal towards investors and the financial community. Despite this initial evidence, however, the current definition and measurement of IR quality remains highly questionable. Overall, there is a lack of studies on the quality of the disclosure produced in IR with a few exceptions (Melloni, 2015; Melloni, Stacchezzini, & Lai, 2015; Stacchezzini, Melloni, & Lai, 2016). To the best of our knowledge, no attempt has been made so far to assess the extent to which IR adheres to intended Guiding Principles proposed by the IIRC Framework promulgated in 2013, except for the materiality-related contents, which has been an object of limited investigation (Fasan & Mio, 2016; Khan, Serafeim, & Yoon, 2016).
In this paper, we focus on conciseness and completeness/balance as key IIRC principles underpinning an IR. In achieving conciseness, an IR should “express concepts clearly and in as few words as possible” and “favor plain language over the use of jargon or highly technical terminology” (IIRC, 2013 p.22). In addition, an IR should be complete and balanced by including “all material matters, both positive and negative, in a balanced way” (IIRC, 2013 p.21). A firm that publishes an IR is thus expected to reach an appropriate compromise between conciseness and completeness/balance because there is an apparent tension between them (IIRC, 2013). As argued in the introduction, our objective is to identify possible factors associated with varying levels of conciseness and completeness/balance. We draw on prior accounting literature that used textual analysis (for financial reporting
9
disclosure e.g. De Franco, et al., 2015; Li, 2010) to examine four narrative disclosure characteristics, i.e., amount, readability, scope and tone, which capture conciseness and completeness/balance as core principles underlying this novel form of corporate reporting. The next section provides a literature review of the related financial accounting stream that emerged in recent years.
2.2. Literature on textual analysis of financial reporting disclosure
A growing stream of accounting literature examines narrative disclosure i.e., unstructured textual information that is presented by companies in addition to numeric data (Beattie, McInnes, & Fearnley, 2004; Li, 2010). This body of research has grown thanks to the increased electronic availability of corporate documents and to the improvement of the analytical tools that can be used to investigate textual information. Researchers, who were once limited by the need of manually coding data, can now leverage the developments of computational linguistics and statistics for data reduction, i.e., to aggregate information included in large texts into manageable indexes (Core, 2001).
In fact, the definition of disclosure indexes, which is based on the principles of content and textual analysis (Boyatzis, 1998), can be human coded or computer aided (Beattie, et al., 2004). The advantages of human coding are precision and the possibility of customizing it to the specific research needs. However, the manual approach is very costly, is less replicable due to subjectivity and, being extremely time-consuming, constrains the sample size. On the contrary, the most important advantages of using computer programmes for the analysis, besides efficiency, are related to the fact that the rules for coding text are made explicit; therefore, tools for inquiry generate formally comparable results and allow the accumulation of research findings. In addition, the computer-aided tools provide higher coder reliability for content/textual analysis using either a rule-based or dictionary approach and/or a statistical approach. The former builds disclosure indexes using mapping algorithms that
10
classify words and phrases into different categories based on pre-defined rules (i.e., dictionary), whereas the latter is based on the use of statistical techniques to conduct content analysis.
Notwithstanding these technological and methodological developments, the debate on how to assess narrative disclosure remains open, and previous contributions have emphasized the need to develop improved disclosure measures (Core, 2001; Healy & Palepu, 2001). More specifically, existing research has mainly focused on measuring the amount of disclosure (i.e., quantity) that companies provide in their annual report (Botosan, 1997; Hope, 2003b) or specific aspects for certain disclosures, such as accounting policies (Hope, 2003a) and risk disclosure (Bozzolan, Trombetta, & Beretta, 2009). Much less attention has been devoted to linguistic features, an important dimension of disclosure that is related to its quality (Li, 2008).
Prior contributions analysing lexical characteristics used disclosure indexes to study characteristics such as readability (De Franco, et al., 2015; Li, 2008, 2010), tone (Davis & Tama-Sweet, 2012), and repetitiveness (Li, 2010) to infer disclosure quality. The question of how disclosure quality is best defined and measured and its relation with disclosure level has yet to be conclusively answered (Beyer, et al., 2010). Oftentimes, disclosure quality is either equated with ̶ or seen as a function of ̶ disclosure level (Francis, Nanda, & Olsson, 2008; Lambert, Leuz, & Verrecchia, 2007; Shalev, 2009), making the findings in this stream of research mixed (Leuz & Wysocki, 2016; Li, 2008). Moreover, although managers set up a holistic disclosure policy, the existing literature tends to examine one disclosure characteristic or textual attribute at a time (Beyer, et al., 2010). In developing our hypotheses, we draw upon this stream of research and bridge it with the literature on impression management that focuses on corporate disclosure.
11
To develop the reasoning behind our hypotheses, we refer to previous contributors who pointed to the fact that narrative disclosures can be employed to “facilitate the construction of a new and different image of the company” and therefore improve its legitimacy in the wider world (Hopwood, 2009: 437). Warsame & Pedwell (1998) observe that managers prefer accounting narratives rather than financial or other quantifiable information because the former can be designed and customized to manage public impressions. This can be performed by self-servingly biasing the amount of information disclosed, the scope of topics, and the verbal tone of the disclosures (Merkl-Davies & Brennan, 2007). Thus, corporate management can use narrative disclosures as an impression management tool (cf. Brennan, Guillamon-Saorin, & Pierce, 2009). Impression management is defined as reporting bias introduced by the opportunistic behaviour of managers who select a style of presentation and choice of content that is beneficial to them. This assumes a conscious and deliberate managerial disclosure strategy (Bowen, Davis, & Matsumoto, 2005; Merkl-Davies & Brennan, 2007)
Previous studies of annual report narratives (Clatworthy & Jones, 2001; Smith & Taffler, 2000; Sydserff & Weetman, 2002; Yuthas, Rogers, & Dillard, 2002) argue that companies use certain language features to try to positively influence stakeholder perceptions, and managers strategically manipulate the opinions and decisions of stakeholders through narrative disclosures. According to Merkl-Davies & Brennan’s (2007) impression management framework, managers manipulate primarily either the presentation (language and verbal tone) or the disclosure (quantity, thematic content, and attribution) of the information presented. Impression management strategies can be based on concealment, by both employing thematic content manipulation and/or including more positive than negative keywords (corporate communications tend to use a positive tone whenever possible) as well as convoluted terms (Abrahamson & Park, 1994; Matsumoto, Pronk, & Roelofsen, 2011; Rutherford, 2003). Therefore, on the one hand, managers can skew the disclosure tone
12
more positively than what is justified (Davis & Tama-Sweet, 2012) and leverage verbal complexity to befog unpleasant information (Henry, 2008). On the other hand, by manipulating the amount of information provided on different aspects, they can direct attention to good news and turn attention away from undesirable information (Elsbach & Sutton, 1992).
The reasoning behind the impression management framework is consistent with the ‘management obfuscation hypothesis’ by Li (2008), which maintains that managers have a greater incentive to obfuscate information when firm performance is bad, whereas they are willing to be forthcoming in their disclosures when their respective companies are performing well (Lang & Lundholm, 2000; Schrand & Walther, 2000). Li (2008) develops his argument drawing upon Bloomfield’s (2002) incomplete revelation hypothesis, which, in turn, is an application of the equilibrium described by Grossman & Stiglitz (1980), who show that in efficient markets, the return to analysing data must equal the cost of analysis. The incomplete revelation hypothesis suggests that managers can decrease the market response to bad news by making bad news costlier to analyse. In other terms, the obfuscation hypothesis implies that managers of poorly performing firms may use impression management strategies to make bad news costly by writing long annual reports with unreasonably complex words and convoluted sentences.
A similar reasoning that draws on impression management can be found in the rather limited set of past studies that examine disclosure strategies in voluntary sustainability/environmental reporting (Berthelot, Cormier, & Magnan, 2003; Cho, Patten, & Roberts, 2014). This literature conceptually posits that corporate managers self-servingly use their discretion to manipulate the perceived image of their firm. Managers are thus expected to deliberately obfuscate failures (concealment) and emphasize success (image enhancement) to improve their reputation and compensation or alter users’ perceptions of corporate
13
achievements in an attempt to convince stakeholders to accept the management’s view of society (Cho, Freedman, & Patten, 2012; Cho & Patten, 2007; Patten, 2002).
Several studies in the sustainability accounting literature provide evidence of the impression management hypothesis embedded in legitimacy theory (Hummel & Schlick, 2016; Nègre, Verdier, Cho, & Patten, 2017). This stream mostly draws on content analysis of sustainability/environmental disclosure. For instance, Jones (2011) shows that companies from high environmental impact industries tend to apply a selective inclusion strategy in the graphs displayed in corporate sustainability reports. In a similar vein, Cho et al. (2012) confirm both the presence of image enhancement and obfuscation in this type of graph. More recently, Plumlee, et al. (2015) draw upon Clarkson, et al. (2008) to develop a disclosure index that classifies the nature (positive/negative/neutral) and type (soft/hard) of environmental disclosure. Their findings show a significant positive association between disclosure quality and the cost of equity components for soft/positive environmental disclosure, lending implicit support that only subjective disclosure appears to affect firm value. Michelon, et al. (2015) provide evidence that stand-alone sustainability/environmental reporting is not associated with higher disclosure quality, suggesting a symbolic, rather than substantive, role of these disclosure practices. Companies that produce stand-alone sustainability/environmental reports appear to convey more information than companies without, yet this information also seems to be diluted within other irrelevant pieces of information. Contrary to an impression management prediction, the content analyses performed by Al-Tuwaijri, Christensen & Hughes (2004), Arena, et al. (2015) and Clarkson, et al. (2008) indicate that environmental disclosure is used as a signal to reveal superior performance, lending support to the incremental information or signalling theory posited in voluntary disclosure theory. Overall, the findings from this stream of literature remain far
14
from conclusive because of the variety of specifications applied to content-analyse and classify sustainability/environmental disclosure indices.
To the best of our knowledge, few studies rely on computer-aided tools to perform a textual analysis in this area. Cho, et al. (2010) document that the worst environmental performers use more ‘optimistic’ language (image enhancement) and less ‘certainty’ (obfuscation) than better performing peers. Similarly, Bakar & Ameer (2011) support the obfuscation hypothesis, demonstrating that low (high) performing firms, in terms of profitability, liquidity and growth, achieved a low (high) CSR disclosures readability score. Starting from these premises, in this paper, we examine conciseness and completeness/balance as key principles of the IIRC Framework. We propose a method that captures conciseness and completeness/balance using textual attributes of IR that combine, for the first time, length, reading ease, scope and tone.
=== Insert Figure 1 about here ===
We posit that the properties of conciseness and completeness/balance defined by the IIRC Frameworkembed two dimensions, namely an “amount” dimension and a “style” dimension (see Figure 1). The first one refers to the contents of the IR, whereas the second one refers to its form. In fact, the IR Framework (IIRC, 2013: paragraph 3.36-3.38) maintains that an IR to be concise should “express concepts […] in as few words as possible”, pointing to the length of the report, and “favor plain language over the use of jargon or highly technical terminology”, emphasizing the importance of its readability. At the same time, completeness and balance refer to the inclusion of “all material matters, both positive and negative, in a balanced way” (IIRC, 2013: paragraph 3.39). Specifically, completeness denotes “the extent of information disclosed” (IIRC, 2013: paragraph 3.47-3.48) and suggests the disclosure scope or topic coverage, whereas balance points at tone intended as a neutral representation
15
of information, not to be “manipulated to change the probability that it will be received either favourably or unfavourably” (IIRC, 2013: paragraph 3.44).
In line with the impression management hypothesis, we argue that the levels of conciseness and completeness/balance vary systematically depending on firm performance, both financial and nonfinancial/sustainability. We draw on prior research (Bakar & Ameer, 2011; Cho, et al., 2010; Clatworthy & Jones, 2001; Plumlee, et al., 2015; Smith & Taffler, 2000; Sydserff & Weetman, 2002; Wang & Hussainey, 2013; Yuthas, et al., 2002) and expect that firms with low levels of performance use contents as well as language and verbal tone to bias the message presented in their IRs. On the contrary, managers of high-performing firms have no incentive to deliberately obfuscate or mislead communication. Therefore, we posit that firms with weaker performance exhibit significantly less conciseness and less completeness/balance, i.e., the IRs of firms that are performing poorly should be longer, more difficult and complicated to read (less concise), have a more limited topic coverage (less complete) and a more optimistic tone (less balanced) compared to firms with high levels of performance. We formulate the following hypotheses and sub-hypotheses:
H1: Firms with weaker financial performance are associated with less concise, namely longer (H1a) and less readable (H1b), Integrated Reports.
H2: Firms with weaker financial performance are associated with less complete and balanced, namely with a lower information scope (H2a) and a more optimistic tone (H2b), Integrated Reports.
H3: Firms with weaker nonfinancial performance are associated with less concise, namely longer (H3a) and less readable (H3b), Integrated Reports.
H4: Firms with weaker nonfinancial performance are associated with less complete and balanced, namely with a lower information scope (H4a) and a more optimistic tone (H4b), Integrated Reports.
In addition to testing the aforementioned hypotheses, we explore the interplay between the four dimensions included in Figure 1 in terms of impression management strategies. In fact, the matrix shown in Figure 1 can be interpreted by focusing on columns instead of rows to
16
capture two dimensions of disclosure strategies: one related to quantity and thematic content manipulation (measured by length and scope of information) and the other related to syntactical reading ease and verbal tone manipulation (measured by readability and tone). In our additional analysis, we apply exploratory factor analysis to understand how the four dimensions of disclosure relate and combine with each other (in terms of conciseness and completeness/balance and/or in terms of thematic and content manipulation and syntactical read ease manipulation).
3. Research design 3.1. Sample
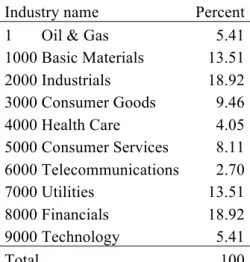
We focus on firms that are members of the official IIRC Pilot Programme (which ended in October 2014) and analyse their 2013 and 2014 reports, if publicly available on the 15th September 2015. The Pilot Programme has represented a platform for businesses to apply the principles of IR and share their practices with the IIRC. This sample identification strategy led to the analysis of 148 reports issued by 74 unique firms (one per year). The IR reports belong to firms from all continents and operating in different industry groups, as shown in Tables 1 and 2.
=== Insert Table 1 and Table 2 about here ===
Data on the disclosure variables is based on a textual analysis of firms’ IR, whereas performance data and controls are collected from Bloomberg and Thomson Reuters ASSET4. However, not all the firms have data available in the above-mentioned datasets. This explains why the subsequent regression analyses rely on 104 observations.
3.2. Measures of disclosure variables Conciseness
17
Drawing on previous studies (e.g. De Franco, et al., 2015; Li, 2008) and based on the IR definition (IIRC, 2013), we argue that conciseness can be captured in the following ways.
The first one, suggested by De Franco, et al. (2015) based on Li (2008), is the length of the report. This variable can be computed as the natural logarithm of the number of pages (or the number of characters or words) of the entire document. All these measures have already been used in the literature to measure the amount of information provided in corporate reports and they can be easily calculated and interpreted (Cowen, Ferreri, & Parker, 1987; De Franco, et al., 2015; Deegan & Gordon, 1996; Li, 2008). In our paper, we use the natural logarithm of the number of pages for the main analysis, and the logarithm of both the number of characters and the number of words in our sensitivity tests.
As argued, and based on the definition of IR (IIRC, 2013), conciseness also embeds a “style” dimension, i.e., readability, which can be measured by using the Fog index. This index derives from the computational linguistics literature and has been used to measure readability in previous studies on corporate narrative disclosure (e.g. De Franco, et al., 2015; Li, 2008; Twedt & Rees, 2012). The Fog index combines the number of words per sentence and the number of syllables per word to measure reports’ readability under the assumption that more words per sentence or more syllables per word make a document harder to read. It is calculated as follows: Fog = (words_per_sentence + percent_of_complex_words) * 0.4
Words with three syllables or more are defined as complex. The index indicates the number of years of formal education a reader of average intelligence would need to read the text once and understand that piece of writing with its word-sentence workload. In particular, the relation between the Fog and reading ease is as follows: Fog >=18 (unreadable); 14–18 (difficult); 12–14 (ideal); 10–12 (acceptable); and 8–10 (childish).
In summary, we use two different measures to capture conciseness in IRs. The natural logarithm of the total number of pages is used to measure the length of the report, and the
18
Fog Index is used to measure its readability. While both these indicators capture conciseness, the first one is related to its dimension in terms of “amount” of disclosure and the second one is related to its “style” dimension.
Completeness/balance
In addition, for completeness/balance, we draw on previous studies and on the IR definition (IIRC, 2013), and we argue that completeness/balance can be captured in the following two ways.
First, because determining completeness includes the consideration of the extent of information disclosed, we assess IR completeness measuring the coverage of specific topics and, specifically, of ESG topics. In this respect, we use the “Bloomberg ESG disclosure scores” (Ioannou & Serafeim, 2015; Lai, Melloni, & Stacchezzini, 2016). Bloomberg is the most widely used data provider for financial and other corporate data, including sustainability ones, and produces ESG scores from company-sourced fillings. In contrast to other data providers, Bloomberg does not estimate any of the ESG data: all data points can be linked back to their primary source. Past research has indicated that these disclosure scores are the ones that attract the most attention by investors (Eccles, Serafeim, & Krzus, 2011; Ioannou & Serafeim, 2015). Bloomberg ESG disclosure scores measure the degree of coverage of environmental, social, and governance issues. The four scores (ESG disclosure score, environmental disclosure score, social disclosure score and governance disclosure score) range from 0-100 and capture how many of the possible ESG topics a company is reporting and are based on both quantitative and qualitative information. It is also important to note that these scores are industry specific. This characteristic makes the ESG scores particularly suitable for our purposes as the IIRC (2013) has explicitly stated that, to assess completeness of an IR, consideration should be given to “what organizations in the same industry are
19
reporting on because certain matters within an industry are likely to be material to all organizations in that industry”.
With reference to balance, we focus on the tone of information, and specifically on the level of optimism (Davis & Tama-Sweet, 2012; Rogers, Van Buskirk, & Zechman, 2011). In fact, according to the IIRC, a balanced IR does not have any bias in the presentation of information to change the probability that it will be received either favourably or unfavourably. To capture this aspect, we use the optimism index provided by DICTION (version 7.0). DICTION supports text analysis geared towards not only the form but also the meaning of words (Sydserff & Weetman, 2002). We use DICTION to determine the tone of a verbal message in line with previous accounting studies (Cho, et al., 2010; Davis & Tama-Sweet, 2012; Henry, 2008; Rogers, et al., 2011; Sydserff & Weetman, 2002; Yuthas, et al., 2002). This software is considered particularly attractive to accounting researchers investigating impression management. Previous studies conducted in various fields indicate that DICTION has strong empirical validity (Alexa & Zuell, 2000; Davis, Piger, & Sedor, 2012; Short & Palmer, 2008). The automated procedure avoids problems caused by the subjectivity typical of manual coding (Davis & Tama-Sweet, 2012; Short & Palmer, 2008) and allows comparison between studies thus favouring cumulating the results within a specific stream of research.
Among the various linguistic categories, we focus on the so-called “optimism score” that has been employed by previous contributors as a verbal tone measure (e.g. Cho, et al., 2010). DICTION defines optimism as “language endorsing some person, group, concept or event or highlighting their positive entailments” and the related score is computed using this formula:
20
Given the way in which it is calculated, this score emphasizes the optimism versus pessimism or positive versus negative nature of the communication, i.e., the higher the score, the more the text is skewed towards an optimistic tone, whereas the lower the score, the more balanced the extent of positive and negative language used in the text. Therefore, the DICTION optimism score appears to be particularly suitable for our purposes. In particular, DICTION standardizes these six variables, then adds or subtracts them, adds a constant of 50, and then provides a slight statistical correction by referencing DICTION’s normative databank (50,000 previously analysed texts). The user may apply these general norms or select from among thirty-six sub-categories, including speeches, poetry, newspaper editorials, business reports, etc. Indeed, a distinctive feature of DICTION is its use of normative values for comparative purposes allowing the application of dictionaries specifically tailored for particular types of disclosures (including corporate financial reports). In our main analysis, we consider the optimism score with “corporate financial report” as a normative profile because it carries the advantage of being designed specifically for use in a financial context, whereas in the additional test, we employ the score targeted at “all” forms of communication. We use “standardize scores” meaning that DICTION extrapolates each particular text to a 500-word norm equivalent (which is the basic unit of analysis) so that input texts of any length can be measured consistently.
In sum, for completeness/balance, we employ two different measures: one to capture the completeness “amount” dimension, i.e., the ESG disclosure score, and one to capture the “style” dimension of balance, i.e., the optimism index. This choice is consistent with prior sustainability accounting literature, which focuses on the completeness as the
21
quantity/comprehensiveness of disclosure as distinct from the tone of the disclosure (e.g. Larrinaga, Carrasco, Correa, Llena, & Moneva, 2002; Zahller, Arnold, & Roberts, 2015)2.
3.3. Model
We examine the association between conciseness or completeness/balance and corporate financial and nonfinancial performance (environmental, social and governance) using an OLS pooled regression model with panel data, referring to years 2013 and 2014, with the following general form (with firm and time subscripts suppressed):
DISCLOSURE CHARACTERISTICS = α0 + α1 FINANCIAL PERFORMANCE + α2
SOCIAL PERFORMANCE + α3 ENVIRONMENTAL PERFORMANCE + α4
GOVERNANCE PERFORMANCE + CONTROLS + εt
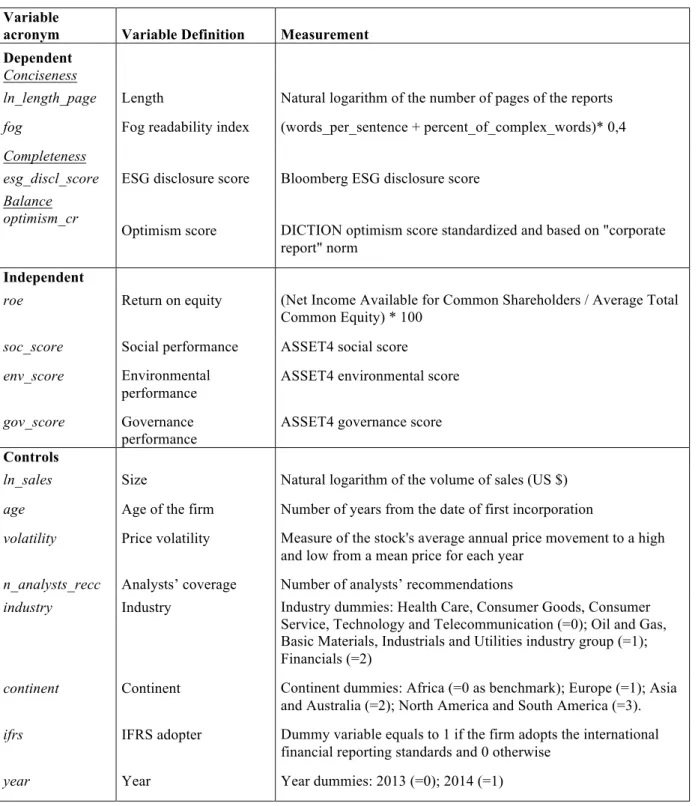
All variables used, their definitions, and measures are presented in Table 3. === Insert Table 3 about here ===
The dependent variables in the regression are the disclosure characteristics, i.e., for conciseness, the logarithm of the number of pages (ln_length_page) and Fog index (fog_index); for completeness, the Bloomberg ESG disclosure score (esg_disc); and for balance, the optimism score (opt_cr).
Our test variable, i.e., performance, is defined with reference to both financial and nonfinancial performance, reflecting a balanced view of a company’s performance in four areas: financial, environmental, social and corporate governance. Specifically, in Model 1, we employ an accounting-based performance measure, the Return on Equity (roe) to measure financial performance and the social (soc_score), environmental (env_score) and governance score (gov_score) provided by ASSET4 to measure social, environmental and governance
2 In Larrinaga et al. (2002) disclosure completeness is measured as the extent to which the company complied with every standardized item, for a minimum of zero and a maximum of seven items (completeness index). In the experiment by Zahller et al. (2015) completeness is operationalized as the inclusion of items within the Sustainability Report across a range of nonfinancial performance areas and the disclosure of both positive and negative performance within these areas (High Completeness). Low Completeness, on the other hand, reports only a few areas within the Sustainability Report and discloses only good performance.
22
performance. ASSET4 is a division of Thomson Reuters that specializes in providing objective, relevant, auditable and systematic sustainability information, which has been used extensively in prior studies on sustainability. The social score measures a company's capacity to generate trust and loyalty with its workforce, customers and society, through its use of best management practices. It is a reflection of the company's reputation and the health of its license to operate, which are key factors in determining its ability to generate long-term shareholder value. The environmental score measures a company's impact on living and non-living natural systems, including the air, land and water, as well as complete ecosystems. It reflects how well a company uses best management practices to avoid environmental risks and capitalize on environmental opportunities to generate long-term shareholder value. Finally, the corporate governance score measures a company's systems and processes, which ensures that its board members and executives act in the best interests of its long term shareholders. It reflects a company's capacity, through its use of best management practices, to direct and control its rights and responsibilities through the creation of incentives, as well as checks and balances to generate long-term shareholder value performance (Cheng, Ioannou, & Serafeim, 2014; Ioannou & Serafeim, 2012).
Previous impression management studies consider firm size and industry as control variables influencing disclosure choices. Specifically, having a large size and belonging to environmental sensitive industry groups could favour the adoption of impression management strategies (e.g. Cho, et al., 2010). Larger firms are subject to more public pressure than smaller ones and are thus more likely to manipulate the disclosure offered in their corporate reports. Similarly, firms that belong to industries in which the processes put greater stress on the natural environment have greater incentives to bias the disclosure. We distinguish three industry groups, Oil & Gas, Basic Materials, Industrials and Utilities, classified as environmental sensitive (industry=1); Financials (industry=2); and Consumer
23
Goods, Health Care, Consumer Service, Technology and Telecommunication (industry=0). Similarly, we include a variable to proxy firms’ size in the regression as the natural logarithm of the volume of sales (ln_sales).
In line with Li (2008), we also consider a control variable that refers to the age of the firm (age), defined as the number of years since the company’s incorporation: older firms face less information asymmetry and uncertainty and therefore the disclosure characteristics of their reports may differ from those of younger firms (e.g., being less foggy/more concise). For the same reasons, we also control for the volatility of the business (volatility) computed by Bloomberg and defined as the stock's average annual price movement to a high and low from a mean price for each year. For example, a stock's price volatility of 20% indicates that the stock's annual high and low price has shown a historical variation of +20% to -20% from its annual average price. We control for firms’ continent (continent), in line with previous cross-country studies on corporate disclosure (e.g. Dhaliwal, Li, Tsang, & Yang, 2014; Ernstberger & Grüning, 2013) and the emergent literature on IR ascribing differences in the IR disclosure practices to regional, institutional factors (Jensen & Berg, 2012). Within the regions, however, there is significant variation in accounting standards. Thus, it seems appropriate to control also for the accounting standard used by including a dummy variable that is equal to 1 if firms adopt International Financial Reporting Standards (ifrs) and 0 otherwise, in line with previous literature in international accounting (Lang & Stice-Lawrence, 2015). Finally, we include a proxy of analyst coverage (n_analyst_recc) drawing on previous research on disclosure (Allee & Deangelis, 2015) and a dummy variable (year) to control for the effect of time. In all models, we use clustered standard errors at firm level to
24
address autocorrelation3 and perform the Variance Inflator Factor (VIF) test to assess whether multicollinearity could affect our results.
4. Results
4.1. Descriptive statistics
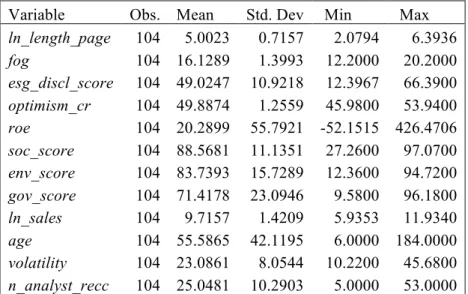
The means, standard deviations, minimum and maximum of the continuous variables are presented in Table 4. With reference to the length, the untabulated results show that the mean length of these reports is equal to 184 pages (in Table 4, we present the transformed variable). The textual analysis reveals that the mean of the Fog index is equal to 16.1289, suggesting that the reports, on average, are very difficult to read. The average ESG disclosure scores yield 49.0247 points out of 100, meaning that companies are reporting less than half of the environmental, social and governance items that Bloomberg expects them to report. The average optimism score is equal to 49.8874 which is relatively high compared to the scores obtained by other studies on environmental disclosure (e.g., Cho et al., 2010).
=== Insert Table 4 and Table 5 about here ===
Our correlation analysis shows that there are statistically significant relationships among the disclosure indexes measuring conciseness, namely length and readability. With reference to disclosure completeness/balance, no significant associations are highlighted between disclosure tone and ESG topics, as reported in Table 5. Pertaining to the association between conciseness and completeness/balance, we find that these disclosure characteristics seem to
3 In our empirical model, we control for autocorrelation drawing on Petersen (2009) using clustered standard errors at firm level. Petersen (2009) provides an extensive review and analysis of the various methods used to address correlations across time and/or firms and recommends that if a firm effect is suspected to be present, the standard errors should be clustered by firm. He claims “clustered standard errors are unbiased, produce correctly sized confidence intervals in the presence of either temporary or permanent firm effects, and are robust to heteroscedasticity.”
25
be partially in trade-off. Indeed, our analysis shows that reports that are longer/less concise tend to be more balanced as they are less optimistic4.
4.2. Multivariate analysis
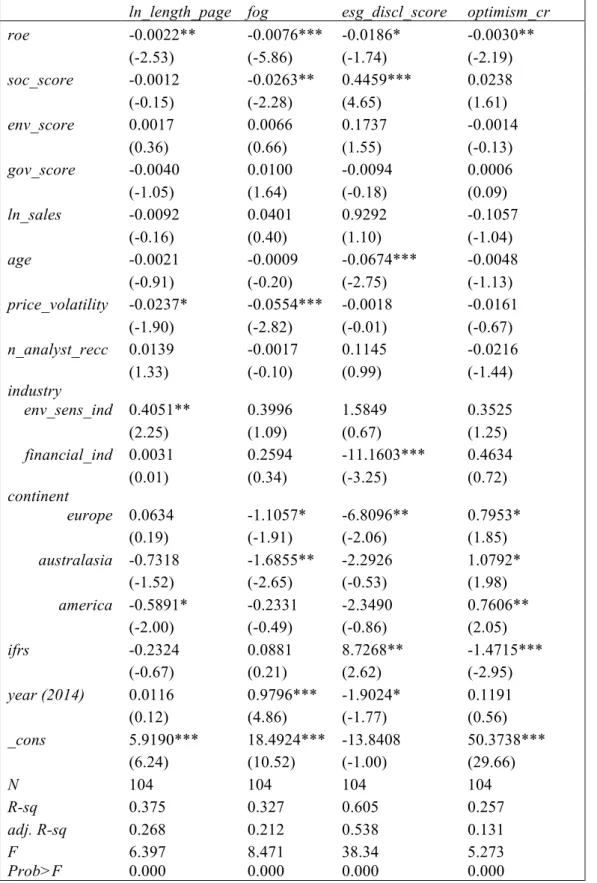
The results of the main OLS regressions are presented in Table 6 distinguishing between different types of performance (financial vs nonfinancial, i.e., social, environmental and governance). Regarding financial performance as the determinant of conciseness and completeness/balance (Model 1), the results show that firms with weaker financial performance, i.e., lower ROEs, provide reports that are significantly longer (at 5% level of significance) and foggier (at 1% level of significance) consistently with the impression management argument. Therefore, H1 is supported with reference to conciseness expressed through both the “amount” (i.e. length, H1a) and the “style” (i.e. readability, H1b) dimensions.
The results show a negative although weakly significant (at 10% level) relationship between financial performance and ESG disclosure scope. We also find a negative and significant association between financial performance and the level of optimism (at 5% level of significance) in line with impression management. Therefore, H2 is also supported with reference to balance (H2b) measured with tone (i.e., “style” dimension) but not with reference to completeness (H2a) captured with ESG topics scope (i.e., “amount” dimension). On the contrary, firms with worse financial performance provide more extensive disclosure on ESG topics.
=== Insert Table 6 about here ===
4 Largely consistent relationships (untabulated) emerge even after considering other measures of readability (e.g. Flesch grade index and Flesch reading ease), length (log of number of words, log of number of characters), tone (DICTION optimism score with “all” as normative profile) and ESG topics (specifically environmental disclosure score, social disclosure score and governance disclosure score).
26
Regarding nonfinancial performance, our evidence highlights a negative and statistically significant relationship (at 5% level) between social performance (soc_score) and fog and a positive and statistically significant relationship (at 1% level) between social performance (soc_score) and esg_discl_score. These results confirm the impression management argument, as firms with worse social achievements are foggier (i.e., produce less concise reports) and disclose less information on their ESG issues (i.e., produce less complete reports). Therefore, with reference to nonfinancial performance, H3b considering the “style” dimension (i.e., readability) and H4a considering the “amount” dimension (i.e., completeness) are supported.
Findings on control variables show that older firms provide less complete reports in terms of ESG disclosure topics (at 1% level) and that firms with higher price volatility produce reports that are significantly shorter and less foggy. The results also show that firms belonging to environmental sensitive industries tend to draft IR that are significantly longer (i.e. less concise) whilst firms belonging to the financial sector are less complete in terms of ESG topics. In addition, the findings flag significant differences in disclosure behaviours across continents. In particular, European firms draft reports that are significantly less foggy (i.e. more concise), with higher ESG disclosure scope (i.e. more complete with reference to the “amount” dimension) but more optimistic (i.e. less balanced with reference to the “style” dimension) compared to firms from other continents (i.e., Africa). Finally, we find that IFRS adopters are associated with more balanced as well as more complete reports in terms of ESG topics (at 1% significance level).
4.3. Additional tests
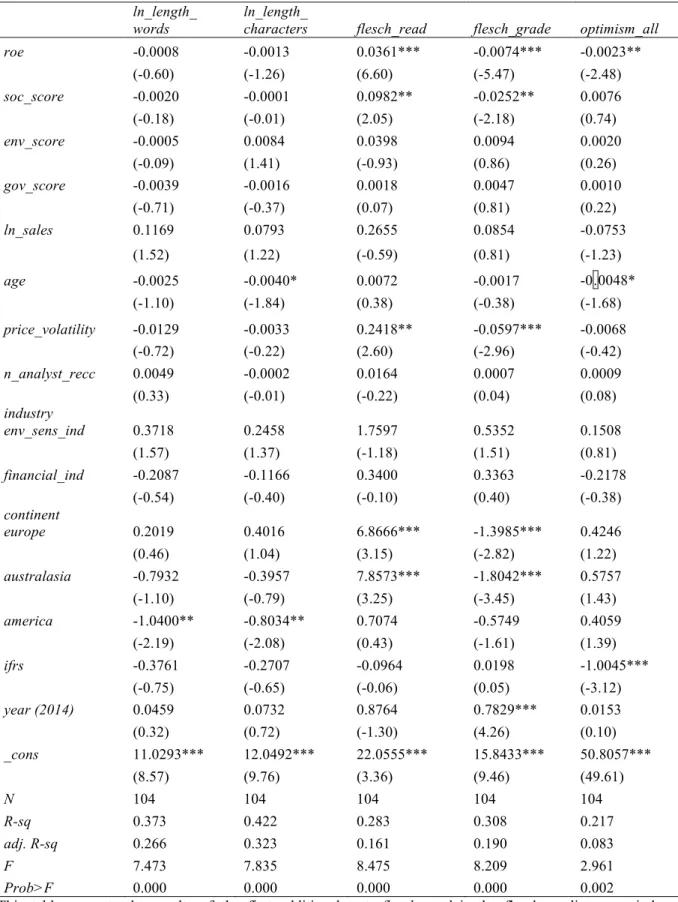
In order to assess the robustness of our results, we run some additional tests. Firstly, we perform the same multivariate analyses considering different measures of the disclosure variables (Table 7). We use the logarithm of the number of words and characters
27
(ln_length_words and ln_length_characters) and we employ two additional readability indexes: the Flesch-Kincaid Grade level and the Flesch Reading Ease5. The Flesch-Kincaid Grade level (also called the “Flesch–Kincaid formula” or the “Kincaid Index”) rates texts by US grade school levels. Therefore, a score of 8.0 means that the document could be understood by an average eighth grader. The Flesch Grade Level has been used in previous accounting studies (e.g. De Franco, et al., 2015; Laksmana, Tietz, & Yang, 2012; Subramanian, Insley, & Blackwell, 1993). The Flesch Reading Ease formula is used to assess the difficulty of a reading passage written in English and considers the number of words, sentences, and syllables in reading material for adults. The output is a number ranging from 0 to 100 and the higher the number, the easier the text is to read6. With reference to the association between these variables and both financial and nonfinancial performance, our results remain substantially unchanged. With reference to optimism, we adopt the “all norms” disclosure index (optimism_all) rather than the “corporate report norm” one. This means that we consider the normative profile tailored to “all forms of communication” to assess the robustness of our results. Our results for both the financial and the nonfinancial performance variables remain largely unchanged.
=== Insert Table 7 about here ===
Secondly, we run Model 1 by using one unique measure of nonfinancial performance, defined as the average of the three specific nonfinancial performance scores capturing environmental, social and governance performances (esg_perf_score). Again, the results
5 This index is measured as follows: Flesch-Kincaid Grade = (11.8*syllables per word) + (0.39 *words per sentence) -15.59. The Flesch Reading Ease index is calculated as follows: Flesch Reading Ease = 206.8 - (1.015*words per sentence) - (84.6*syllables per word).
6 The score is related to reading ease approximately as follows: 90–100 (5th grade); 80–90 (6th grade); 70–80 (7th grade); 60–70 (8th and 9th grade); 50–60 (10th–12th grade); 30–50 (college years); and 0–30 (college graduate). The Flesch Reading Ease is commonly employed in accounting research (e.g. De Franco, et al., 2015; Laksmana, et al., 2012).
28
(untabulated) show that the financial performance is significantly associated with all disclosure variables (with the exception of the ESG disclosure score), consistently with the main multivariate analysis. For the nonfinancial one (expressed through the esg_perf_score) a positive and statistically significant relationship is shown with esg_discl_score (at 1% level). Thirdly, we perform the same multivariate analyses (Model 1) with a different measure of performance, i.e., a market-based measure instead of the accounting-based ROE, the market to book value (m_bv). This variable captures the performance of the firm in terms of future growth/investment opportunities and/or the level of intangibles. More generally, it should be apt to capture the “invisible value” omitted from financial statements (Lev, 2001; Lev & Zarowin, 1999; Ming-Chin, Shu-Ju, & Yuhchang, 2005). The use of this indicator is in line with previous studies on corporate disclosure (Brennan, 2001; De Franco, et al., 2015; Li, 2008).The (untabulated) results obtained are consistent with those already reported with reference to current financial performance measured with ROE. In addition, we also show a positive and statistically significant relationship between env_score and esg_discl_score. This result supports the idea that firms with worse environmental performance tend to disclose less on ESG topics and is again consistent with the impression management argument (H4).
Fourthly, we run the same multivariate regression model (Model 1) substituting the missing values with the mean and the median of each variable. With reference to financial performance, the results remain largely unchanged with the exception of the optimism score that is not significantly associated with the financial performance. Also, by substituting the mean value, no significant relationship is highlighted between financial performance and disclosure length. Considering nonfinancial performance, the results support the relationship between social performance and ESG disclosure score but not with the fog index.
Finally, because the various textual attributes are not independent and to obtain a more parsimonious representation of relationships among attributes, we additionally combine
29
the four characteristics using exploratory factor (principal component) analysis (see Lang & Stice-Lawrence, 2015 for a similar approach). Results of the factor analysis are exhibited in Table 8. Both models presented (without and with factor rotation) indicate that Factor 1 and Factor 2 are appropriate for inclusion in additional tests. Eigenvalue of both factors exceed 1.0, with the Kaiser-Meyer-Olkin score at 0.496 (thus slightly under the critical threshold of 0.5) and the Bartlett's test of sphericity significant at p=0.006. In both models, the attributes measuring length and scope of IR are associated with Factor 1, while readability and tone load high on Factor 2. The interpretation of the exploratory factor analysis points thus at a combination of textual attributes per column (refer to Figure 1), with disclosure length and scope capturing quantity and thematic content manipulation (Factor 1) while readability and tone linked to syntactical reading ease and verbal tone manipulation (Factor 2).
=== Insert Table 8 and Table 9 about here ===
The regression results presented in Table 9 show a negative and statistically significant relationship between financial performance and the two factors in both models (at 1% level). This means that lower financial performance is associated with higher value of both quantity and thematic content manipulation (Factor 1) and syntactical reading ease and verbal tone manipulation (Factor 2).
5. Discussion and conclusions
Our paper adds to the debate on disclosure quality by analysing the lexical features of IRs and by aiming to understand its most important determinants, with a specific focus on performance. Our research is related to the growing body of papers applying textual analysis, primarily in the US. Outside the US, there is less empirical evidence on textual report disclosure (Lang & Stice-Lawrence, 2015), and we are not aware of research that specifically examines the novel setting of IRs. There is a variety of textual attributes that we could
30
explore to characterise IR disclosure: we focus on three that potentially affect quite significantly the quality of IRs and are thus likely to be of interest to investors and regulators in terms of policy implications. We concentrate our attention on conciseness, completeness and balance, and we examine their relationship in the setting of IR as well as their association with performance, both financial and nonfinancial/sustainability.
Regarding the relations between performance and conciseness and completeness/balance, our findings are in line with the impression management argument empirically confirmed by previous studies in financial and environmental/sustainability reporting. In particular, firms with lower financial performance tend to produce longer, more complex reports unbalanced towards optimism. Interestingly, such reports are also more complete with reference to environmental, social and governance topics, possibly signalling a disclosure manipulation strategy where the aim of the companies with weaker financial performance is to re-direct the attention from the “hard” numbers to nonfinancial “softer” aspects of their performance. This is in line with Clarkson, Li, Richardson, and Vasvari (2008), who pointed to the fact that weak performers may try to distract investors from objective measures of performance by using claims to be committed to ESG issues and soft discretionary disclosures, such as the environmental profile and initiatives. Overall, the evidence provided is consistent with the idea that firms that record weak financial achievements adopt simultaneously different impression management strategies based on quantity, thematic content manipulation, syntactical reading ease and verbal tone manipulation (Brennan, et al., 2009; Merkl-Davies & Brennan, 2007).
Regarding the association between nonfinancial/sustainability performance and conciseness and completeness/balance, our results, though partial, are in line with previous sustainability/environmental contributions, such as Al-Tuwaijri, etal. (2004) and Clarkson, et al. (2008). In fact, the evidence collected shows that firms with worse social performance are
31
less complete in terms of ESG disclosure, supporting the fact that companies with lower social results are less prone to disclose “sustainability” topics, i.e., those topics that are more in line with this type of nonfinancial performance. Moreover, firms with weaker social results provide reports that are foggier, consistent with the impression management argument. This suggests that firms with low social performance adopt impression management strategies more based on syntactical reading ease manipulation and thematic content manipulation, especially focusing on “fine-tuning” ESG topics coverage (Brennan, et al., 2009; Merkl-Davies & Brennan, 2007). Our results on nonfinancial performance (the positive relationship between social performance and ESG disclosure) could also imply that companies with better social results are more willing to disclose ESG topics. Therefore, drawing on Arena, et al. (2015), our findings lend support to the incremental information or signalling theory posited in voluntary disclosure theory (Clarkson, et al., 2008). They are also in line with the findings by Hummel & Schlick (2016), who show that superior sustainability performers choose high-quality sustainability reporting to signal their better performance to the market, whereas poor sustainability performers disclose low-quality sustainability information to conceal their true performance while trying to maintain their legitimacy.
In sum, our evidence suggests that there might be different disclosure strategies depending not only on the level of firms’ performance, as suggested by previous studies but also on the type of performance. In this respect, our findings shed light on the importance of focusing on both financial vs nonfinancial/sustainability performance when aiming at detecting impression management strategies. In addition, irrespectively of the IR Framework’s emphasis on conciseness and completeness/balance, our evidence seems to suggest that, in practice, firms struggle to provide reports that are concise, complete and balanced. In this sense, the implementation of an IR might work as a trigger for companies to embrace a dynamic process of learning that can lead to the rethinking of their reporting
32
systems and practices. Because the IR is a relatively new idea, a lead-time is probably required to achieve its full potential in terms of improving disclosure quality. IR implementation can be appreciated as a far-reaching learning process for companies (cf. Maniora, 2015).
While this research contributes to understanding some disclosure characteristics and its determinants, specifically in the novel context of IR, our analysis is subject to several caveats. Firstly, we rely on the computations made with a specific software (i.e., DICTION) to estimate disclosure tone variables. The debate on textual measures is still evolving: textual analysis is an emerging area in accounting and finance, and, as a result, the corresponding taxonomies are still somewhat imprecise. However, the imprecision of textual analysis is not something that precludes its usage, but it is a characteristic that must be confronted in producing empirical results that are expected to have credible impact and can be reasonably replicated (Loughran & McDonald, 2016). In our paper, we favoured replicability and the use of standardized measures. An avenue for future research would be developing new, customized measures of the attributes of corporate disclosures based on manual content analysis (Plumlee, et al., 2015) and/or performing our analyses with tools other than DICTION (e.g., Rogers, et al., 2011) .
Secondly, it would be interesting to consider additional firm characteristics that may influence the incentives to manipulate disclosure, such as specific corporate governance variables other than the governance score (García Osma & Guillamón-Saorín, 2011). It could also be of interest to investigate the costs and benefits associated with producing IRs with different characteristics to understand the interplay between economic and strategic motives of managers’ disclosure behaviours.
Thirdly, by focusing on firms that voluntarily commit to the IR movement, the findings of our study have potential policy implications towards the IIRC and government bodies.