ENHANCED MICRO GENETIC
ALGORITHM-BASED MODELS FOR
MULTI-OBJECTIVE OPTIMIZATION
TAN CHOO JUN
UNIVERSITI SAINS MALAYSIA
ENHANCED MICRO GENETIC
ALGORITHM-BASED MODELS FOR
MULTI-OBJECTIVE OPTIMIZATION
by
TAN CHOO JUN
Thesis submitted in fulfillment of the requirements
for the degree of
Doctor of Philosophy
ACKNOWLEDGEMENTS
First of all, I would like to express my gratitude to my supervisors, i.e. Associate Professor Cheah Yu-N and Professor Lim Chee Peng, for their insightful guidance and encouragement throughout the research. Thanks to their supervision and invaluable assistance in accomplish-ing this research work. It has been an honour to work with them.
My appreciation goes to various parties, whom have helped me in one way or another, during the course of my research. Finally. I would like to thank my beloved parents, all my colleagues and friends for their patience, encouragement, assistance, and support.
TABLE OF CONTENTS
Acknowledgements. . . ii
Table of Contents . . . iii
List of Tables . . . viii
List of Figures . . . xiii
List of Abbreviations . . . xviii
List of Symbols . . . xix
List of Symbols for Lemmas . . . xx
Abstrak . . . xxi
Abstract . . . xxiii
CHAPTER 1 – INTRODUCTION 1.1 Research Background. . . 1
1.1.1 Multi-Objective Optimization . . . 1
1.1.2 The Pareto Optimality Principle . . . 3
1.1.3 Evolutionary Algorithms . . . 4
1.1.4 Multi-Objective Evolutionary Algorithms. . . 5
1.2 Research Questions . . . 6
1.3 Research Objectives . . . 8
1.4 Research Scope . . . 9
1.5 Research Contribution . . . 9
1.6 Thesis Organization . . . 10
CHAPTER 2 – LITERATURE REVIEW 2.1 Multi-Objective Evolutionary Algorithms . . . 12
2.1.1 Generation of MOEAs . . . 16
2.1.1.1 The First Generation . . . 16
2.1.2 Categories of MOEAs . . . 19
2.2 The micro Genetic Algorithm (mGA) . . . 22
2.2.1 mGA for SOPs . . . 22
2.2.2 mGA for MOPs . . . 25
2.3 The Pareto Concept . . . 29
2.4 Performance Indicators . . . 32
2.5 Performance Quantification . . . 34
2.5.1 Computational Time Complexity Analysis using theO-Notation Analysis 36 2.5.2 Statistical Analysis Using the Bootstrap Sampling Method . . . 38
2.6 Summary . . . 40
CHAPTER 3 – A MODIFIED MICRO GENETIC ALGORITHM 3.1 The micro Genetic Algorithm . . . 41
3.2 Modified micro Genetic Algorithm . . . 44
3.2.1 An NSGA-II Inspired Elitism Method. . . 45
3.2.2 An Extended Population Formation Method . . . 47
3.2.3 The Overall Modified micro Genetic Algorithm . . . 48
3.3 TheO-Notation Analysis . . . 52
3.4 Experimental Study . . . 63
3.4.1 Comparison with mGA . . . 64
3.4.2 Comparison with NSGA-II. . . 65
3.5 Remarks . . . 68
3.6 Summary . . . 69
CHAPTER 4 – THE MMGA-BASED ENSEMBLE MODEL 4.1 An Ensemble Optimizer . . . 70
4.1.1 A Voting-based Elite Selection Scheme . . . 71
4.1.3 An Reinforcement Learning Scheme . . . 75
4.1.4 An Reinforcement Learning Scheme for the Adoption Ratio . . . 77
4.1.5 A Euclidean Distance Scheme . . . 78
4.1.6 The Overall MmGA Ensemble . . . 79
4.2 TheO-Notation Analysis . . . 81
4.3 Experimental Study on Multi-Objective Optimization Problems . . . 90
4.3.1 Re-visiting the Kursawe Benchmark Function . . . 90
4.4 Experimental Study on Mulit-Objective Classification Problems . . . 93
4.4.1 Objective Functions . . . 97
4.4.2 Parameter Settings . . . 101
4.4.3 The WBC Data Set . . . 102
4.4.4 The SHD Data Set . . . 104
4.4.5 Comparison with the Rotation Forests Model . . . 106
4.5 Remarks . . . 108
4.6 Summary . . . 109
CHAPTER 5 – THE AGENT-BASED MMGA MODEL 5.1 The Multi-Agent System . . . 110
5.2 The Mediated Decision Rule (MDR) . . . 113
5.2.1 The modified Mediated Decision Rule (mMDR) . . . 114
5.3 The TNC-based MmGA Model . . . 116
5.3.1 The mMDR scheme for Elite Selection . . . 119
5.3.2 The mMDR-based AoC and RL Schemes. . . 121
5.3.3 The mMDR-based RL Scheme for the Adoption Ratio . . . 122
5.3.4 The Overall TNC-based MmGA Model . . . 123
5.4 TheO-Notation Analysis . . . 123
5.5 Experimental Study on Multi-Objective Optimization Problems . . . 131
5.5.2 Experiment with the ZDT3 function . . . 135
5.6 Experimental Study on Multi-Objective Classification Problems . . . 139
5.6.1 The WBC Data Set . . . 141
5.6.2 The SHD Data Set . . . 144
5.6.3 Classification of Text-based Product Reviews . . . 148
5.7 Remarks . . . 152
5.8 Summary . . . 154
CHAPTER 6 – REAL-WORLD CASE STUDIES 6.1 Job Shop Scheduling. . . 155
6.1.1 Problem Formulation . . . 156
6.1.2 Experimental Procedure . . . 159
6.1.3 Problem Analysis . . . 160
6.1.4 Experimental Results and Discussion . . . 162
6.1.4.1 Two-Objective Experiment . . . 163
6.1.4.2 Three-Objective Experiment . . . 165
6.1.5 Remarks . . . 167
6.2 Electronic Circuit Design . . . 168
6.2.1 Cmizer. . . 171
6.2.2 Problem Analysis . . . 174
6.2.3 Experimental Results and Discussion . . . 178
6.2.4 Remarks . . . 183
6.3 Human Motion Detection and Classification . . . 184
6.3.1 Problem Formulation . . . 187
6.3.2 Problem Analysis . . . 190
6.3.3 Experimental Results and Discussion . . . 190
6.3.4 Remarks . . . 195
6.4.1 Problem Analysis . . . 201
6.4.2 Experimental Results and Discussion . . . 201
6.4.3 Remarks . . . 203
6.5 Summary . . . 205
CHAPTER 7 – CONCLUSION AND RECOMMENDATIONS 7.1 Revisiting the Research Contributions . . . 207
7.2 Suggestions for Future Work . . . 212
REFERENCES . . . 215
APPENDICES . . . 234
APPENDIX A – THE DETAILS OF JOB SHOP SCHEDULING . . . 235
A.1 The 6-job Problem . . . 235
A.2 The 7-job Problem . . . 236
A.3 The 8-job Problem . . . 237
A.4 The 9-job Problem . . . 238
A.5 The 10-job Problem . . . 239
APPENDIX B – EXPERIMENTS . . . 240
B.1 The Summary of Experiments . . . 240
LIST OF TABLES
Page
Table 2.1 EA-based models in undertaking MOPs 15
Table 2.2 A Summary of MOEAs spanning two generations 19
Table 2.3 Categories of MOEAs 21
Table 2.4 A Summary of mGA-based models for undertaking SOPs 24 Table 2.5 A Summary of mGA-based models for undertaking MOPs 27
Table 2.6 The population sizes in mGA-based models. 27
Table 2.7 The number of objective functions in mGA-based models. 28
Table 3.1 A comparison of experimental parameters between mGA, mGA2, and
MmGA 65
Table 3.2 The mean and 95% confidence intervals (denoted as the lower and
upper bounds) ofIgd,Iigd, andIsfrom MmGA 65
Table 3.3 A comparison of experimental parameters between NSGA-II and
MmGA 66
Table 3.4 The mean and 95% confidence intervals (denoted as the lower and
upper bounds) ofIgd,Iigd, andIsfrom MmGA 67
Table 4.1 A comparison of experimental parameters between mGA, mGA2,
MmGA, and MmGA ensemble 91
Table 4.2 A comparison of experimental parameters between NSGA-II,
MmGA, and MmGA ensemble 92
Table 4.3 The bootstrappedIgd,Iigd, andIsresults from MmGA and MmGA
ensemble for the Kursawe benchmark function after 12000 generations 92 Table 4.4 The bootstrappedIgd,Iigd, andIsresults from MmGA and MmGA
ensemble for Kursawe benchmark function after 500 generations 92 Table 4.5 The experimental parameters for WBC and SHD data sets 102 Table 4.6 The bootstrapped results of MmGA ensemble using the WBC data set 104 Table 4.7 The bootstrapped results of MmGA ensemble using the SHD data set 106 Table 4.8 Performance comparison between the MmGA ensemble coupled with
J48 and other models based on J48 as reported in (Rodriguez et al.,
Table 4.9 A comparison of reduction percentages between the MmGA
ensemble coupled with J48 and Rotation Forest-based J48 108
Table 5.1 An MDR illustration (Pelta and Yager, 2010) 114 Table 5.2 An example of mMDR with the Option Weight (ow) and Agent
Strength (ASj) 115
Table 5.3 A comparison of experimental parameters between mGA, mGA2,
MmGA, MmGA ensemble, and TNC-based MmGA 132
Table 5.4 A comparison of experimental parameters between NSGA-II,
MmGA, MmGA ensemble, and TNC-based MmGA 133
Table 5.5 The experimental parameters of the TNC-based MmGA model 133 Table 5.6 Results of the Kursawe benchmark function using multiple MOP
indicators 133
Table 5.7 Results of the ZDT3 benchmark function usingIigd 137
Table 5.8 Results of the ZDT3 benchmark function using multiple MOP
indicators 138
Table 5.9 The experimental parameters for the WBC and SHD data sets 140 Table 5.10 The bootstrapped experiment results from TNC-based MmGA for the
WBC data set 141
Table 5.11 A comparison of improvement (in terms of percentage) between the MmGA-based models coupled with standard classifiers and standard
classifiers using the WBC data set 144
Table 5.12 Performance comparison between TNC-based MmGA and MmGA ensemble coupled with J48 and the PCA-based J48 model using the
WBC data set 144
Table 5.13 A comparison of reduction (in terms of percentage) between MmGA-based models coupled with J48 and the Rotation
Forest-based J48 using the WBC data set 145
Table 5.14 The bootstrapped experiment results from TNC-based MmGA for
SHD data set 145
Table 5.15 A comparison of improvement (in terms of percentage) between the MmGA-based models coupled with standard classifiers and standard
classifiers using the SHD data set 145
Table 5.16 Performance comparison between TNC-based MmGA and MmGA ensemble coupled with J48 and the PCA-based J48 models using the
Table 5.17 A comparison of reduction (in terms of percentage) between MmGA-based models coupled with J48 and the Rotation
Forest-based J48 using the SHD data set 147
Table 5.18 The experimental parameters for the product review data set 150 Table 5.19 Performance comparison between TNC-based MmGA model coupled
with SVM and the SVM using the product review data set 151 Table 5.20 A comparison of reduction (in terms of percentage) between
TNC-based MmGA model coupled with SVM, standard SVM, and
the reported result for the product review data set 151
Table 6.1 Requirements of the 5-job problem 157
Table 6.2 A numerical example of a 5-job problem 158
Table 6.3 Cost-saving matrix of the 5-job problem 159
Table 6.4 Non-dominated solutions covering cost-saving and tardiness from the
enumeration method for the 5-job problem 159
Table 6.5 Possible pair variations ofnjobs 162
Table 6.6 The experimental parameters for job shop scheduling 162 Table 6.7 A comparison of total cost-saving and tardiness for the enumeration
method, MmGA ensemble, and TNC-based MmGA for job shop
scheduling 166
Table 6.8 A comparison of job pair pattern between MmGA-based models for
the job shop scheduling 167
Table 6.9 Requirements of the objective functions for the circuit design problem 175 Table 6.10 Constraint ranges of variables for the circuit design problem 176 Table 6.11 The experimental parameters for the circuit design problem 178 Table 6.12 The comparison of results for the circuit design problem 179 Table 6.13 A comparison of number of generations for the circuit design problem 181 Table 6.14 The number of optimum solutions generated by TNC-based MmGA
for the circuit design problem 183
Table 6.15 Number of samples collected for the human motion data set 189 Table 6.16 The experimental parameters for the human motion data set 190
Table 6.17 A comparison between accuracy, specificity, and sensitivity from standard classifiers and bootstrapped results from MmGA-based models coupled with standard classifiers for human motion data set
-Part J48 and Logistic 192
Table 6.18 A comparison between accuracy, specificity, and sensitivity from standard classifiers and bootstrapped results from MmGA-based models coupled with standard classifiers for human motion data set
-Part RBF and SVM 193
Table 6.19 A comparison of improvement (in terms of percentage) between the MmGA-based models coupled with standard classifiers and standard
classifiers using the overall pocket data of the human motion data set. 195 Table 6.20 The experimental parameters for the MI data set. 202 Table 6.21 Performance comparison between results from standard classifiers
and bootstrapped results from the MmGA-based models for the MI
data set 202
Table 6.22 A comparison of improvement (in terms of percentage) between the MmGA-based models coupled with standard classifiers and standard
classifiers using the MI data set 203
Table A.1 Requirements of the 6-job problem 235
Table A.2 Cost-saving matrix of the 6-job problem 235
Table A.3 Non-dominated solutions covering cost-saving and tardiness from the
enumeration method for the 6-job problem 235
Table A.4 Requirements of the 7-job problem 236
Table A.5 Cost-saving matrix of the 7-job problem 236
Table A.6 Non-dominated solutions covering cost-saving and tardiness from the
enumeration method for the 7-job problem 236
Table A.7 Requirements of the 8-job problem 237
Table A.8 Cost-saving matrix of the 8-job problem 237
Table A.9 Non-dominated solutions covering cost-saving and tardiness from the
enumeration method for the 8-job problem 237
Table A.10 Requirements of the 9-job problem 238
Table A.11 Cost-saving matrix of the 9-job problem 238
Table A.12 Non-dominated solutions covering cost-saving and tardiness from the
enumeration method for the 9-job problem 238
Table A.14 Cost-saving matrix of the 10-job problem 239 Table A.15 Non-dominated solutions covering cost-saving and tardiness from the
enumeration method for the 10-job problem 239
LIST OF FIGURES
Page
Figure 1.1 An example of the typical cost-profit operation problem and the
Pareto front. 3
Figure 2.1 The pseudo-code of an Evolutionary Algorithm, adopted from Coello
et al. (2007) 13
Figure 2.2 Generations of Multi-Objective Evolutionary Algorithms. 16 Figure 2.3 An example of MOP mapping within the decision variable space (F)
and objective function space (O), respectively, for the case ofr=3
andn=2. 29
Figure 2.4 A classification of MOP indicators, adapted from Durillo and Nebro
(2011) 32
Figure 2.5 The bounds ofO,ΘandΩnotation, adopted from Cormen et al. (2009). 37
Figure 3.1 A flowchart of the mGA model, adopted from Coello and Pulido
(2001). 42
Figure 3.2 The pseudo-code of the micro Genetic Algorithm, adapted from
Coello and Pulido (2005) 43
Figure 3.3 A flowchart of the proposed MmGA model. The bold-italic
components indicate modifications introduced in this research. 45 Figure 3.4 An example of the crowding distance computation in a dual-objective
minimization problem. 47
Figure 3.5 A comparison between the memory structure of mGA and MmGA. 48 Figure 3.6 The pseudo-code of the overall MmGA model. 51
Figure 3.7 An NSGA-II inspired elitism strategy. 51
Figure 3.8 An extended population formation procedure, adapted from Coello
and Toscano Pulido (2001); Coello and Pulido (2005) 52 Figure 3.9 An illustration of (a) two-point crossover operator; and (b) uniform
mutation operator. In (a), the two-point crossover operator selects two points from the parent chromosomes. The elements between the two selected points are swapped between the parent and offspring; in (b), the mutation operator replaces the value of the chosen gene with a uniform random value based on the user-specified upper and lower
Figure 3.10 A comparison betweenIgd of mGA, mGA2 (i.e. dotted lines), and
bootstrappedIgdof MmGA. The error bars indicate the 95%
confidence intervals of the meanIgdresults of MmGA. 66
Figure 3.11 A comparison betweenIgd of NSGA-II (i.e. the dotted line) and
bootstrappedIgdof MmGA. The error bars indicate the 95%
confidence intervals of the meanIgdresults of MmGA. 67
Figure 4.1 A flowchart of the proposed MmGA ensemble. 72
Figure 4.2 The pseudo-code of the MmGA ensemble. 80
Figure 4.3 The pseudo-code of the elitism strategy. 80
Figure 4.4 A comparison betweenIgd of mGA, mGA2 (i.e. dotted lines) and
bootstrappedIgdof MmGA and MmGA ensemble. The error bars
indicate the 95% confidence intervals of the meanIgdresults of
MmGA and MmGA ensemble. 93
Figure 4.5 A comparison betweenIgd of NSGA-II (i.e. dotted line) and
bootstrappedIgdof MmGA and MmGA ensemble. The error bars
indicate the 95% confidence intervals of the meanIgdresults of
MmGA and MmGA ensemble. 93
Figure 4.6 The pseudo-code of an MmGA ensemble for tackling multi-objective
classification problems. 99
Figure 4.7 A comparison of accuracy rates between standard classifiers (i.e. dotted line) and bootstrapped accuracy rates of the MmGA ensemble
using the WBC data set. 103
Figure 4.8 A comparison of the number of features between standard classifiers (i.e. dotted line) and bootstrapped number of features of the MmGA
ensemble using the WBC data set. 104
Figure 4.9 A comparison of accuracy rates between standard classifiers (i.e. dotted line) and the bootstrapped accuracy rates of the MmGA
ensemble using the SHD data set. 105
Figure 4.10 A comparison of the number of features between standard classifiers (i.e. dotted line) and the bootstrapped number of features from the
MmGA ensemble using the SHD data set. 106
Figure 5.1 The flowchart of the proposed TNC-based MmGA model. 117 Figure 5.2 The pseudo-code of an overall TNC-based MmGA. 118
Figure 5.3 The TNC-based MmGA Model. 124
Figure 5.4 A comparison of bootstrappedIgdbetween MmGA ensemble and
TNC-based MmGA model using the Kursawe benchmark function.
Figure 5.5 A comparison of bootstrappedIigd between MmGA ensemble and
TNC-based MmGA model using the Kursawe benchmark function.
The error bar indicates the 95% confidence intervals ofIigd. 135
Figure 5.6 A comparison of bootstrappedIsbetween MmGA ensemble and
TNC-based MmGA model using the Kursawe benchmark function.
The error bar indicates the 95% confidence intervals ofIs. 135
Figure 5.7 A comparison of bootstrappedIigd between MOEA/D-EGO (i.e.
dotted lines) and TNC-based MmGA model using the ZDT3 benchmark function. The error bar indicates the 95% confidence
intervals ofIigd. 137
Figure 5.8 A comparison of MOP indicators between NSGA-II (i.e. dotted line) and bootstrapped result of TNC-based MmGA model using the ZDT3 benchmark function. The error bar indicates the 95% confidence
intervals ofIgdandIs. 139
Figure 5.9 The pseudo-code of the TNC-based MmGA for tackling
multi-objective classification problem. 139
Figure 5.10 A comparison between accuracy rates from standard classifiers (i.e. dotted line) and bootstrapped accuracy rates from MmGA-based
models coupled with standard classifiers for the WBC data set. 142 Figure 5.11 A comparison between number of features from standard classifiers
(i.e. dotted line) and bootstrapped number of features from
MmGA-based models coupled with standard classifiers for the WBC
data set. 143
Figure 5.12 A comparison between accuracy rates from standard classifiers (i.e. dotted line) and bootstrapped accuracy rates from MmGA-based
models coupled with standard classifiers for the SHD data set. 146 Figure 5.13 A comparison between number of features from standard classifiers
(i.e. dotted line) and bootstrapped number of features from
MmGA-based models coupled with standard classifiers for the SHD
data set. 147
Figure 5.14 A comparison between accuracy rates from SVM (i.e. dotted line) and bootstrapped accuracy rates from TNC-based MmGA coupled
with SVM for the product review data set. 152
Figure 5.15 A comparison between number of features from SVM (i.e. dotted line) and bootstrapped number of features from TNC-based MmGA
coupled with SVM for the product review data set. 153
Figure 6.1 The pseudo-code of the MmGA ensemble for tackling the job shop
problem. 161
Figure 6.2 The pseudo-code of the TNC-based MmGA model for tackling the
Figure 6.3 A comparison between cost-saving from the enumeration method (i.e. dotted lines) and bootstrapped cost-saving from the MmGA-based
models for the 5-job to 10-job problems. 164
Figure 6.4 A comparison between total tardiness from the enumeration method (i.e. dotted lines) and bootstrapped total tardiness from the
MmGA-based models for the 5-job to 10-job problems. 165
Figure 6.5 The overall flow of Cmizer. 172
Figure 6.6 The graphical user interface of Cmizer. 173
Figure 6.7 The schematic diagram of the fifth order Chebyshev Sallen-key
high-pass filter. 174
Figure 6.8 The schematic diagram of the ninth order Chebyshev multiple
feedback low-pass filter. 175
Figure 6.9 The pseudo-code of TNC-based MmGA model for tackling the circuit
parameter tuning problems. 176
Figure 6.10 A partial SPICE-based netlist for the high-pass filter. 177 Figure 6.11 A partial SPICE-based netlist for the low-pass filter. 178 Figure 6.12 Performance comparison between SA and GA from the Agilent ADS
package and the TNC-based MmGA model for the high-pass filter. 180 Figure 6.13 Performance comparison between GA from the Agilent ADS package
and the TNC-based MmGA model for the low-pass filter. 181 Figure 6.14 Performance comparison between SA and GA from the Agilent ADS
package and the TNC-based MmGA model (i.e. dotted line) for the
high-pass filter. 182
Figure 6.15 Performance comparison between GA from the Agilent ADS package and the TNC-based MmGA model (i.e. dotted line) for the low-pass
filter. 182
Figure 6.16 The graphical user interface for data collection using the smartphone
and the Android simulator. 187
Figure 6.17 The axis on an accelerometer in a smartphone. 188 Figure 6.18 The flowchart of the data collection phase. 188 Figure 6.19 Pre-processing to remove noise from the motion waveform. 189 Figure 6.20 A comparison between accuracy rate from J48 (i.e. dotted line) with
bootstrapped results from MmGA ensemble and TNC-based MmGA
Figure 6.21 A comparison between accuracy rate from Logistic (i.e. dotted line) with bootstrapped results from MmGA ensemble and TNC-based
MmGA model coupled with Logistic for the human motion data set. 194 Figure 6.22 A comparison between accuracy rate from RBF (i.e. dotted line) with
bootstrapped results from MmGA ensemble and TNC-based MmGA
model coupled with RBF for the human motion data set. 195 Figure 6.23 A comparison between accuracy rate from SVM (i.e. dotted line) with
bootstrapped results from MmGA ensemble and TNC-based MmGA
model coupled with SVM for the human motion data set. 196 Figure 6.24 A comparison between number of features from J48 (i.e. dotted line)
with bootstrapped results from MmGA ensemble and TNC-based
MmGA model coupled with J48 for the human motion data set. 197 Figure 6.25 A comparison between number of features from Logistic (i.e. dotted
line) with bootstrapped results from MmGA ensemble and TNC-based MmGA model coupled with Logistic for the human
motion data set. 198
Figure 6.26 A comparison between number of features from RBF (i.e. dotted line) with bootstrapped results from MmGA ensemble and TNC-based
MmGA model coupled with RBF for the human motion data set. 199 Figure 6.27 A comparison between number of features from SVM (i.e. dotted
line) with bootstrapped results from MmGA ensemble and
TNC-based MmGA model coupled with SVM for the human motion
data set. 200
Figure 6.28 Comparison between accuracy rates from standard classifiers (i.e. dotted line) with bootstrapped accuracy rates from MmGA ensemble
and TNC-based MmGA model for the MI data set. 203 Figure 6.29 Comparison between number of features from standard classifiers (i.e.
dotted line) with bootstrapped number of features from MmGA
LIST OF ABBREVIATIONS
AoC Apportionment of Credit CD Crowding distance EA Evolutionary Algorithm J48 J48 decision tree
Logistic Logistic regression model MAS Multi-Agent System MDR Mediated Decision Rule
mMDR modified Mediated Decision Rule MOEA Multi-Objective Evolutionary Algorithm MOGA Multi-Objective Genetic Algorithm MOP Multi-objective Optimization Problem mGA micro Genetic Algorithm
mGA2 micro Genetic Algorithm II MmGA Modified micro Genetic Algorithm NPGA Niched-Pareto Genetic Algorithm
NSGA Non-dominated Sorting Genetic Algorithm NSGA-II Non-dominated Sorting Genetic Algorithm II PAES Pareto Archived Evolution Strategy
RBF Radial Basis Function neural network RL Reinforcement Learning
SHD Statlog Heart Disease
SOP Single-objective Optimization Problem SPEA Strength Pareto Evolutionary Algorithm SPEA2 Strength Pareto Evolutionary Algorithm 2 SVM Support Vector Machine
TNC Trust-Negotiation-Communication VEGA Vector Evaluated Genetic Algorithm WBC Wisconsin Breast Cancer
LIST OF SYMBOLS
accuracy An accuracy rate of classification performance measure archiveSize The size of archive for the adaptive grid process bid A bid of AoC scheme
BiSection The depth for the adaptive grid archive cbid A bid coefficient of AoC scheme ebid An effective bid of AoC scheme
payment A reward payment procedure at clearing house of the AoC scheme
CD An CD-based crowded comparison operator
≺ or The weak and strict of Pareto dominance concept Igd An MOP indicator of Generational Distance
Iigd An MOP indicator of Inverted Generational Distance
Is An MOP indicator of Spread
mv An RL reward/penalty signal
m A population memory size
pf A Pareto front
pftrue A true Pareto front
rm A replaceable memory component
irm An irreplaceable memory component ratio A replacement ratio forrm
ratio A set of replacementratio
spec A specificity rate of classification performance measure sens A sensitivity rate of classification performance measure strength A strength score of MmGA under the AoC scheme num f ea A number of features of the classification problem
LIST OF SYMBOLS FOR LEMMAS
c0 A maximum outlier generation cycle c1 A maximum nominal evolution cycle
c2 A size of existing cumulative non-dominated front before generation cyclet c3 A total number of ensemble members (MmGAs)
c4 A size ofirm
c5 An element size fromrmandirmcomponents for the extended population formation in MmGA
c6 An element size fromrmandmcomponents for the extended population formation in MmGA
c7 An element size from random generated solutions for the extended population formation in MmGA
c8 A number of elements of MmGA in the AoC scheme c9 A number of elements of MmGA in the RL scheme
c10 An element size after feedback at outlier generation cycle f b c11 An element size after feedback at outlier generation cycle f b−1 c12 An element size after feedback at outlier generation cycle f b−2 c13 A number of MmGA ensembles
c14 A number of MOP indicators M The number of objectives N The number of population sizes
MODEL TERTINGKAT BERASASKAN ALGORITMA
GENETIK MIKRO UNTUK PENGOPTIMUMAN BERBILANG
OBJEKTIF
ABSTRAK
Masalah pengoptimuman berbilang objektif (Multi-objective Optimization Problem-MOP) melibatkan berbilang objektif yang perlu dipenuhi serentak. Sekumpulan penyelesaian opti-muman alternatif diperlukan untuk memenuhi kesemua objektif yang menunju ke arah barisan Pareto. Di samping itu, kualiti penyelesaian optimuman yang baik perlu diseimbangkan antara penumpuan dan kepelbagaian ke arah barisan Pareto sebenar (true Pareto front). Penyelidik-an ini berkenaPenyelidik-an cara algoritma evolusi digunakPenyelidik-an untuk menPenyelidik-angPenyelidik-ani masalah pengoptimumPenyelidik-an berbilang objektif dengan kewujudan sifat penumpuan and kepelbagaian yang baik kepada pe-nyelesaian berkenaan dengan barisan Pareto sebenar. Algoritma genetik mikro (micro Genetic Algorithm-mGA) dijadikan sebagai blok asas untuk mereka bentuk serta membangun ketiga-tiga model yang dicadangkan. Algoritma genetik mikro terubah suai (Modified micro Genetic Algorithm-MmGA) merupakan model pertama yang dicadangkan dengan matlamat mencari penyelesaian optimuman Pareto optimum secara cekap dan meningkatkan skor penumpuan (convergence score) penyelesaian ke arah barisan Pareto (Pareto front) dalam penyelesaian masalah pengoptimuman berbilang objektif. Seterusnya, ensembel MmGA (MmGA ensemble) dicadangkan untuk meningkatkan keteguhan model MmGA individu dan, pada masa yang sa-ma mencepatkan skor penumpuan ke arah barisan Pareto. Seterusnya, demi mengambil kira kedua-dua ukuran penumpuan serta kepelbagaian penyelesaian (diversity measure) optimum Pareto, sistem berbilang agen berasaskan model penaakulan Amanah-Rundingan-Komunikasi (Trust, Negotiation, Communication-TNC) dieksploitasikan. Sehubungan itu, berbilang
tunjuk prestasi digunakan dalam model MmGA berasaskan TNC untuk pengukuran skor pe-numpuan dan kepelbagaian. Kekompleksan masa komputasi untuk ketiga-tiga model diperik-sa dengan analisis tatatanda O(O-notation analysis). Kekompleksan masa komputasi untuk ketiga-tiga model adalah berasimptot lebih tinggi berbanding dengan yang untuk mGA, namun serupa dengan yang untuk Algoritma Genetik Isihan Tak Terdominan II (Non-dominated Sor-ting Genetic Algorithm II-NSGA-II), yang terbenam dalam semua model berasaskan MmGA demi untuk meningkatkan prestasi mereka. Semua model yang dicadangkan mencatatkan ke-putusan yang baik berbanding dengan model pra-pengganti dalam skor penumpuan and skor kepelbagaian penyelesaian optimum. Model-model yang dicadangkan juga melaporkan pe-ningkatan prestasi pengelas, dan pengurangan bilangan ciri yang digunakan dalam masalah pengelasan berbilang objektif. Potensi praktikal model berasaskan MmGA yang dicadangkan dalam menangani empat masalah dunia sebenar turut ditunjukkan. Semua petunjuk prestasi model berasaskan MmGA diukur menggunakan kaedah bootstrap. Hasil daripada kajian ini berjaya menentukan kebergunaan model berasaskan MmGA yang dicadangkan bagi menanga-ni masalah pengoptimuman berbilang objektif.
ENHANCED MICRO GENETIC ALGORITHM-BASED
MODELS FOR MULTI-OBJECTIVE OPTIMIZATION
ABSTRACT
Multi-objective Optimization Problems (MOPs) entail multiple conflicting objectives to be satisfied simultaneously. As such, a set of alternative solutions that is able to satisfy all objec-tives with respect to the Pareto optimality principle is desired. Besides that, the quality of good MOP solutions needs to strike a balance between convergence and diversity against the true Pareto front (i.e. distribution of the ideal Pareto optimal solutions). This research is concerned with how evolutionary algorithms can be employed to undertake MOPs with good convergence and diversity properties of the solutions with respect to the true Pareto front. Specifically, three evolutionary models based on the micro Genetic Algorithm (mGA) have been developed in a sequential manner for undertaking MOPs. Firstly, a Modified mGA (MmGA) model is in-troduced. MmGA aims to search for the Pareto optimal solutions efficiently and improve the convergence score of the solutions towards the Pareto front in tackling MOPs. Secondly, an en-semble of MmGA models is proposed to improve the robustness of individual MmGA models and, at the same time, to accelerate the convergence score of the solutions towards the Pareto front. Thirdly, to take both convergence and diversity scores of the Pareto optimal solutions into consideration, a multi-agent system that utilizes the Trust-Negotiation-Communication (TNC) reasoning scheme is exploited. Multiple performance indicators are incorporated into the TNC-based MmGA model, in order to achieve good convergence and diversity scores. The computational time complexity of three proposed evolutionary models is examined using the O-notation analysis. It is found that, while the computational time complexity of the three pro-posed models is higher than that of mGA, all propro-posed models have the same computational
time complexity with that of the Non-dominated Sorting Genetic Algorithm II (NSGA-II), which is embedded into all proposed models to improve their performances. Based on a num-ber of MOP benchmark problems, all proposed models are able to yield favorable results as compared with those from their predecessors in term of convergence and diversity scores of the solutions. A number of experiments with multi-objective classification problems also indi-cate improvement of the classifier performances and, at the same time, reduction of the number of features used in classification, as compared with the results from standard classifiers as well as from other methods published in the literature. The potential of the proposed MmGA-based models in undertaking practical problems has also been demonstrated using four real-world MOPs. All performance indicators of the proposed MmGA-based models are quantified us-ing the bootstrap statistical method. The outcomes positively ascertain the usefulness of the proposed evolutionary models in undertaking MOPs.
CHAPTER 1
INTRODUCTION
In this chapter, the research background is first presented. Then, the research questions, re-search objectives, and rere-search scope are clarified. The organization of this thesis is presented at the end of this chapter.
1.1 Research Background
The research background includes an introduction to Multi-objective Optimization Problems (MOPs) and the Pareto optimality principle that is used as the yardstick to measure the ef-fectiveness of various Evolutionary Algorithms (EAs) developed in this research. Specifically, Multi-Objective Evolutionary Algorithms (MOEAs) that constitute the core of this research are described.
1.1.1 Multi-Objective Optimization
Real-world problems often entail multiple and yet conflicting objectives. As a result, many optimization methods have been developed and employed to help identify and resolve the re-lationships among different, possibly contradictory, objectives since decades ago (Purshouse and Fleming, 2003). In general, optimization refers to finding the best possible solution of a problem with respect to a given set of constraints (Coello, 2006). The solution produced by an optimization model usually contains trade-offs, i.e. improvement in one objective could lead to degradation of another objective. As an example, saving cost by minimizing the number of workers in a production line could result in a longer production time.
A literature survey reveals that MOPs exist in a variety of domains. Examples include mini-mizing energy used and broadcasting time while maximini-mizing the coverage achieved in a mobile ad hoc network (Ruiz et al., 2013); maximizing strength and elastic modulus while minimiz-ing the cost of designminimiz-ing titanium alloys in prosthetic applications (Datta et al., 2013); maxi-mizing profits in production scheduling under different environmental and economic concerns (Capón-García et al., 2013); minimizing operation cost, emission, and transmission losses of scheduling in a dispatch problem (Li, Das, Pahwa and Deb, 2013). These problems are known as MOPs because they require multiple objectives to be satisfied at the same time. As such, a set of alternative solutions in tackling all objectives is required. The solution set is known as the Pareto optimal solutions (Fonseca and Fleming, 1995). This means that the solutions are non-dominated, non-inferior, admissible, or efficient solutions (Fonseca and Fleming, 1995). This situation gives rise to the issue of what the optimal solution for an MOP is.
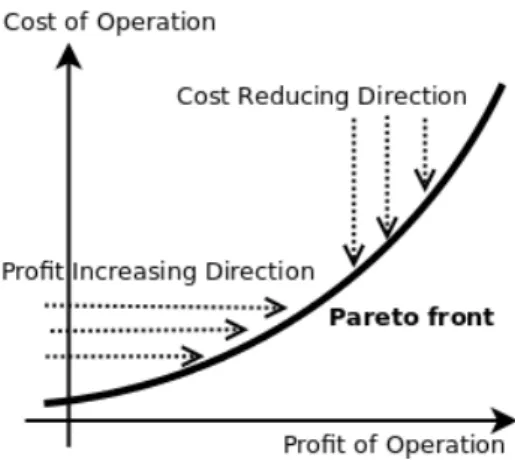
As an example, consider a manufacturing operation where the board of management would like to have a high profit and a low operation cost. Logically, the production cost has a direct relationship with the profit generated from manufacturing operations, where more capital in-vestments lead to more revenue under an ideal, risk-free environment. In such a case, the cost-profit relationship can be viewed as a positive slope of a line chart, as shown in Figure 1.1. The cost-decreasing activities move downwards from the top until the Pareto front (as explained in the next section) is reached. Similarly, the profit-increasing activities move to the right towards the Pareto front. As such, a decision is said to be Pareto inefficient, i.e. all coordinates reside on the Pareto front, if one activity (such as increasing profit) can be con-ducted without harming any other activities (such as reducing cost). On the contrary, a solution is said to be Pareto efficient or Pareto optimal if improvement in an activity always leads to degradation of one or more activities.
Figure 1.1: An example of the typical cost-profit operation problem and the Pareto front.
1.1.2 The Pareto Optimality Principle
Originated from Vilfredo Pareto (an Italian economist), the Pareto principle claimed that 20% of the population held 80% of wealth, i.e. the 80-20 rule (Pareto and Schwier, 1971). In other words, the Pareto principle describes that 80% of effects come from 20% of causes (Pareto and Schwier, 1971). This principle has been successfully used in explaining the dynamics under-lying many different problems. As an example, in a study for ranking data from twelve types of sports, the results showed that only a few top-ranked players and teams are accumulating the majority of the prizes through the sport ranking model (Deng et al., 2012). In minimization problems, the concept of "Pareto optimal" is defined when there are no other feasible solutions which can decrease an objective without causing a simultaneous increase in at least one other objective (Coello, 2006). The opposite scenario applies to maximization problems. As such, the solutions for an MOP entail trade-offs, and when the Pareto principle is observed, they are known as the Pareto optimal set of solutions.
In essence, the Pareto optimal set refers to a set of Pareto efficient points known as the "Pareto front" (pf).The use ofpfto evaluate efficacy of optimization trade-offs has been inves-tigated in the literature. As an example,pfwas employed to examine conflicting objectives in a plethora of biological observations ranging from morphological features like bird beak and bat wing shapes (Shoval et al., 2012).
A variety of Pareto-based evolutionary methods for solving MOPs are available. In the pharmacological area, drug designs with multiple targets using evolutionary methods for de-termining the molecular targets of drugs were reported in Lounkine et al. (2012). An adaptive Pareto-based evolutionary method was introduced to optimize the design of ligands against polypharmacological profiles (Besnard et al., 2012). In a Pareto-based evolutionary method pertaining to an acetylcholinesterase inhibitor drug, the associated multi-objective prioritiza-tion activity was performed by calculating the parameters involved as a multi-dimensional co-ordinate. The output was ranked by the magnitude between multi-dimensional coordinates of the predicted values and the ideal objective points, which are known as the true Pareto front (pftrue) (Besnard et al., 2012).
1.1.3 Evolutionary Algorithms
Evolution by natural selection is a compelling area in modern science, and it has been shown to be able to solve problems and to model natural phenomena since the early 1990s (Forrest, 1993). There are many independent efforts to incorporate ideas from natural evolution into computation, and to realize a logical theory of adaptive systems (Holland, 1962). To date, many useful EAs are available to deal with different challenges. Novel reproduction operators (Ishibuchi et al., 2010), fitness function management strategies (Zhang and Li, 2007; Zhang et al., 2010), and weight assignments (Soylu and Koksalan, 2010) have been introduced to improve the convergence score to the Pareto optimal solutions, as well as the spread of solutions alongpf. The key objective of evolutionary computation is to establish an effective and efficient computing paradigm by exploiting natural selection phenomena and the learning capability of problem solving. This, in turn, has led to the development of EAs for tackling optimization problems (Coello and Lamont, 2004).
find the best possible solution available, or at least a good approximation to the best solution. In this research, the focus is on tackling MOPs using multi-objective EA-based models.
1.1.4 Multi-Objective Evolutionary Algorithms
MOEAs have been investigated (Van Veldhuizen and Lamont, 2000; Zhou et al., 2011) and used in undertaking MOPs since more than a decade ago. In general, multi-objective optimization methods can be broadly classified into three types according to two different stages of the MOP solution (Coello et al., 2007), i.e. stage (i) the objective function of optimization involved, and stage (ii) the process of deciding the trade-offs in solutions from the decision maker perspective, or known as the multi-criteria decision making process.
The three types of methods (Van Veldhuizen and Lamont, 2000; Coello et al., 2007) that are used for searching and making multi-criterion decisions are:
• the priori preference method (decide→search),
• the posteriori preference method (search→decide), and
• the progressive preference method (decide↔search).
The "decide→ search" method makes a decisions before searching, while the "search→ de-cide" method performs searching before making a decision. The "decide↔ search" method combines search and decision making in its operation. A recent survey (Giagkiozis et al., 2014) claimed that the "search→decide" method is frequently employed owing to a higher degree of separation between the algorithm and decision-making process. This optimization method allows the testing process of population-based MOEAs to be conducted independently from the target MOP, without involving the decision maker in its operation. In other words, the decision maker is presented with a set of Pareto optimal solutions, i.e. non-dominated solutions, and the
decision is chosen therein.
1.2 Research Questions
As reported in Giagkiozis et al. (2014), insufficient information and/or advice is often provided for practitioners to choose a suitable EA in practical applications. As a result, a comparison guideline for the number of publications per year was conducted (Giagkiozis et al., 2014). The data were extracted from the ISI Web of Knowledge from 1991 to 2012. The outcomes showed that the Genetic Algorithm (GA) recorded the highest number of publications as compared with other EAs. Meanwhile, the number of publications on the use of GA for MOPs also appeared to be the highest as compared with other problems such as continuous problems, discrete problems, and combinatorial problems.
On the other hand, population-based MOEA has been recognized as a useful optimisation methodology for tackling MOPs due to its versatility (Giagkiozis et al., 2014). The use of a large population size has been a commonly used strategy in improving the performance of an EA. However, Chen et al. (2012) reported that a large population leads to a larger probability of finding optimum solutions at the local basin by an EA.
In this research, the main research focus is on a popular GA-based model with the "search
→ decide" method. Specifically, this research uses a GA-based model that operates with a small population using the "search→decide" method. The micro Genetic Algorithm (mGA) (Coello and Pulido, 2005), which offers a good convergence score towardspftrueby using only
a small population size of 3-6 chromosomes, forms the core model in this research.
Three enhanced mGA-based models are proposed, i.e. a Modified micro Genetic Algorithm (MmGA), an MmGA ensemble, and an agent-based MmGA model, for undertaking MOPs. The key research questions undertaken in this research are:
• how to improve the convergence properties of the MmGA solutions towards the Pareto front while preserving the salient features of the original mGA model?
• how to achieve better convergence properties of solutions from single MmGA model towards the Pareto front by using an ensemble of MmGA models?
• how to incorporate multiple MOP performance indicators into a hierarchical agent-based MmGA model and enhance both convergence and diversity properties of the solutions towards the Pareto front?
It has been reported in (Coello and Pulido, 2005) that since mGA possesses a very small population size, its population reinitialization procedure is crucial in avoiding the pre-matured convergence problem. In this research, since the MmGA-based models are developed by us-ing mGA as the buildus-ing block, the salient properties of mGA are preserved. In particularly, the population re-initialization procedure is maintained in the proposed MmGA-based models, therefore inheriting the capability of avoiding the pre-matured convergence problem. In addi-tion, issue related to maintaining the computational time complexity of the resulting algorithms of MmGA-based models are analyzed in detail.
1.3 Research Objectives
This research is devoted to the design, development, and application of three enhanced mGA-based models for undertaking MOPs. The Pareto front, which contains all optimal (non-dominated) solutions, is used as the yardstick for evaluating the performances. The bootstrap method is employed to quantify the results statistically (Efron, 1982; Hall, 1992). In addition, the computational time complexity of the resulting models is analyzed using the O-notation method (Kleinberg and Tardos, 2006; Cormen et al., 2009). The specific research objectives are as follows:
• to improve the original mGA with three proposed models:
– an MmGA model that is able to provide a set of solutions for tackling MOPs with good convergence properties towards the true Pareto front,
– an ensemble of MmGA models that is able to improve the solutions from a pool of individual MmGA models with better convergence properties towards the true Pareto front, and
– an agent-based MmGA model that is able to provide good solutions which consider both convergence and diversity properties towards the true Pareto front.
• to systematically analyse the computational time complexity of the three proposed mGA-based models,
• to comprehensively evaluate the effectiveness and applicability of individual, ensemble, and agent-based MmGA models using a series of benchmark and real-world MOPs.
1.4 Research Scope
In this research, an GA-based of MOEA framework with three multi-objective optimization models are introduced. These models, i.e. MmGA, an MmGA ensemble, and an agent-based MmGA model, are escalated and explained sequentially in chapters to undertake MOPs. A series of benchmark and real MOPs are employed to evaluate the effectiveness of the proposed models. The effectiveness of the proposed models is assessed within the Pareto optimality concept. The measures of effectiveness are constrained within the convergence and diversity properties of the solutions with respect to the Pareto front. To quantify the performance statis-tically, the experimental results of each model are evaluated using the bootstrap method, i.e. a statistical evaluation method that does not rely on the underlying data statistics, and is useful for small data samples. The performance of the models is compared with those from other re-lated methods published in literature. In addition, the models are analyzed with the worst-case computational time complexity analysis using theO-notation method. The detail methods of each model in solving the MOP and its assessment in robustness constitute the main research scope of this thesis.
1.5 Research Contribution
This research contributes three enhanced mGA-based models to tackle MOPs, namely MmGA, MmGA ensemble, and agent-based MmGA model. Systematic benchmark evaluations on ef-ficacy the three models are conducted. Applicability of the agent-based MmGA model to four real-world case studies is demonstrated. In addition, the computation time complexity of the three models are analyze usingO-notation method.
Seven steps are conducted to realize the contributions of this research, as follows.
complexity with theO-notation method,
2. evaluating MmGA using benchmark MOP functions,
3. improving MmGA with a better convergence score: formulating an MmGA ensemble, and deriving its computational time complexity using theO-notation method,
4. evaluating the MmGA ensemble with benchmark MOP functions and multi-objective classification problems,
5. improving the MmGA ensemble with better convergence and diversity scores: formulat-ing the agent-based MmGA model usformulat-ing the Trust-Negotiation-Communication (TNC) structure, and deriving its computational time complexity using theO-notation method,
6. evaluating the TNC-based MmGA model with benchmark MOP functions and multi-objective classification problems, and
7. evaluating efficacy of the TNC-based MmGA model with real-world multi-objective classification and optimization problems.
1.6 Thesis Organization
The organization of this thesis is as follows: in Chapter 2, a literature review is presented. The review covers MOPs, MOEAs, mGA, and the Pareto principle. Besides that, the performance indicators of MOEAs, the O-notation analysis for computational time complexity measure-ment, and the bootstrap sampling of statistical method are explained.
The details of the proposed three MmGA-based models are elaborated in Chapters 3, 4, and 5, respectively. In Chapter 3, the mGA model and theO-notation analysis of the resulting model are described. A detailed description of the first proposed model, i.e. MmGA and itsO -notation analysis is presented. In addition, an evaluation of the proposed MmGA model with a
benchmark MOP is conducted. The results are compared with those published in the literature.
In Chapters 4 and 5, detailed descriptions pertaining to the second and third proposed models are presented, i.e. MmGA ensemble and agent-based MmGA model, respectively. The O-notation analyses for the resulting models are provided. Evaluations on the proposed models are conducted with benchmark MOPs and multi-objective classification problems. Again, the results are compared with those published in the literature.
In Chapters 6, real-world case studies are presented to assess the effectiveness of the MmGA-based models. The case studies include a objective job shop problem, a multi-objective circuit design problem, a multi-multi-objective human motion detection and classification problem, and a multi-objective myocardial infarction classification problem. The results are compared with the enumeration method for the job shop problem, and Simulated Annealing and GA from the commercial Agilent ADS software for the circuit design problem. On the other hand, popular standard classifiers in the literature, i.e. J48 decision tree, Logistic Regres-sion model, Radial Basis Function neural network, and Support Vector Machine, are used for comparison purposes in both the human motion detection and myocardial infarction classifica-tion problems.
CHAPTER 2
LITERATURE REVIEW
A literature review pertaining to principles, models, and methods that are closely related to this research is presented in this chapter. Specifically, Multi-Objective Evolutionary Algorithms (MOEAs), micro Genetic Algorithm (mGA) and its variants, as well as the Pareto principle are reviewed and explained. Then, various MOEA performance indicators, theO-notation analysis, as well as the bootstrap method used to evaluate the proposed models are described in detail.
2.1 Multi-Objective Evolutionary Algorithms
In general, search and optimization schemes can be grouped into three schemes, i.e. enumer-ative, deterministic, and stochastic (Coello et al., 2007). The enumerative scheme explores a defined finite search space with all possible solutions. The deterministic scheme limits the search space for the required solution in a given time constraint. The stochastic scheme re-quires a fitness function to carry out search and evaluate the possible solutions, as well as a mechanism to map the target problem into the model parameters. EAs belong to the stochastic scheme (Coello et al., 2007). They are able to search for a set of possible solutions that forms
pf.
There are four conventional EA-based models (Iba and Aranha, 2012a):
• Genetic Algorithm (GA): The GA is the earliest form of the evolutionary paradigm. Its operators are used to change and improve upon a population of solutions to a problem (Holland, 1992),
• Evolutionary Strategy (ES): Similar to the GA, ES focuses more on the mutation activity (Bäck, 1996),
• Genetic Programming (GP): GP is also similar to the GA. It includes an extension of genetic elements using expressions in terms of trees and graphs (Koza et al., 2005), and
• Evolutionary Programming (EP): EP uses interaction of "species", rather than "individ-uals", as used in the other three paradigms (Fogel, 1994).
Summing the objective function scores is a common method to turn an MOP into a Single-objective Optimization Problem (SOP). In SOP, a scalar function is used to represent the new optimization criterion (Smajic et al., 2009). Each scalar factor relies on a number of parameters, where trade-offs among the original objectives can be specified, i.e. the (i) weighted sum, (ii) Tchebycheff, and (iii)ε-constraint (Zitzler, 2012). An MOP differs from a SOP as it contains
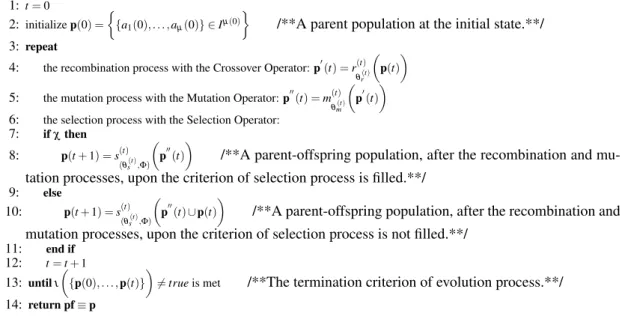
multiple objectives that require simultaneous optimization, and has acceptable performance ranges for all objective functions. Figure 2.1 shows the pseudo-code of an EA for undertaking SOP, which can be extended for tackling MOPs. The explanation is as follows:
1: t=0
2: initializep(0) =
{a1(0), . . . ,aµ(0)} ∈Iµ(0)
/**A parent population at the initial state.**/
3: repeat
4: the recombination process with the Crossover Operator:p0(t) =r(t)
θr(t)
p(t)
5: the mutation process with the Mutation Operator:p00(t) =m(t)
θm(t)
p0(t)
6: the selection process with the Selection Operator: 7: ifχthen 8: p(t+1) =s(t) (θs(t),Φ) p00(t)
/**A parent-offspring population, after the recombination and mu-tation processes, upon the criterion of selection process is filled.**/
9: else 10: p(t+1) =s(t) (θs(t),Φ) p00(t)∪p(t)
/**A parent-offspring population, after the recombination and mutation processes, upon the criterion of selection process is not filled.**/
11: end if 12: t=t+1 13: untilι {p(0), . . . ,p(t)} 6
=trueis met /**The termination criterion of evolution process.**/
14: return pf≡p
LetIbe a non-empty set with an individual space,µ(i)be a sequence inZ+fori∈N. Both
I andµ denote a parent population at the initial stage, as i=0 (line 2). Note that µ 0
(i) and
µ 00
(i)fori∈Nare the offspring population in a sequence inZ+(lines 4, 5, 8, and 10). On the
other hand, χ∈ {true,f alse}is the criterion of the selection operator,θr(i)∈X(ri), θ( i)
m ∈X(mi)
andθs(i)∈X(si)are the crossover, mutation, and selection operators, respectively. Besides that,r
is a sequence inr(i)of the crossover operator,r(i):X(ri)→τ
Ω(ri),τ(Iµ (i) ,Iµ0(i)) (line 4),mis a sequence inm(i)of the mutation operator,m(i):X(mi)→τ
Ω(mi),τ(Iµ 0(i) ,Iµ 0(i) ) (line 5), andsis a sequence ins(i)of the selection operator,s(i):Xs(i)×τ(I,R)→τ
Ω(si),τ(Iµ
0(i)
+χ µ(i),Iµ(i+1))
(lines 8 and 10). With the termination criterion,ι:S∞i=1(Iµ)(i)→ {true,f alse}(line 13), the fitness function of the EA can be denoted as Equation 2.1. Similarly, in MOEAs, the single-objective fitness function is substituted with a multi-single-objective fitness function, i.e., Equation 2.2 (Coello et al., 2007). Note thatn(n≥2) represents multiple objective functions, andI is the initial parent population of MOEAs.
Φ:I→R (2.1)
Φ
0
:I→Rn (2.2)
The first implementation of MOEA was in 1985, i.e. the Vector Evaluated Genetic Al-gorithm (VEGA), to solve problems in machine learning (Schaffer, 1985). According to Gi-agkiozis et al. (2014), an EA comprises five elements in undertaking MOPs: (i) the main algorithm, (ii) an extension to deal with constrained optimization problems, (iii) an element to maintain promising solutions, (iv) an elitism determination criterion, and (v) a stopping crite-rion to stop the algorithm execution using one or more pre-defined conditions.
The main algorithm consists of three operators: (i) one that combines information within the population (crossover operator), (ii) one that perturbs some individuals to enhance search
space exploration (mutation operator), and (iii) one that selects promising individuals to be part of the new generation (selection operator). A variety of EA-based models with different characteristics have been used to solve MOPs in various domains, as shown in Table 2.1.
Table 2.1: EA-based models in undertaking MOPs
Model Characteristic Usage
Artificial Immune Systems (Dasgupta, 2006)
It is a model that mimics the mechanisms of the biological immune system, and simulates dynamic behaviors in the presence of antigens and pathogens.
Novel MOEA design and formation (Shang et al., 2012), and distributed system reconfiguration (Ahuja et al., 2007).
Ant Colony Optimization (Dorigo and Di Caro, 1999)
It is a swarm intelligence-based model inspired from the foraging behavior of ants and the pheromone on the ground followed by other members of the colony.
Novel MOEA design and formation (Lopez-Ibanez and Stutzle, 2012; Ke et al., 2013), electromagnetic design (Ho and Yang, 2008), robot wall-following control (Hsu and Juang, 2013), and distributed system reconfiguration (Ahuja et al., 2007).
Bees Algorithm (Pham et al., 2006)
It is based on the behavior of honey bees in a colony. Artificial bees are grouped into three types: employed bees, onlookers, and scouts. An onlooker bee waits in the dance area to make a decision to choose a food source. An employed bee goes to the food source it visited previously. The scout bees carry out random searches.
Novel MOEA design and formation (Zou et al., 2011), sizing and distribution system reconfiguration (Nasiraghdam and Jadid, 2012), DNA sequence design
(Chaves-González et al., 2013), copper strip production (Zhang et al., 2012), and power flow optimization (Khorsandi et al., 2013).
Cuckoo Search Algorithm (Yang and Deb, 2009)
It is based on the breeding strategy of cuckoos in combination with the Lévy flight behaviours of birds and fruit flies.
Hysteresis parameter estimation in Jiles-Atherton vector (Coelho, Guerra, Batistela and Leite, 2013), symmetric linear array element optimization (Rani et al., 2012), and job shop scheduling (Hanoun et al., 2012).
Differential Evolution (Storn, 1996; Pampara et al., 2006)
It is simple in concept, and has a small number of tuning parameters. It is used to handle real and binary representations in objective functions for global search.
Novel MOEA design and formation (Ali et al., 2012; Wang and Cai, 2012), fuel economy and emissions optimization for hybrid electric vehicles (Wu et al., 2011), and transformer design (Coelho, Mariani, Ferreira da Luz and Leite, 2013).
Particle Swarm Optimization (Eberhart and Kennedy, 1995; Kennedy and Eberhart, 1997; Kennedy, 2010)
It is inspired by the flocking behavior of birds as well as swarm theory. The decision vectors, i.e. particles, are updated based on the velocity through a set of rules using a pre-defined fitness. An archive, which is similar to the selector operator in the GA, is used to keep the best achieved objective function values for each particle.
Novel MOEA design and formation (Wang and Yang, 2010; Daneshyari and Yen, 2011), hysteresis parameter estimation in Jiles-Atherton vector (Coelho et al., 2012), and path following footstep optimization for humanoid robots (Lee and Kim, 2013).
2.1.1 Generation of MOEAs
Research in MOEAs can be broadly divided into two generations, as shown in Figure 2.2. The first generation of MOEAs focuses on simplistic methodologies in validation, while the sec-ond generation concentrates on efficiency at the algorithmic and data structure levels (Coello, 2006). Further explanations are given in the subsequent sub-sections.
First Generation
Vector Evaluated Genetic Algorithm (VEGA) Multi-Objective Genetic Algorithm (MOGA) Niched-Pareto Genetic Algorithm (NPGA) Non-dominated Sorting Genetic Algorithm (NSGA)
Second Generation
Strength Pareto Evolutionary Algorithm (SPEA) Strength Pareto Evolutionary Algorithm 2 (SPEA2) Pareto Archived Evolution Strategy (PAES)
Non-dominated Sorting Genetic Algorithm II (NSGA-II)
Figure 2.2: Generations of Multi-Objective Evolutionary Algorithms.
2.1.1.1 The First Generation
VEGA (Schaffer, 1985) extends the GA principles for tackling MOPs by considering all ob-jectives simultaneously. The limitation of VEGA is its inability to retain solutions with good candidates under the modified selection scheme. MOGA (Fonseca and Fleming, 1993) uti-lizes the Pareto dominance () concept to combine multiple objectives, and incorporates the "decide ↔ search" method (Van Veldhuizen and Lamont, 2000) to involve decision makers interactively. Individuals in the population are ranked based on their dominance relationship, and the selection procedure is guided by the ranked scores (Fourman, 1985).
Niched-Pareto Genetic Algorithm (NPGA) (Horn et al., 1994) utilizes a tournament selec-tion scheme based on theconcept. Theconcept is used to determine the winner of non-dominated individuals based on two randomly chosen individuals from the entire population. This method leads to the success of other MOEAs, such as mGA (Coello and Pulido, 2005), Strength Pareto Evolutionary Algorithm (SPEA) (Zitzler and Thiele, 1999), and Strength Pareto Evolutionary Algorithm 2 (SPEA2) (Zitzler et al., 2001). Based on both competitors in NPGA,
the winning decision is determined using fitness sharing. This method brings a uniform distri-bution of individuals in the objective function space. NPGA extends research in the rank-niche evolution strategy (Chen and Hsu, 2006) and utilizes the sharing concept to maintain a uni-formly distributed solution. On the other hand, Non-dominated Sorting Genetic Algorithm (NSGA) (Srinivas and Deb, 1994) is based on several layers of individual classifications. The population is ranked on the basis of non-domination before the selection activity. Diversity of solutions is maintained by sharing the dummy fitness scores among different layers of non-dominated individuals. NSGA is not computational efficient, because repeating the Pareto ranking process causes the growth of computational time complexity toO(MN3), whereMis the number of objectives andNis the population size (Deb et al., 2002).
2.1.1.2 The Second Generation
In Pareto Archived Evolution Strategy (PAES) (Knowles and Corne, 2000), the crowding pro-cedure is used in the objective space to maintain diversity of the Pareto optimal set. An adap-tive grid is used to locate the solution based on its objecadap-tives. The concept of an adapadap-tive grid archive is also used in other MOEAs, such as mGA (Coello and Pulido, 2005) and mGA2 (Toscano Pulido and Coello, 2003). SPEA (Zitzler and Thiele, 1999) uses the archive approach to keep the non-dominated solutions with the strength value labeling during each generation. The fitness of each individual, determined by the closeness to the true Pareto front and an even distribution of solutions, is computed according to the strength scores in the archive. The
concept is used to ensure the quality of the Pareto optimal set distribution. Efficiency of SPEA is jeopardized when the archive size grows too large, which slows down the search process. A pruning technique can be applied to ensure that the archive size remains below a certain thresh-old without affecting the selection pressure (Coello, 2006). SPEA2 (Zitzler et al., 2001) is an extension of SPEA (Zitzler and Thiele, 1999) in three aspects: (i) a more fine-grained fitness assignment for individual domination, (ii) a guided search of the nearest neighbor density
esti-mation, and (iii) an enhanced archive pruning procedure to preserve the boundary of the Pareto optimal set.
NSGA-II (Deb et al., 2002) uses the Crowding Distance (CD) to estimate the density of solutions surrounding a particular solution in the population by computing the average dis-tance of two points. It uses the crowded comparison operator (CD) to determine the chosen
solution. A non-dominated solution is preferred over a dominated solution, as well as the one that resides in the less crowded region is preferred among non-dominated solutions. Note that iCDjwhenirank< jrankor(irank= jrankandiCD<iCD), bothiand jare the individuals in the
population, whereby each of them has the attributes of a non-dominated rank (irank) and
crowd-ing distance (iCD). NSGA-II also uses the elitism strategy to combine the best parents with the
best offspring. TheCDmeasure is used in other MOEAs, such as mGA, mGA2 (Coello and Pulido, 2001) , the niching-based differential-evolution algorithm (Qu et al., 2012), and the preference-based solution selection algorithm (Kim et al., 2012). A summary of the reviewed MOEAs is shown in Table 2.2.
Table 2.2: A Summary of MOEAs spanning two generations
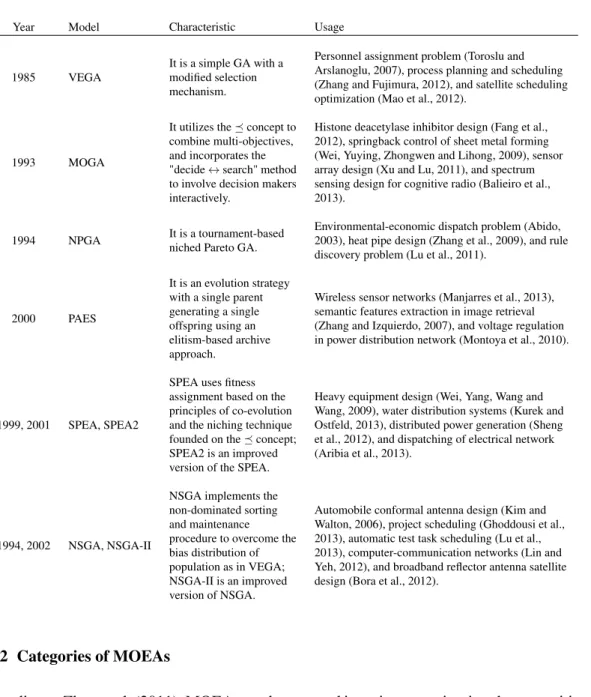
Year Model Characteristic Usage
1985 VEGA
It is a simple GA with a modified selection mechanism.
Personnel assignment problem (Toroslu and Arslanoglu, 2007), process planning and scheduling (Zhang and Fujimura, 2012), and satellite scheduling optimization (Mao et al., 2012).
1993 MOGA
It utilizes theconcept to combine multi-objectives, and incorporates the "decide↔search" method to involve decision makers interactively.
Histone deacetylase inhibitor design (Fang et al., 2012), springback control of sheet metal forming (Wei, Yuying, Zhongwen and Lihong, 2009), sensor array design (Xu and Lu, 2011), and spectrum sensing design for cognitive radio (Balieiro et al., 2013).
1994 NPGA It is a tournament-based niched Pareto GA.
Environmental-economic dispatch problem (Abido, 2003), heat pipe design (Zhang et al., 2009), and rule discovery problem (Lu et al., 2011).
2000 PAES
It is an evolution strategy with a single parent generating a single offspring using an elitism-based archive approach.
Wireless sensor networks (Manjarres et al., 2013), semantic features extraction in image retrieval (Zhang and Izquierdo, 2007), and voltage regulation in power distribution network (Montoya et al., 2010).
1999, 2001 SPEA, SPEA2
SPEA uses fitness assignment based on the principles of co-evolution and the niching technique founded on theconcept; SPEA2 is an improved version of the SPEA.
Heavy equipment design (Wei, Yang, Wang and Wang, 2009), water distribution systems (Kurek and Ostfeld, 2013), distributed power generation (Sheng et al., 2012), and dispatching of electrical network (Aribia et al., 2013).
1994, 2002 NSGA, NSGA-II
NSGA implements the non-dominated sorting and maintenance procedure to overcome the bias distribution of population as in VEGA; NSGA-II is an improved version of NSGA.
Automobile conformal antenna design (Kim and Walton, 2006), project scheduling (Ghoddousi et al., 2013), automatic test task scheduling (Lu et al., 2013), computer-communication networks (Lin and Yeh, 2012), and broadband reflector antenna satellite design (Bora et al., 2012).
2.1.2 Categories of MOEAs
According to Zhou et al. (2011), MOEAs can be grouped into six categories, i.e. decomposition-based, preference-decomposition-based, indicator-decomposition-based, hybrid-decomposition-based, memetic-decomposition-based, and co-evolution-based. The details are as follows:
In the first category, MOPs are decomposed into a set of single-objective sub-problems using a scalar function, and each sub-problem is weighted in an aggregated manner (Zhang and Li, 2007). Neighborhood relations among these sub-problems are defined based on the distances among the aggregated weight vectors. Each sub-problem is optimized using
infor-mation from its neighboring sub-problems.
The second MOEAs category is designed based on preference (Fonseca and Fleming, 1993). The rank of a population member is determined by both the concept and prefer-ence information, which are conducted using the "decide → search", "search→ decide", or "decide↔search" methods, from the decision makers.
The third category is indicator-based MOEAs (Zitzler et al., 2003; Zitzler and Künzli, 2004). The MOEA performance indicators are used within the evolution process to measure the quality of the resulting Pareto optimal set approximation. The theoretical foundations and practical implications of indicator-based MOEAs are reviewed in Auger et al. (2012). This category of MOEAs implicitly allows incorporation of preferences into the search process. The goal changes from optimizing a set of objective functions simultaneously to finding a set of solutions that maximizes the underlying performance indicators. This implies that the performance indicators co-exists with theconcept in the search process.
The fourth category is hybrid-based MOEAs (Zhou et al., 2011). Hybridization exploits the advantages of different MOEAs to deal with complicated MOPs. There are three types of hybridization strategies: (i) hybridizing different search method, (ii) hybridizing search and updating methods, and (iii) hybridizing different methods in different search phases. The first type combines global and local search methods, known as the memetic approach (Castro et al., 2013). It also uses the idea of combining the search operators of different algorithms (Liu, Jiang and Geng, 2013). The second type integrates different components from different algorithms, i.e. the PSO operator is inserted into the main loop of an EA (Elhossini et al., 2010). The third type is partitioned into three phases (Yang et al., 2009), i.e. to emphasize the dominated solutions, to balance dominated and non-dominated solutions, and to focus on non-dominated solutions, respectively. As an example, NSGA-II and a local incremental search algorithm are