2
Social interactions in customer churn decisions: The impact of relationship directionality
Michael Haenlein
The author would like to thank Barak Libai, Thomas Valente and Christophe Van den Bulte for their helpful comments and discussion.
========================================================== ARTICLE INFO
Article history:
First received in February 10, 2011 and was under review for 10 months.
Area Editor: Werner Reinartz Guest Editor: Marnik G. Demkimpe
============================================================
Professor Michael Haenlein is at the Marketing group at ESCP Europe, 79 Avenue de la République, F-75011 Paris, France, E-mail: [email protected]
Forthcoming
IJRM
Volume
3
Social interactions in customer churn decisions: The impact of relationship directionality
Abstract
The impact of social factors on individual-level decision making has been a subject of general interest within the marketing field. However, studies analyzing social interactions and social contagion have, to a great extent, focused on the importance of social interactions in the customer acquisition process and have relied on the use of undirected networks. Our study contributes to the literature stream by focusing on two elements that have been analyzed less frequently. Specifically, we focus on the importance of social interactions in the customer retention process within a directed social network. Using the customer base of a mobile phone provider, we rely on call detail records to investigate the churn behavior of 3,431 focal actors. We provide evidence for social interactions in customer churn decisions and show that, at any given point in time, a focal actor is significantly and substantially more likely to defect from a provider if other individuals to whom that actor is socially connected have previously defected from the provider. However, this effect is limited to social contacts with whom the focal actor has
outgoing calling relationships and who have churned relatively recently (in our sample, less than 5 weeks prior to the point in time that is under examination). We therefore provide empirical evidence demonstrating that social effects do play a role in customer retention but only when tie directionality and churn recency are taken into account.
Keywords: Customer retention, Social networks, Directed network, Undirected network, Stratified Cox Proportional Hazards model
Forthcoming
IJRM
Volume
4
Social interactions in customer churn decisions: The impact of relationship directionality
1. Introduction
Over the past decades, it has been widely accepted within the marketing field that
consumer behavior cannot be fully understood when individual actors are studied in isolation and that social factors play an important role in shaping individual-level decision making. This perspective is particularly prevalent in the analysis of customer acquisition strategies, specifically in the area of new product adoption. Studies in those contexts have argued that socially
influenced decisions occur in situations in which two or more actors make a purchase or
consumption decision jointly (Hartmann, 2010) or as a result of social contagion, i.e., following exposure to other consumers’ knowledge, attitudes or behaviors concerning a product (Iyengar, Van den Bulte, & Valente, 2011). Variables that measure the aspects of social exposure have therefore gained importance in models of innovation diffusion (Libai, Muller, & Peres, 2010; Nair, Manchanda, & Bhatia, 2010).
The vast majority of this research has focused on the importance of social interactions in the customer acquisition process and has relied on the use of undirected networks, i.e., networks that consider the connections between individuals without taking into account who initiates each connection. Our study contributes to the literature by looking at two elements that have been analyzed less frequently. Specifically, we investigate the importance of social interactions in the customer retention process within a directed social network, i.e., a network in which the initiator of each connection is identified. Our analysis uses the call history database of a mobile phone operator to analyze the social interactions in customer churn decisions. Specifically, we look at
Forthcoming
IJRM
Volume
5
situations in which two or more people who are socially connected decide to leave a company, either simultaneously or in close temporal proximity to one another. Our approach is consistent with a larger body of research that relies on electronically recorded communication patterns to approximate social relationships within a larger network (e.g., Goldenberg, Han, Lehmann, & Hong, 2009; Hill, Provost, & Volinsky, 2006; Nitzan & Libai, 2011; Trusov, Bucklin, & Pauwels, 2009). For our analysis, we used a directed network that allowed us to differentiate between the impact of churn among outgoing calling relationships (i.e., a focal actor calls another actor in the network or an alter) and among incoming calling relationships (i.e., an alter calls a focal actor).
Our results show that, at any given point in time, a focal actor is significantly and substantially more likely to defect from a provider if other individuals to whom that actor is socially connected have previously defected from the provider. However, this effect is limited to social contacts with whom the focal actor has outgoing calling relationships and who churned relatively recently (in our sample, less than 5 weeks prior to the point in time that is under examination).We also show that churn among a focal actor’s social contacts has a nonlinear effect on the hazard that the focal actor will defect as well; specifically, a focal actor’s hazard of defection increases quadratically with the number of recent churn events among his or her outgoing calling relationships.
2. Contribution compared to prior research
By focusing on the importance of social interactions in the customer retention process within a directed social network, our work provides the following two contributions compared to previously published work: First, prior marketing literature on the importance of social influence has focused extensively on customer acquisition, specifically on new product adoption (e.g.,
Forthcoming
IJRM
Volume
6
Rogers, 2003; Van den Bulte & Wuyts, 2007; Wuyts, Dekimpe, Gijsbrechts, & Pieters, 2010). Relatively few studies have looked at the impact of social networks on consumer behavior once customers have been acquired, i.e., behavior that is contingent on an initial product or brand choice decision. Some notable exceptions include the work of Haenlein (2011), who looks into the social network effects in post-acquisition product usage and customer-level revenue and Nitzan and Libai (2011), who analyze social contagion in the customer retention process.
The lack of research regarding social influence on customer retention is surprising, because customer acquisition and relationship initiation are only one part of a firm's CRM process (Reinartz, Krafft, & Hoyer, 2004), and the analysis of factors influencing retention, relationship duration, and customer churn is an active area of research (e.g., Bolton, 1998; Lemmens & Croux, 2006; Neslin, Gupta, Kamakura, Lu, & Mason, 2006; Schweidel, Fader, & Bradlow, 2008). In addition, studies that have been conducted outside of the marketing field provide clear indications that social effects play an important role not only in initiation but also in termination decisions. Medical research, for example, has highlighted the importance of social effects in the cessation of smoking (N. Christakis & Fowler, 2008) and of heroin and cocaine consumption (Buchanana & Latkina, 2008). Likewise, studies on human resource management have stressed the importance of communication networks in the context of collective turnover decisions (Bartunek, Huang, & Walsh, 2008; Castilla, 2005; Krackhardt & Porter, 1986). Similar effects have been found in studies of decisions regarding deserting the army (De Paula, 2009) and marriage dissolution (McDermott, Fowler, & Christakis, 2009). In light of these findings, it seems likely that social effects should also influence a customer's decision to remain loyal to a certain company, and, indeed, Nitzan and Libai (2011) have provided empirical evidence that this is the case. Our study continues this stream of research by providing further insight into the dynamics that underlie social influence in the customer retention process.
Forthcoming
IJRM
Volume
7
Second, we contribute to the prior literature by analyzing social influence within a directed (versus an undirected) network. Across a large range of disciplines, including
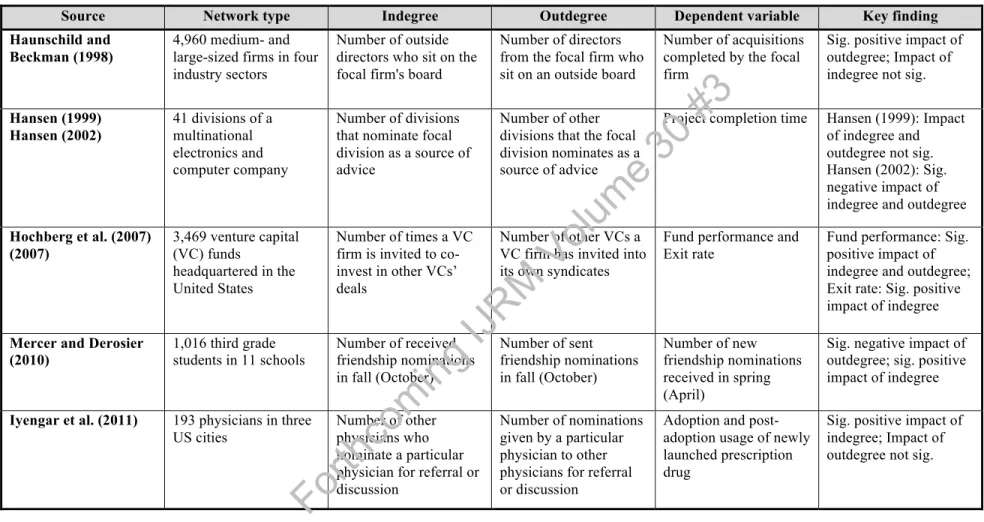
organizational science, finance, psychology and marketing, studies that analyze social networks have focused nearly exclusively on undirected networks. In marketing specifically, this is true for analytical (Zubcsek & Sarvary, 2011) and empirical research (Trusov, Bodapati, & Bucklin, 2010) and applies to social interactions in processes of customer acquisition (Nair, et al., 2010) as well as retention (Nitzan & Libai, 2011). In fact, an analysis of the journals that are covered in the EBSCO database reveals only a handful of articles that rely on directed social networks and that specifically compare the difference in influence between the number of incoming
connections (indegree) and the number of outgoing connections (outdegree). See Table 1 for an overview of these studies.
Insert Table 1 here
Interestingly, the studies that have focused on directed networks reveal that while the impact of incoming and outgoing relationships is comparable in some settings, it is not the case in all situations. This empirical finding can be explained by the fact that, depending on the situation, incoming and outgoing relationships can have fundamentally different meanings. For example, considering another person as a friend is not necessarily identical to being considered as a friend, and analyzing both types of relationships in the same manner carries the risk of confounding different effects. Empirical evidence for this finding can be found in Christakis and Fowler (2007), who analyze the spread of obesity within a social network and show that results differ depending on whether A perceives B as a friend, B perceives A as a friend, or both A and B perceive each other as friends.
An additional potential benefit of analyses that rely on directed networks is that they entail fewer identification issues and reflection biases compared with analyses of undirected
Forthcoming
IJRM
Volume
8
networks, and therefore they can provide stronger evidence for social contagion. Within an undirected network, it is sometimes difficult to establish whether correlation in behavior is due to social contagion or to other factors, such as endogenous group formation, correlated
unobservable variables or simultaneity (Manski, 1993; Moffitt, 2001). Within a directed network, it is possible to compare the impact of incoming versus outgoing relationships. If the two types of relationships differ, for example, in their influence on the time of adoption or time to churn, it can be seen as stronger evidence for social effects (Bramoulle, Djebbari, & Fortin, 2009). Christakis and Fowler (2007), for example, used this approach to rule out the possibility that the spread of obesity is driven by unobserved environmental factors rather than by social contagion. Our study builds on this line of thinking by comparing the differential effects of incoming versus outgoing relationships on the retention process.
3. Relationship directionality and social interactions in customer churn decisions The occurrence of social influence in customer churn decisions may stem from a variety of factors: On the one hand, the decision of a customer to leave her current supplier in response to the departure of one of her social contacts might be driven by economic or utilitarian
considerations, often resulting from naturally occurring or artificially induced network externality effects. In the context of the cellular phone industry, for example, which corresponds to our empirical setting, companies frequently charge different prices for in-network versus out-of-network traffic, and it has been shown that such differential pricing influences customers’ choices of supplier as well as their subsequent usage behavior (Gerpott, 2008; Hoernig, 2007; Staahl Gabrielsen & Vagstad, 2008). On the other hand, social influence in customer churn decisions might result from social factors. The churn of a friend can, for example, lead to the loss of certain social benefits that arise from patronizing the same company, which is consistent with what has
Forthcoming
IJRM
Volume
9
been discussed from the perspective of social enrichment (Fernandez, Castilla, & Moore, 2000; Schmitt, Skiera, & Van den Bulte, 2011) and balance theory (Krackhardt & Porter, 1985; Nitzan & Libai, 2011). In most real-life situations, economic and/or utilitarian factors and social factors can be expected to influence decision making simultaneously.
The use of a directed network to analyze social interactions in customer churn decisions can provide valuable insights regarding the drivers of such decisions. It seems likely that the impact of churn among incoming and outgoing calling relationships is not identical and that relationship directionality plays an important moderating role. Two arguments can be used to justify such thinking: First, churn among incoming versus outgoing calling relationships can be associated with different sets of economic and/or utilitarian and social consequences for the focal actor. Looking at the economic and/ or utilitarian reasons, a churn event among outgoing calling relationships can represent a financial burden for a focal actor, which may increase the hazard that the focal actor will defect. This is the case when the cellular service provider follows the “calling party pays” principle, according to which the mobile phone subscriber does not pay for incoming calls but only pays for outgoing calls (Valletti & Houpis, 2005) and when out-of-network calls are priced higher than in-out-of-network calls. In such a situation, the churn of a party from whom a focal actor receives only incoming calls has no financial consequences for the focal actor, as receiving calls does not generate any cost, regardless of whether those calls stem from within the provider’s network or from a competing network. The situation is different for outgoing calls, as a focal actor incurs higher costs following the churn of a person whom he or she calls, as communication is subsequently priced according to out-of-network fees rather than in-network fees, which are generally cheaper. 1
1 To test the difference in pricing between in-network and out-of-network calls in our sample, we performed a
regression analysis in which we explained the amount of money that was paid by a customer through the number of outgoing minutes that were spent in-network and out-of-network. Our results indicate that after taking account of a
Forthcoming
IJRM
Volume
10
Regarding the social factors, outgoing calling relationships are purposefully initiated by a focal actor. While people cannot necessarily control who calls them, they have full control over the calls that they place themselves. In placing a call to another person, a focal actor essentially signals that the person is "worth the effort" of a call (versus waiting until the other person calls of his or her own accord) and therefore might be more important to the focal actor compared with the social contacts from whom the focal actor only receives calls. Outgoing calling relationships therefore have a different meaning attached to them in comparison to incoming ones and
represent links to others who might have a more persuasive influence on the focal person (Hall & Valente, 2007). If this is indeed the case, a focal actor should be more likely to follow suit after the defection of an outgoing calling relationship as opposed to an incoming one.
Further, one should note that a directed network constitutes a more accurate
representation of reality compared with an undirected network. Many of the processes that underlie the formation of social networks are directional in nature. Networks of referral (Reingen & Kernan, 1986) or advice (Lazega & Duijn, 1997), for example, build on notions of status and prestige. These concepts are related to the number of incoming relationships or indegree, i.e., the number of people who seek information from A, but not the number of outgoing relationships or outdegree, i.e., the number of people from whom A seeks information (Iyengar, et al., 2011; Van den Bulte & Wuyts, 2007). Models that are designed to describe the formation of such networks, such as exponential random graph (p*) models (Holland & Leinhardt, 1981) or the Jackson-Rogers approach (Jackson & Jackson-Rogers, 2007) therefore take explicit account of the direction of a relationship. Transforming an inherently directed network into an undirected one involves the addition of certain links that have were not initially present (e.g., A→B becomes A‒B, which in turn is equivalent to A→B and B→A). This transformation represents a distortion of the
series of dummy variables that indicated service plan choice, out-of-network calls are 2 to 2.5 times more expensive than in-network calls.
Forthcoming
IJRM
Volume
11
underlying social network structure, which could bias subsequent analyses that are based on an undirected network.
4. Overview of the main constructs and variable definitions
Our study investigates social interactions in customer churn decisions in the context of the cellular phone industry and specifically the different affects of churn among incoming versus outgoing calling relationships. For the purpose of our analysis, we define churn as the
termination of an existing service agreement between a customer and his or her cellular phone company. Our analysis focuses only on customers who maintain a contractual service agreement with their cellular phone companies and, therefore, excludes non-contractual relationships (prepaid mobile phones). We differentiate between two types of churn – voluntary churn (i.e., cases in which the decision to terminate the service agreement is made by the customer) and involuntary churn (i.e., cases in which the decision is made by the cellular phone provider) – because different causes of churn have been shown to evolve differently over time (Braun & Schweidel, 2011).
We focus our analysis on situations in which two or more customers between whom there is a calling relationship—referred to herein as social contacts—decide to leave a company either simultaneously or in close temporal proximity to one another. We define three types of calling relationships: focal customer A receives calls from customer B (an incoming calling relationship for person A); focal customer A calls customer B (an outgoing calling relationship for person A); or customers A and B call each other (a mutual calling relationship for person A). The
relationship types are not mutually exclusive; e.g., two customers who have a mutual calling relationship with each other also have incoming and outgoing calling relationships with each other. We limit our analysis to first-order effects, i.e., relationships between a focal actor and the
Forthcoming
IJRM
Volume
12
other actors who either call or are called by the focal actor directly. Potential higher-order effects (e.g., the impact of churn of actor C in a calling relationship in which person A calls person B and person B calls person C) are beyond the scope of our analysis.
To operationalize the extent of churn among incoming and outgoing calling relationships, we used a two-step approach: First, we collected data on all of the incoming and outgoing calls that were made by a sample of focal actors over a two-month period (time period 1). Based on this information and following the work of Onnela et al. (2007) and Nitzan and Libai (2011), we define two types of tie strength, measuring the strength of the incoming or outgoing calling relationship between focal actor i and alter j, who is also a customer of the provider, as follows:
(1) (2)
The incoming (or outgoing) communication volume between focal actor i and alter j represents the total number of minutes that were spent by focal actor i on incoming calls from customer j (or on outgoing calls to customer j) within time period 1. The total incoming and outgoing communication volume for focal actor i is the total number of minutes of all of the calls that were placed or received by i within time period 1, including calls to and from the customers of the focal provider, customers of other cellular providers, and landlines. In the case of mutual calling relationships, we determine tie strength separately for the incoming and outgoing calling relationship components. The separate determination of tie strength allows us to disentangle the impact of the strength of the incoming relationship between focal actor A and customer B (i.e., the share of person B among all of the calls that were received by actor A) from that of the strength of the outgoing relationship between the two parties (i.e., the share of person B among all of the calls that were made by actor A).
Forthcoming
IJRM
Volume
13
We subsequently collected data on the churn behavior of all of the focal actors as well as on the other customers with whom they maintained incoming and/or outgoing calling
relationships over a second period of six months (time period 2). Based on this information, we determined two time-dependent variables for each focal actor that measure the cumulative impact of churn events that focal actor i was exposed to among his or her incoming and outgoing calling relationships, between the start of time period 2 (t0) and time t. These variables are defined in the following way:
(3) (4)
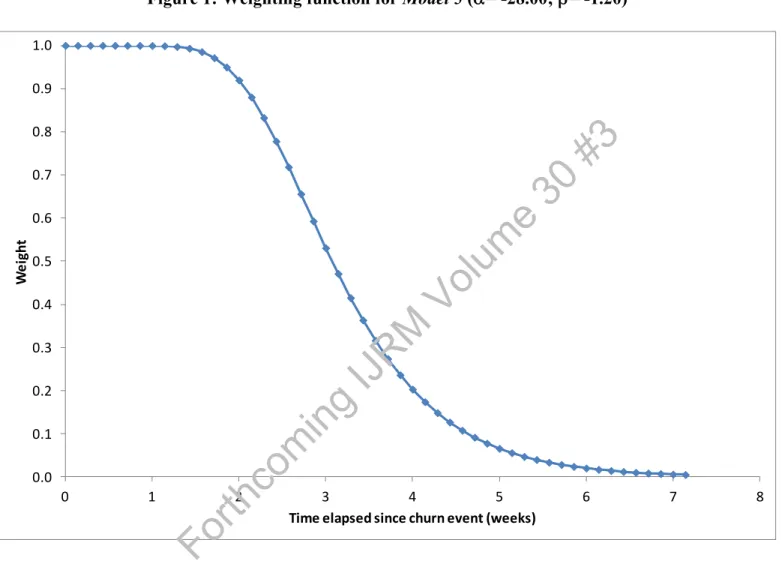
where cj is an indicator variable that equals one if customer j churned prior to or at t and zero otherwise; t_churnj is the time at which customer j churned; and w() (0 ≤ w() ≤ 1) is a weighting function that weights churn events according to the difference between t and t_churnj.
Our definition of sin, i (t) and sout, i (t) is based on two assumptions: First, we expect the impact of churn among incoming and outgoing calling relationships on focal actor churn to be stronger with increasing levels of tie strength. This assumption is consistent with the observation that individuals are more affected by others with whom they have closer relationships (Brown & Reingen, 1987). It is also consistent with the research on referral programs, which has shown that referral behavior among social contacts is influenced by tie strength (Ryu & Feick, 2007). We account for this effect in the definition of sin, i (t) and sout, i (t) by summing over the product of the churn indicator (cj) and the tie strength instead of simply summing over cj, which would be equivalent to weighting all of the churn events identically.
Second, we expect that churn events among incoming or outgoing calling relationships that happened a longer time ago should have a lesser impact on focal actor churn rates compared with churn events that occurred relatively recently. Such an assumption is consistent with the
Forthcoming
IJRM
Volume
14
observation that the effect of word-of-mouth decays exponentially over time for both customer acquisition (Strang & Tuma, 1993; Trusov, et al., 2009) and customer retention (Nitzan & Libai, 2011). This is reflected in equations 3 and 4 by requiring that the weighting function w()
decreases with an increase in the difference between t and t_churn j. Combined with the fact that w() should be bound between zero and one, this condition implies that w(0)=1 and
. For our analysis, we choose a weighting function that is based on the Gompertz function and that can accommodate a large variety of different shapes, ranging from the equal weighting of all churn events at one end to exponential decay at the other (see Appendix A for a more elaborate explanation):
(5) w with α, β < 0.
Using such a weighting function results in the following operationalization of sin, i (t) and sout, i (t): (6)
(7)
See Appendix B for a numerical example that illustrates the calculation of sin, i (t) and sout, i (t).
5. Research model
To test the extent to which churn among incoming and outgoing calling relationships influences focal actor churn, we estimated a stratified Cox Proportional Hazards model in which we included the two previously defined social impact measures, sin, i (t) and sout, i (t), as time-dependent covariates.
Hazard rate models are the method of choice when dealing with right-censored duration times (Helsen & Schmittlein, 1993). Taking account of potential censoring is particularly
Forthcoming
IJRM
Volume
15
important when analyzing social influence because truncation can trick researchers into believing that they have found evidence of social contagion when there is actually none (Van den Bulte & Iyengar, 2011). The dependent variable in a hazard model is the hazard rate h(t), which describes the conditional probability that an event (e.g., churn) will occur at time t, given that it did not occur prior to t:
(8) .
where f(t) and F(t) describe, respectively, the probability density function and the cumulative density function of the duration time process.
A (semi-parametric) Cox Proportional Hazards model (Cox, 1972) assumes that h(t| xit)— the hazard rate of an event at time t for actor i, who is characterized by a vector of covariates xit— can be expressed as the product of an unspecified baseline hazard function h0(t) at time t, which is identical for all individuals, and the relative risk or hazard ratio exp(γ xit). We use a variation on the traditional Cox Proportional Hazards model, the stratified Cox Proportional Hazards model (Lunn & McNeil, 1995; Wei, Lin, & Weissfeld, 1989), which allows for the incorporation of multiple unspecified baseline hazard functions, which are associated with different types of events. This model enables us to analyze the two competing risks of voluntary and involuntary churn separately, using the following functional form:
(9) ,
where j is an indicator variable that equals one when churn is voluntary and zero otherwise, and h1(t) and h2(t) are the baseline hazard functions for voluntary churn and involuntary churn, respectively.
As highlighted above, working with a directed network protects us to some extent from identification issues and reflection bias, which are a common problem in the analysis of social
Forthcoming
IJRM
Volume
16
influence (Manski, 1993; Moffitt, 2001). The inclusion of a non-parametric baseline hazard in our model also protects against identification issues (Lin & Wei, 1989)2. To minimize such issues even further, we include three types of control variables in our model: First, we account for the fact that people prefer to interact with others who are similar to themselves (i.e., homophily, see McPherson, Smith-Lovin, & Cook, 2001; Reagans, 2005), suggesting that people who share similar characteristics—and in particular similar consumption patterns—are more likely to be socially connected to one another. For this factor, we obtained information on actors’ observable characteristics, including basic demographics (i.e., age, gender, marital status) and
socio-demographics (i.e., membership in one of 13 socio-demographic groups), and included them as time-independent control variables in our model.
Second, we controlled for correlated unobservable variables that could cause similarities in behavior among social contacts. Several types of correlated unobservable variables have been discussed in the social network literature, including sales force activities (Nair, et al., 2010), advertising and detailing (Van den Bulte & Lilien, 2001) and (geographical) neighborhood effects (Moffitt, 2001). To control for bias that arises from correlated unobservable variables, we obtained information on the geographic location (ZIP-code) of each actor within our sample. Given that our sample included a substantial number of different ZIP-codes, we grouped adjacent codes into larger areas. We subsequently included a full set of area-specific fixed effects in our model to take account of the similarities in exposure to marketing efforts, network quality, preferences, and other effects that result from geographical proximity.
2 As has been discussed by Manski (1993) and Moffitt (2001), among others, the analysis of social contagion is
subject to a series of potential biases that are introduced by simultaneity (i.e., person A's actions affect person B's actions and vice versa), correlated unobservable variables (i.e., omitted variables that affect the actions of A and B) and endogenous tie formation (i.e., the formation of ties that are based on common behavior). As shown by Lin and Wei (1989), Cox Proportional Hazards models with a non-parametric baseline hazard provide robust parameter estimates, even if the model is misspecified. This finding implies that the inclusion of a non-parametric baseline hazard prevents these problems to some extent, including, specifically, the bias that is introduced due to omitted correlated unobservable variables.
Forthcoming
IJRM
Volume
17
Third, we take account of other factors that have traditionally been shown to influence individual-level churn behavior, specifically, acquisition channel and contract characteristics (i.e., service plan and contract duration3). Prior research has shown the influence of acquisition
channel on loyalty and cross-buying (Verhoef & Donkers, 2005), the interrelationship between current and future usage levels (Bolton & Lemon, 1999), and the duration-dependence of churn and retention rates (e.g., Fader & Hardie, 2007; Schweidel, et al., 2008). To account for the potential influence of these variables, we included an additional series of time-independent dummy variables that indicate acquisition channel and service plan choice. Contract duration was included as a time-dependent covariate and operationalized by the number of months that elapsed since the start of the contract.
The considerations that are outlined above lead to the following specification of the covariate vector xit that is included in equation 9:
(10) ,
where zi is a vector of time-independent control variables (comprising age, gender, marital status, socio-demographic group membership, geographical area, acquisition channel and service plan); di(t) is a time-dependent covariate that measures contract duration at time t; and sin, i (t) and sout, i (t) are the social impact measures that are defined above for churn among the incoming and outgoing calling relationships.
Note that equation 9 allows for a quadratic influence of the two social impact measures sin, i (t) and sout, i (t), which enables us to take account of potential nonlinearities in returns to scale of social influence. For example, a focal actor who experiences the churn of multiple social contacts might show super-additive effects (i.e., a combined effect that is larger than the sum of
3 Mobile phone providers (including the one we collaborated with) usually sell a wide range of different service
plans that represent contractual relationships of a fixed duration. Once a contract expires, the user has the option to subscribe to a new contract. Contract duration, which is the duration of the current contract, therefore differs from the total duration of the customer–company relationship (i.e., the time elapsed since acquisition).
Forthcoming
IJRM
Volume
18
the individual effects) if one loss reinforces and legitimizes the other, or sub-additive effects (i.e., a combined effect that is smaller than the sum of the individual effects) if each additional effect provides less incremental information than the previous one. Quadratic effects allow us to account for such mechanisms to a certain extent.
6. Data collection
Our study is integrated into a larger body of research that uses electronically recorded communication patterns to approximate social relationships within a larger network. The substantial effort that has traditionally been associated with collecting social network data (Reingen & Kernan, 1986), combined with the inherent measurement bias of self-reported information on social relationships (Feld & Carter, 2002), has motivated researchers to identify alternative data collection techniques for social network analysis. Recently, the use of large-scale databases has gained increasing popularity. Examples of applications in the marketing field include the work of Hill et al. (2006) and Goldenberg et al. (2009) in the area of new product adoption, as well as that of Trusov et al. (2009), who compared the effectiveness of word-of-mouth and traditional advertising. Our analysis follows this stream of research and, similarly to Nitzan and Libai (2011) and Haenlein (2011), uses the call history database of a cellular service provider to reconstruct the social network of a set of customers.
Specifically, our dataset stems from a mobile phone operator in a major European country and was collected between August 2006 and April 2007. In that period, there were five major mobile phone operators in this market, four (including our company) with market shares between 22% and 26% and one with a market share of 4%. The market is among the top ten markets for mobile phone services in Europe and can be considered to be very mature, with a penetration rate in excess of 100%. As is the case for most mobile phone operators in Europe, the billing scheme
Forthcoming
IJRM
Volume
19
that is applied by our company follows the “calling party pays” principle. This implies that the mobile phone subscriber does not pay for incoming calls and only pays for outgoing calls (Valletti & Houpis, 2005).
Our main data source was the customer database of the mobile phone operator, which includes basic information on each customer (e.g., acquisition date) and information on all of the incoming and outgoing calls that were made (i.e., calling party, calling time and call duration).4 Our first step in collecting the data was to select a random sample of customers from the
database. Because every customer can be uniquely identified by his or her mobile phone number, we generated a list of 1.25 million random numbers and matched them to the customer database. This process resulted in a random sample of 4,163 customers (100%). We then removed 424 customers from our dataset who had joined the cellular service after August 1, 2006 (the beginning of the data collection timeframe) and for whom, therefore, only partial information was available, which resulted in 3,739 customers (90%). Out of these 3,739 customers, 3,450 customers (83%) could be matched to a second database containing churn and revenue data, and of these, 3,431 customers (82%) could be matched to a third database that contains demographic data. For these 3,431 customers, we downloaded information about all of the incoming calls that were received and outgoing calls that were made (phone number and duration of call) over a two-month time period (August 1, 2006 to September 30,2006, time period 1). This information was subsequently used to define the incoming and outgoing calling relationships and to determine tie strength according to equations 1 and 2.
Our network, which represents the egocentric networks of the final sample of 3,431 focal actors, includes 19,668 nodes that are linked through 25,799 calling relationships, or ties. On
4 Note that while we know when each customer has been acquired (i.e., how long she or he has been a customer of
the mobile phone operator) and when the current contract the customer is subject to was established, we do not know how much time is left on the current contract. We return to this caveat when we discuss the limitations of our analysis.
Forthcoming
IJRM
Volume
20
average, over the course of time period 1, each focal actor maintained 1.07 exclusively incoming calling relationships (corresponding to alters who call the actor but whose calls are not
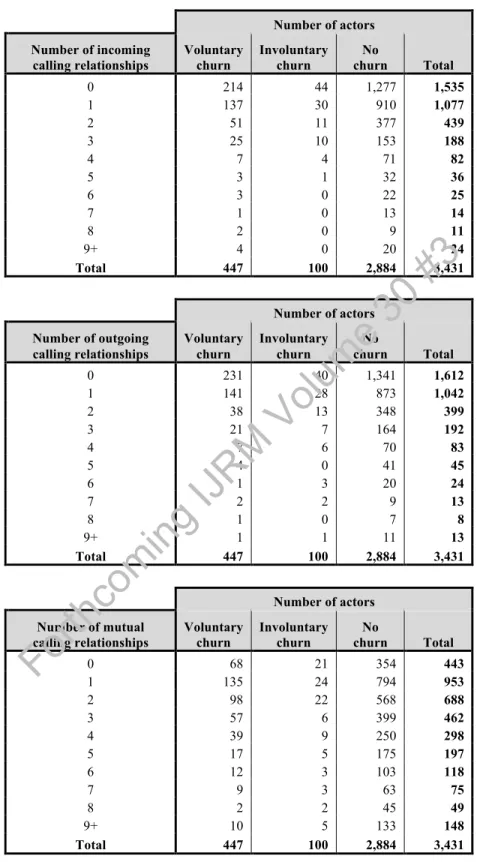
reciprocated), 1.01 exclusively outgoing calling relationships (corresponding to alters who are called by an actor but who do not reciprocate the call) and 2.72 mutual calling relationships (see Table 2 for a full distribution of the number of calling relationships per focal actor).5 The total number of calling relationships that were maintained by each focal actor is hence 4.8 (1.07 + 1.01 + 2.72). While this finding might appear to be relatively low, it should be noted that our analysis only covers calling relationships in which both partners are customers of the focal cellular service provider (a necessary condition that ensures our ability to evaluate the churn behavior of both parties). Tie strength ranges from a minimum of 0% to a maximum of 100% for both incoming and outgoing relationships. The average tie strength in our sample was 7.1% for incoming relationships and 4.2% for outgoing relationships.
Insert Table 2 here
A total of 547 focal actors churned between November 1, 2006, and April 30, 2007 (time period 2), which corresponds to a churn rate of 15.9% (the overall churn rate of the company during this period was approximately 15.5%). Approximately 80% (447) of these churn events were voluntary, and 20% (100) were involuntary; the majority of the latter (95) were terminations that were due to bad debt (i.e., non-payment of outstanding bills). Among the 3,431 focal actors, 1,213 (35.4%) had at least one social contact who churned within the observation period. Out of those, 155 focal customers subsequently churned themselves, which represents a total of 28.3% of all of the 547 focal actors who churned. In terms of descriptive statistics, the average age was 36.2 years for voluntary churners, 33.5 years for involuntary churners, 38.9 years for
5 In total, we observed 3,674 exclusively incoming calling relationships, 3,475 exclusively outgoing calling
relationships and 9,325 mutual calling relationships. The total number of ties (25,799) was equal to the total number of incoming ties (3674 + 9325 = 12999) plus the total number of outgoing ties (3475 + 9325 = 12800).
Forthcoming
IJRM
Volume
21
churners and 38.4 years overall. The average contract duration was 1.4 years (504 days) for voluntary churners, 0.9 years (326 days) for involuntary churners, 1.4 years (500 days) for non-churners and 1.4 years (495 days) overall. The average duration of staying with the company (i.e., time elapsed since acquisition) was 2.3 years (858 days) for voluntary churners, 1.8 years (651 days) for involuntary churners, 4.2 years (1,535 days) for non-churners and 3.9 years (1,421 days) overall. A full list of descriptive sample statistics can be found in the Web Appendix.
7. Estimation results
We estimated the model that is specified in equations 1–2, 6–7 and 9–10 using the survival package (Version 2.35-4) within the R computing environment (Version 2.12.1).
Specifically, we encapsulated the likelihood of the stratified Cox Proportional Hazards model in a constrained optimization algorithm to identify optimal values for α and β (α, β < 0) that result in maximum likelihood, given an estimation of γ contingent on α and β. The optimization algorithm that was used is a limited-memory modification of the BFGS quasi-Newton method.
Insert Table 3 here
7.1 Model comparison
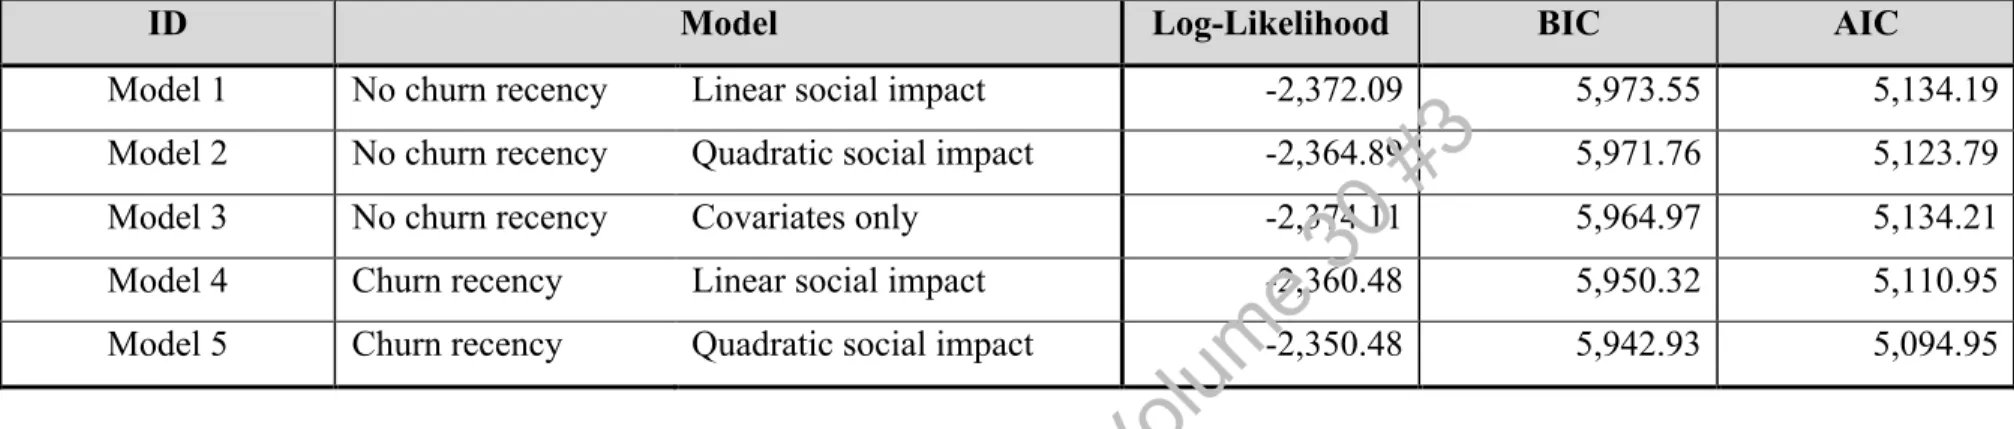
We specified and compared five different models (elaborated in Table 3). Model 1 (Model 2) incorporates no-churn recency and assumes that the two social impact measures influence the hazard of churn in a linear (quadratic) way; Model 3 is a baseline model that includes only the covariates without any consideration of social impact measures; Model 4 and Model 5 mirror Model 1 and Model 2 but allow for churn recency effects. Table 3 shows the fit of our final model (Model 5), as well as of the rival model specifications. Model fit was measured by the Bayesian
Forthcoming
IJRM
Volume
22
information criterion (BIC) and by the Akaike information criterion (AIC). Two findings are of particular interest:
First, models that take churn recency into account (Model 4 and Model 5), i.e., which weight churn events differently depending on how long ago they occurred, show better fit than models that do not (Models 1-2). Interestingly, when churn recency is not explicitly accounted for, a model without any social impact measures (Model 3) fits the data better than one that takes churn into account among incoming and outgoing calling relationships (Models 1-2). This
surprising result can be explained as follows: As we will show later, only churn events that occur within a relatively small window of time are significantly related to focal actor churn.
Considering all churn events to be independent of their recency therefore introduces a substantial amount of noise into the calculation of the social impact measures. Our results show that the inclusion of these noisy variables into the model deteriorates model fit instead of improving it.
Second, once churn recency is taken into account, the inclusion of churn among incoming and outgoing relationships does improve model fit. This finding implies that, in line with our basic hypothesis, social interactions affect customer churn decisions. The best-fitting model is Model 5, which includes the two social impact measures in quadratic form. This finding implies that the influence of social impact measures on focal actor churn is nonlinear. Model 5 has the lowest BIC and AIC of all of the models and, as indicated by an analysis of deviance, it represents a significant improvement compared to both Model 3 and Model 4.6
Insert Figure 1 here
7.2 Churn recency
6 The χ2 difference (-2 x Difference in LL) between Model 3 and Model 4 is 27.26, and the χ2 difference between
Model 4 and Model 5 is 20.00.
Forthcoming
IJRM
Volume
23
The optimal values for the weighting function that result in maximum likelihood for the stratified Cox Proportional Hazards model are α= −28.00 and β= −1.20. Figure 1 illustrates the shape of the weighting function that corresponds to these two values. The churn events that occurred less than two weeks prior to t are accounted for nearly to their full extent in the calculation of sin, i (t) and sout, i (t) (w > 0.90), while the churn events that happened more than five weeks prior to t have essentially no impact (w < 0.10). Between these two extreme values, the weighting function follows a sigmoid shape, which is characteristic of the Gompertz function. From a managerial perspective, this finding implies that once a churn event has occurred, a company has a very small window in which it can attempt to prevent churn among the defecting customer’s social contacts. We will come back to this point in our discussion section.
Insert Table 4 here
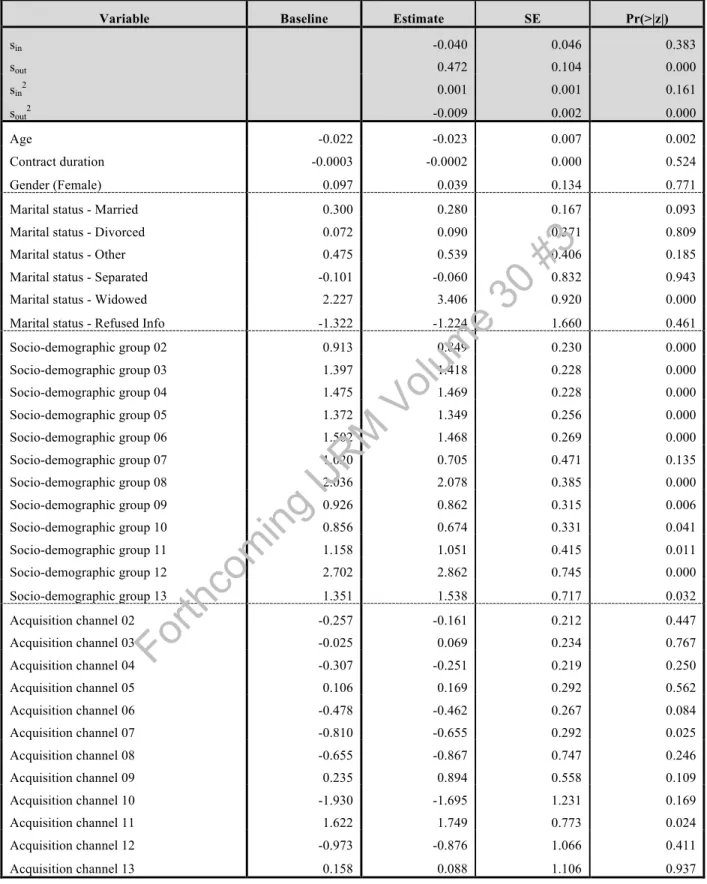
7.3 Parameter estimates – Control variables
Table 4 provides the detailed results for Model 5, i.e., parameter estimates, standard errors and p-values, as well as the parameter estimates for a baseline model without social effects (Model 3) for comparison. Looking at the demographic control variables, we see, on the one hand, that age is significantly negatively related to churn (−0.02). This implies that customers become less likely to churn with increasing age, which is consistent with prior literature on the impact of age on repeat buying (Lambert-Pandraud & Laurent, 2010; Lambert-Pandraud, Laurent, &
Lapersonne, 2005). On the other hand we observe that widowed customers are more likely to churn (3.41). Because these customers tend to be older (the mean age among widowed customers is 63.25 years, ranging between 51 and 83), this might be seen as a contradiction to the previous finding. However, because prior research has highlighted that elderly people are more vulnerable to fraudulent and unethical marketing practices (Yoon et al., 2005), it is conceivable that the
Forthcoming
IJRM
Volume
24
relationship between age and loyalty might not be linear but an inverse U-shaped one. Our empirical findings support this notion.
With respect to socio-demographics, we see that, with one exception (Group 07), all of the variables that indicate socio-demographic group membership are significantly positively correlated with churn propensity. Group 12 has the highest coefficient (2.86) and corresponds to customers for whom socio-demographic group information is not available ("unclassified"). The second-highest coefficient (2.08) corresponds to Group 08, which represents pensioners with an active lifestyle and an above-average income. Again, this finding shows that customers with a relatively high age tend to be more likely to churn than other types of clients, which is consistent with our previous results.
Finally, regarding acquisition process characteristics, one can see that two out of twelve dummy variables for the acquisition channel are significant. Channel 07 corresponds to retail outlets that are directly maintained and owned by the cellular service provider itself. The negative coefficient (−0.65) implies that customers that are acquired directly have a lower-than-average likelihood of churning. Channel 11 represents an internal channel that handles customers who have already threatened to leave a company in the past. The significant positive coefficient that is associated with this channel (1.75) shows that customers who have been retained using special means tend to be less loyal in the long run than other types of clients.
7.4 Parameter estimates – Social impact measures
Looking at the main variables of interest for our study, the impact of churn among incoming and outgoing calling relationships, two points are particularly noteworthy: First, while the two impact measures that are related to churn among outgoing calling relationships influence focal actor churn significantly (p-value ≤ 0.00005), the two impact measures that are related to churn among
Forthcoming
IJRM
Volume
25
incoming calling relationships do not (p-value ≥ 0.16). This finding implies that, consistent with our theoretical expectations, the direction of the calling relationship matters because only churn among outgoing calling relationships influences the hazard of churn for the focal actor. The fact that we observed different results depending on relationship directionality supports the
assumption that the significance of social impact measures is unlikely to be caused by confounds such as endogenous group formation, correlated unobservable variables and simultaneity
(Manski, 1993; Moffitt, 2001) and provides an empirical indication for the presence of social contagion effects.
Second, churn among outgoing calling relationships influences the hazard of churn for the focal actor in a nonlinear way. For low levels of sout, i (t), a focal customer’s hazard of defection increases with increasing numbers of defections among the social contacts with whom he or she has outgoing calling relationships. For example, a focal actor who experiences the churn of an outgoing calling relationship with a recency-weighted tie strength of 1% (or, alternatively, of multiple outgoing calling relationships with a total tie strength that is equal to 1%) has a hazard rate that is approximately 1.6 times larger than that of a customer who was not exposed to churn among outgoing calling relationships. If, however, churn among outgoing calling relationships increases from 1% to 2%, this ratio increases from 1.6 to 2.5.7
To better interpret these results, it is interesting to contrast them to a model without social influence. The parameter estimates for such a model (Model 3) are shown in the first column of Table 4. As observed, a model without social effects results in very similar parameter estimates
7 The change in the hazard rate that is associated with a certain value of recency-weighted s
out, i can be determined as:
exp (0.4715 × sout, i - 0.0087 × sout, i2). It should be noted that the increase in the hazard of defection with increasing
levels of churn among outgoing calling relationships is only true for low levels of recency-weighted sout, i up to a
maximum value of 27.0%. Beyond that point, the hazard of defection decreases with increasing levels of churn among outgoing calling relationships. That said, recency-weighted churn among outgoing calling relationships ranges from a minimum of 0% to a maximum of 100% in our analysis sample, with a mean of 1.05% over all observations and a mean of 3.91% for all cases in which recency-weighted sout, i is larger than zero. The results for
high levels of recency-weighted churn among outgoing calling relationships therefore need to be interpreted with caution.
Forthcoming
IJRM
Volume
26
for all of the other variables than one that includes social effects. All of the coefficients have the same sign (with the exception of acquisition channel 3, a variable that is not significant in both models) and are of comparable orders of magnitude. Looking at the parameter estimates of Model 3 also helps to interpret the change in the hazard ratio that is associated with a certain social effect. For example, we see that the churn of an outgoing calling relationship with a recency-weighted tie strength of 2% (which is equal to 2.5, as discussed above) corresponds to a change in age of approximately 40 years8. This finding shows that, at least in our sample, social effects have a considerable impact on the hazard of churn.
8. Robustness checks
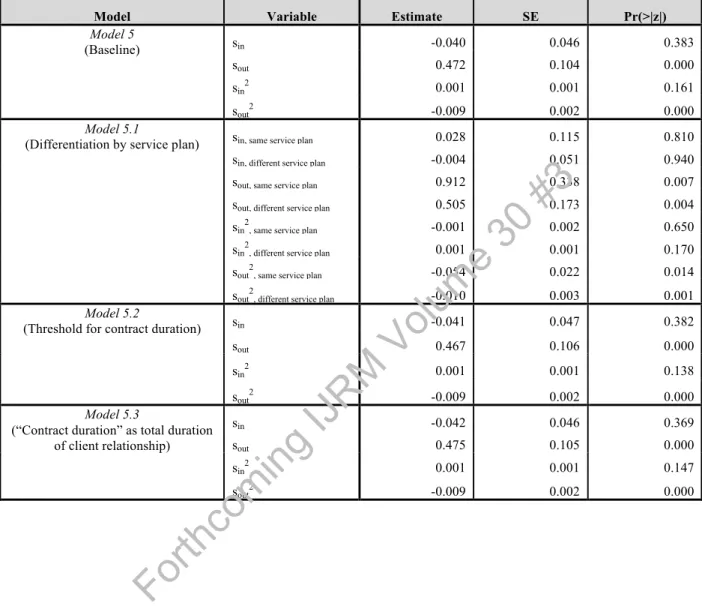
Given the significant difference we observed in the impact of churn among incoming versus outgoing calling relationships, it is conceivable that other factors in addition to relationship directionality influence the importance of certain churn events. To test for such effects, we estimated three variations of Model 5 in which we classified incoming and outgoing calling relationships based on whether the two relationship partners (a) share the same service plan, (b) share the same acquisition channel or (c) share the same ZIP code. An analysis of deviance for the three alternative models on four degrees of freedom (df; each model includes four additional parameters) results in χ2 values of 9.8 for service plan, 2.3 for acquisition channel and 6.5 for ZIP code.9 This shows that two of these three alternative models (those that classify relationships according to same or different acquisition channel or ZIP code) yield no significant improvement over Model 5. The improvement of the fit of the third model (classifying
relationships according to same or different service plan) is significant with a p-value of 4.42%. Insert Table 5 here
8 Calculated as ln (2.5)/0.0223 9 The critical χ2 value at 4 df is 9.49.
Forthcoming
IJRM
Volume
27
Table 5 shows the estimation results for the eight social impact measures (sin and sout for same and different service plan in both linear and quadratic form) for a model in which
relationships are distinguished according to service plan (Model 5.1). As observed, our
substantive conclusions also hold in this model: churn among incoming calling relationships has no significant impact on focal actor churn, while churn among outgoing calling relationships impacts focal actor churn significantly.
We also tested a variation of Model 5, in which we differentiated social impact measures that were based on alter churn type (voluntary versus involuntary), which allowed us to test for differences regarding these two types of churn in the parameter estimates in addition to the unspecified baseline hazard function. This alternative specification did not improve model fit significantly (χ2 difference of 5.8 on 4 df).
It is interesting to note that the time-dependent covariate "contract duration" is not significantly related to the hazard of churn within Model 5 (p-value: 0.5238).10 This finding might seem surprising and could be considered as an indication of a confounding effect between contract duration and the social impact measures: Assume a focal customer who, once acquired, does not subscribe to a new contract and who experiences churn within her social network early in the company relationship. For this client, contract duration would increase over time (because the contract is not renewed, contract duration essentially measures the duration of the company-client relationship). At the same time, the two social impact measures would decrease over time due to decreasing churn recency over time. This finding makes it conceivable that the effects of the two variables on the hazard rate cancel each other out, leading the contract duration variable to appear insignificant in our preferred model.11
10 In fact, contract duration is not a significant predictor in any of the models that are shown in Table 3 (p-values
equal to or above 0.30).
11 We thank an anonymous reviewer for having pointed this out.
Forthcoming
IJRM
Volume
28
To test for such a confounding effect, we conducted a series of additional robustness checks: First we tested whether contract duration shows threshold effects in the sense that its impact on the hazard of churn is different when contract duration is above or below a certain threshold. In total we tested 100 different thresholds that ranged from a minimum of 5 to a maximum of 500 days. The specification that improved fit most substantially was a model with a threshold at 205 days (χ2 difference compared to Model 5 of 9.46 on 1 df, p-value: 0.0021,
hereafter referred to as Model 5.2). In this model, contract duration influences the hazard of churn positively (coefficient: 0.0062) when it is below the threshold of 205 days (p-value: 0.0027) and is otherwise insignificant (p-value: 0.7627). As shown in Table 5, this specification does not affect our substantive conclusions regarding the two social impact measures, sin and sout.
Second, we performed the same threshold test in a model without social impact measures. The results were very similar to those of the first threshold test: The specification that yielded the highest improvement in model fit was a model with a threshold at 205 days (χ2 difference
compared to Model 3 of 10.15 on 1 df, p-value: 0.0014). Within this model, contract duration influences the hazard of churn positively (coefficient: 0.0062) when it was below the threshold of 205 days (p-value: 0.0023) and was not significant otherwise. The fact that the result regarding contract duration was identical in models with and without social impact measures makes the presence of any confounding effects unlikely.
Finally, we estimated a variation of Model 5 using a different specification of the contract duration variable. In the original specification of Model 5, we operationalized contract duration as the duration of the current contract. This measure was potentially subject to substantial, discrete shifts because contract duration increases steadily until a new contract is signed, and the measure falls back to zero. To test the extent to which these discrete shifts create problems in the
parameter estimation process, we estimated an alternative model (Model 5.3) in which we defined
Forthcoming
IJRM
Volume
29
contract duration as the total duration of the customer-company relationship (i.e., time elapsed since acquisition). As observed in Table 5, this again did not affect our substantive conclusions regarding sin and sout.
9. Discussion 9.1 Theoretical implications
In terms of contribution to theory, our results provide three important theoretical implications: First, consistent with the work of Nitzan and Libai (2011), we find an empirical indication for social interactions in customer churn decisions. Churn of customers with whom a focal actor maintains outgoing calling relationships has a significant and substantial impact on the hazard of churn of the focal actor. The fact that we used a model that takes account of network
directionality and includes controls for homophily, correlated unobservable variables, and the characteristics of the acquisition process and contract reduces the likelihood that our findings are caused by spurious effects and provides an indication for the presence of social contagion rather than a simple correlation in observed behavior. Our results therefore confirm that social network effects, which have previously mainly been discussed in the context of customer acquisition, are also present in the case of customer retention and hence remain important even after customers have been acquired. Specifically, they imply that individual-level retention rates and customer lifetime have a certain degree of positive network autocorrelation.
Second, our work provides insight into the dynamics that underlie social influence in customer retention by showing that a focal actor’s likelihood of churn is differentially influenced by churn among his or her social contacts and that this influence is dependent on relationship directionality and churn recency. Specifically, we show that only churn events among outgoing calling relationships are related to focal actor churn and that these events affect an actor’s
Forthcoming
IJRM
Volume
30
likelihood of churning at a given time only if they occurred within a short period (in our sample, less than five weeks) prior to that time. If churn recency is not explicitly accounted for, then churn among a focal actor’s social relationships does not have a significant impact on the likelihood that the focal actor will churn. Furthermore, the influence of churn among social relationships on the hazard of churn for a focal actor is nonlinear in the sense that the hazard of defection increases quadratically with increasing numbers of recent churn events among outgoing calling relationships.
Combined, these results allow us to speculate about the drivers behind social influence processes, which are very often difficult or even impossible to distinguish empirically (DiMaggio & Powell, 1983; Van den Bulte & Lilien, 2001). For example, one possible interpretation of our findings is that customers simply try to minimize cost and therefore base their retention decisions on churn among their social relationships. Because within our example only outgoing calling relationships represent a cost for a focal actor (due to the “calling party pays” principle), high levels of churn among these relationships provide an incentive for defection to minimize the share of expensive out-of-network calls.12 However, while such an interpretation can explain the importance of churn among outgoing versus incoming calling relationships, it is not consistent with the importance of churn recency that we observed in our sample. Given that the accumulated cost for out-of-network calls increases with the amount of time that elapsed since the churn of a social contact, we would expect that churn events among outgoing calling relationships that happened longer ago should have the same, if not a higher, impact on focal actor churn than recent events. Instead, we observed the opposite result in our sample. This decay of social influence is consistent with the previous research on the exponential decay of word-of-mouth effects over time (Strang & Tuma, 1993; Trusov, et al., 2009). This finding implies that our
12 We thank an anonymous reviewer for having provided this explanation.
Forthcoming
IJRM
Volume
31
results are more consistent with an interpretation of social contagion than of simple cost minimization.
Third, our finding that relationship directionality plays an important role in determining the likelihood that a focal actor will churn following the churn of his or her peers also has implications for other research contexts that make use of electronically recorded data on social relationships. Researchers increasingly use data from email networks (Kossinets & Watts, 2006), internet communities (Grabowski, 2007), social networking sites (Trusov, et al., 2009) and call detail records (Eagle, Pentland, & Lazer, 2009; Onnela, et al., 2007; Palla, Barabasi, & Vicsek, 2007) to reconstruct social networks. Some of these studies have resulted in surprising and sometimes counterintuitive findings, for example on the importance of strong versus weak ties (Onnela, et al., 2007) or the degree of overlap between observational data from mobile phones and self-reported survey data (Eagle, et al., 2009). The same is true for certain simulation studies that have relied on undirected networks and provided results that contradict commonly held beliefs (Watts & Dodds, 2007). Given that ties of different direction might have different
importance for social processes, it is conceivable that these counterintuitive results may in part be driven by the use of undirected rather than directed networks. We therefore encourage
researchers to take tie directionality into account in both empirical and simulation work,
especially when relying on electronic tie data. If possible, researchers should prefer directed data over undirected data.
9.2 Managerial implications
From a managerial viewpoint, our analysis indicates that monitoring churn within the social network of a customer and specifically among outgoing relationships can provide useful information in the context of churn prediction and proactive churn management. As shown by
Forthcoming
IJRM
Volume
32
Neslin et al. (2006), even a small improvement in the accuracy of churn prediction models can be associated with substantial financial gains for companies. Especially in the telecommunications industry, where customer churn has been shown to be a major cost item and where information on social relationships can be obtained easily through the analysis of call detail records,
calculating the impact measures of social network churn is likely to be particularly beneficial. That said, the high importance of churn recency that we observed in our sample implies that, following a customer’s churn, companies only have a very small window in which they can attempt to prevent subsequent churn among the defecting customer’s social contacts. Therefore, in many situations it might not be wise to wait until churn among social contacts actually occurs because at that point proactive churn prevention techniques might no longer be feasible. Instead, it seems more advisable to include the positive autocorrelation among individual-level lifetimes and churn propensities that we observe in our analysis within the churn prediction model itself to allow for more accurate predictions. Information on the estimated churn propensity of one customer could constitute additional input towards estimating the churn propensity of another client. Linear network autocorrelation models have previously been used in social network analysis to account for and measure social contagion effects (e.g., Leenders, 2002). Recent advances in spatial modeling now also allow the inclusion of network autocorrelation in logit models, which are frequently used to predict churn propensities (Carl & Kuehn, 2007; Dow, 2008).
9.3 Methodological contribution
In addition to these theoretical and managerial implications, our work also provides a
methodological contribution by proposing an approach to incorporate continuous recency effects into Cox Proportional Hazards models. The usual approach to account for recency in
Forthcoming
IJRM
Volume
33
nonparametric survival models has been to work with lagged variables as was done, for example, by Nitzan and Libai (2011). This technique, however, only tests for differences at discrete time points and does not allow a continuous recency effect to be included in the model estimation. Our approach, which uses a continuous weight function to weight churn events according to recency, overcomes this limitation.
9.4 Future research
With respect to areas of future research, we see three questions of particular importance: First, in some calling relationships, for example among spouses or other family members, the relationship partners might actively try to balance economic costs between each other by offering to terminate a call and to call the other person back. Such actions, if they occur, would represent a distortion of our measure of relationship directionality, especially in the case of mutual calling
relationships. One way to assess the extent of bias that this distortion creates would be to test the robustness of our results when excluding calling relationships that belong to the same family or household. Another option would be to consider other measures (e.g., qualitative assessments) that characterize the type of relationship in addition to tie strength and relationship directionality. Additionally, as highlighted above, while we know the acquisition date and contract duration of each customer, we do not know how much time is left on the current contract. It is therefore conceivable that this missing information could be confounded with the social impact measures that we include in our analysis. If possible, future studies should correct for this potential bias by considering the remaining contract duration explicitly in the model. In sum, these modifications would increase confidence in our results and also allow further insight to be provided into the relative importance of certain types of relationships in driving focal actor churn decisions.
Forthcoming
IJRM
Volume
34
Second, future studies could combine our finding of social network effects in individual-level churn behavior with recent evidence on social network effects in customer-individual-level revenue (Haenlein, 2011), to provide insight into the extent of network autocorrelation in customer lifetime value. Customer lifetime value is a measure of the cumulative discounted profit that a customer generates over his or her lifetime. Given that individual-level churn behavior, customer lifetime and individual-level revenue are all subject to positive network autocorrelation, it can be expected that similar autocorrelation will be observed—possibly to an even greater extent—in customer lifetime value. Assessing the extent of this autocorrelation would provide valuable insights for customer relationship management and for managing the customer base as a whole versus on an individual basis. Traditional approaches to calculating customer lifetime value (e.g., Berger & Nasr, 1998; Fader, Hardie, & Lee, 2005) or agent-based models such as stochastic cellular automata (Goldenberg, Libai, & Muller, 2001) could be applied in this context.
Third, in recent years, research on social influence in customer acquisition has started to move from providing evidence that social contagion exists to giving explanations on why it occurs (Iyengar, Van den Bulte, & Choi, 2012). The literature has discussed several causal mechanisms of social influence, including information transfer, normative pressures, competitive concerns and performance network effects (Van den Bulte & Lilien, 2001). Applied to social interactions in customer churn decisions, this finding implies that different causal mechanisms might operate in parallel and explain the findings we observed. For example, following the churn of a social contact, a focal actor might be more likely to churn because she or he becomes aware of a more attractive offer (information transfer), becomes concerned that remaining with the old provider may result in status disadvantages (normative pressures), or seeks to reduce the costs that are incurred as a result of the differential pricing of in-network and out-of-network calls (performance network effects). A more detailed investigation of the mechanisms through which
Forthcoming
IJRM
Volume
35
social contagion occurs will provide insights into the importance of each of these drivers, which could then be used for proactive churn management actions.
Forthcoming
IJRM
Volume
47
References
Bartunek, J. M., Huang, Z., & Walsh, I. J. (2008). The Development of a Process Model of Collective Turnover. Human Relations, 61(1), 5 - 38.
Berger, P. D., & Nasr, N. I. (1998). Customer Lifetime Value: Marketing Models and Applications. Journal of Interactive Marketing, 12(1), 17 - 30.
Bolton, R. N. (1998). A Dynamic Model of the Duration of the Customer's Relationship with a Continuous Service Provider: The Role of Satisfaction. Marketing Science, 17(1), 45 - 65. Bolton, R. N., & Lemon, K. N. (1999). A Dynamic Model of Customer's Usage of Services:
Usage as an Antecedent and Consequence of Satisfaction. Journal of Marketing Research, 36(2), 171 - 186.
Bramoulle, Y., Djebbari, H., & Fortin, B. (2009). Identification of Peer Effects through Social Networks. Journal of Econometrics, 150(1), 41 - 55.
Braun, M., & Schweidel, D. A. (2011). Modeling Customer Lifetimes with Multiple Causes of Churn. Marketing Science, 30(5), 881 - 902.
Brown, J. J., & Reingen, P. H. (1987). Social Ties and Word-of-Mouth Referral Behavior.
Journal of Consumer Research, 14(3), 350 - 362.
Buchanana, A. S., & Latkina, C. A. (2008). Drug use in the social networks of heroin and cocaine users before and after drug cessation. Drug and Alcohol Dependence, 96(3), 286 - 289. Carl, G., & Kuehn, I. (2007). Analyzing spatial autocorrelation in species distributions using
Gaussian and logit models. Ecological Modelling, 207(2-4), 159 - 170.
Castilla, E. J. (2005). Social networks and employee performance in a call center. American journal of sociology, 110(5), 1243 - 1283.
Christakis, N., & Fowler, J. H. (2008). The collective dynamics of smoking in a large social network. The New England journal of medicine, 358(21), 2249 - 2258.
Christakis, N. A., & Fowler, J. H. (2007). The spread of obesity in a large social network over 32 years. The New England journal of medicine, 357(4), 370 - 379.
Cox, D. R. (1972). Regression models and life-tables. Journal of the Royal statistical society: Series B (Methodological), 34(2), 187 - 220.
De Paula, A. (2009). Inference in a synchronization game with social interactions. Journal of econometrics, 148(1), 56 - 71.