AIS Electronic Library (AISeL)
AIS Electronic Library (AISeL)
ICEB 2007 Proceedings International Conference on Electronic Business (ICEB) Winter 12-2-2007
Applying Data Classification Techniques for Churn Prediction in
Applying Data Classification Techniques for Churn Prediction in
Retailing
Retailing
Russell K.H. Ching Liewen Cheng Sheng-Fu Ni Jashen ChenFollow this and additional works at: https://aisel.aisnet.org/iceb2007
This material is brought to you by the International Conference on Electronic Business (ICEB) at AIS Electronic Library (AISeL). It has been accepted for inclusion in ICEB 2007 Proceedings by an authorized administrator of AIS Electronic Library (AISeL). For more information, please contact [email protected].
Proceedings of The Seventh International Conference on Electronic Business, Taipei, Taiwan, December 2-6, 2007, pp.35-41.
APPLYING DATA CLASSIFICATION TECHNIQUES FOR CHURN PREDICTION IN
RETAILING
Russell K.H. Ching, California State University at Sacramento, USA, [email protected]
Liewen Cheng, Ta Hwa Institute of Technology, [email protected]
Sheng-Fu Ni, Yuan Ze University, Taiwan, [email protected]
Ja-Shen Chen, Yuan Ze University, Taiwan, [email protected]
ABSTRACT
Acquiring new customers and retaining loyal customers have been two important tasks for retailers. One critical issue to retain loyal customers is to know the customers well so that the retailers can provide the right products, do the right promotions and maintain customers from switching away to competitors, i.e. churn. In this study, we investigated the partial churners’ behaviors by (1) identifying key churn predictors, (2) establishing a churn prediction procedure, and (3) applying classification techniques to detect the possible partial churners. Further, the performance of each classification technique was examined and evaluated. We adapted and modified a two-year period customer and transaction data from a retailer to verify our proposed approach. Discussion and managerial implications are provided at the end.
Key Wards:Churn prediction; partial churner, data classification, retailing
INTRODUCTION
While facing fierce global competition and fast Internet technology development, the retail environment and practices have been changed dramatically. Retailers not only need to provide the best products and services to their customers but also need to seek ways to acquiring new customers and retaining loyal customers. As many researches have indicated that retailers could benefit from large-sized customer bases and a high customer retention rates (e.g., Reichheld and Sasser, 1990[26]; Bhattacharya, 1998[2]; Ganesh, Arnold, and Reynolds, 2000[10]), it has become critical to keeping customers from defecting to competitors. Customer churn (i.e., defection) rates reported in several primary UK consumer industries have increased from 16.9% in 2003 to 19.1% in 2005, and the average customer churn rate in retailing is at 19.8% per year (Group 1, 2005). Churn is a critical problem in retailing that an AC Nielsen’s report (2001) indicated that more than 70% of customers shopped on two or more supermarkets in a month period. Also, on average, retailers in US lose half of their customers every five years (Reichheld, 1996[25]). One issue to study churners is to know well their behaviors and shopping patterns. We need to know who the churners are, and the similarities and general patterns of these churners. By identifying which customers are possible defected that would allow the company to provide incentives to keep these possible churners. At practice, large-sized retailers usually have built databases to store product data, transaction data, and customer data with some semi-structured warehouses for marketing campaign uses. However, many companies don’t make a great use of these data warehouses. Most of the marketing campaigns are for mass-marketing promotions but not for micro campaign use, i.e., event-driven marketing. Hence, even though companies have constantly provided lots of discount and promotion campaigns to attract new customers, the promotion benefits are limited. It is mainly because that they don’t know their customers well and don’t try to make best uses of the customer data.
Although churn issue has been researched in several domains, it is still under-researched for retailing and, besides, most of the studies only consider total defection but not partial defection. Thus, in this study, we try to identify partial churners’ behaviors and patterns and then to retain all customers and loyal customers by gaining possible churners back from defection. There are several questions that need to be resolved and every manager wants to know: (1) Who are the most likely customers to defect and what characteristics they have? (2) Which approach has the best predictive performance and explanatory ability? (3) How to determinate churn in a non-contractual environment? Thus, we investigate the data provided by one of the largest retailers in Taiwan and try to answer these questions by using the data classification techniques and evaluate the performance of each technique applied.
LITERATURE REVIEW Churn
Churn is defined as the customer switching behavior that has been studied in recent literature (e.g.Coussement and Van den Poel, 2006[8]; Lemmens and Croux, 2006[15]). Generally, churn analysis defines switching behavior as total defection such as customers change their mobile phone service providers or close their banking accounts. In a contractual setting, it is easier to observe when churn occurs. Companies are able to determine the exact moment when customers terminate their relationship. But it is more complex in the non-contractual industries to determine whether customers defect or not. Nevertheless, customers do not suddenly defect from the company. They typically shift some of their purchases to another store, in other words, they reveal partial defection behavior (Buckinx and Van den Poel, 2005[6]).Churn has tremendous influences on the firms. (1) The cost to attract a new customer is much higher than to retain an old one. If a customer defects, it means that the company not only loses current revenue from the customer but costs more resource to attract a new customer for replacement (Keaveney,
1995[14]; Athanassopoulos, 2000[1]; Colgate and Danaher, 2000[7]). On the other hand, retained customers produce higher margin and cost less resource than newly acquired customers (Reichheld and Sasser., 1990[26]; Mozer et al., 2000[19]). In the retail business, customers are free to shop in any store. They may choose their supplier based on a complex combination of price, goods, service, preference, convenience, and other factors. Marketing campaigns have to focus on the right target, rather than using mass marketing approaches, since the resource is limited and the competition is getting intensive time after time. Therefore, it is particularly important for companies to understand which customer that may leave (Smith et al., 2000[29]). The churn prediction model is not only able to predict which customer may leave the company but also to provide the probability. Firms can use the information from churners to improve their products or services (Page et al., 1996[23]). In the long run, the models can be integrated to design the optimal strategies of pricing, sales, advertising, direct marketing, distribution, and retention, and prevent churn in advance (Page et al., 1996[23]).
Solution Techniques for Churn Prediction Logistic Regression
Logistic regression, also called logit model, is a well-known statistical technique for classification. It is used when the dependent variable is binary or dichotomous and the independent ones are of any type. Logistic regression is very popular for three main advantages: (1) It is easy to use and provides quick and robust results (Neslin et al, 2006[20]). (2) The basic assumption in the parameters, the linear logarithm of the ratio of group-conditional densities, is satisfied by many families of distributions. (3) It is available to give a closed form for the posterior probabilities. The probabilities of estimation and the cumulative probability are surely between zero and one.
Linear Discriminant Analysis
Linear discriminant analysis (LDA) is used in statistics to find the linear combination of features which best separate two or more classes of objects or events. The resulting combinations may be used as a linear classifier, or more commonly in dimensionality reduction before later classification. In marketing, linear discriminant analysis is usually used to determine the factors which distinguish different types of customers on the basis of surveys or other forms of collected data (Gilbert, 1968[11]; Moore, 1973[18]). The stepwise linear discriminant analysis enters the predictors sequentially to estimate the coefficients of linear discriminant function and uses Wilks’s lambda to select significant independent variables.
Random Forests
Random forests combines bagging idea (Breiman, 1996[3]) and random subspace method to construct a collection of decision trees with controlled variations. This technique has many advantages: (1) generally it performs better than other available techniques (Buckinx and Van den Poel, 2005[6]); (2) properly used while existing a large proportion of the missing data; (3) robust performance regarding to noise and outliers; (4) being able to generate internal estimations of error, proximities between cases, variable interactions, and the importance of variables (Breiman, 2001[4]); and (5) fast learning rate (Buckinx et al., 2004[5]). Although random forests have been successful in its use for classification in bioinformatics, geology, medicine, and pattern recognition, the application in marketing is still rare (Buckinx and Van den Poel, 2005[6]).
Artificial Neural Network
An artificial neural network (ANN) is typically composed of an input layer, one or more hidden layers and an output layer with each consisting of several interconnected processing elements called neurons. The output of an artificial neural network relies on the cooperation of the individual neurons within the network to operate. There are several properties of an artificial neural network. (1) It processes information in parallel rather than in series; (2) is very robust in tolerating errors or failures; (3) has shown to be a very promising learning tool to model complex non-linear relationships; (4) requires no assumption that the independent and dependent variables can be any distribution; and (5) often achieves high predictive accuracy compared to other classification techniques (Buckinx and Van den Poel, 2005[6]).
Related Researches on Churn Prediction
Churn attracts lots of attention especially in telecommunication and financial sectors since competition in both sectors become more and more intensive. Mobile phone manufacturers provide new and sophisticated products to customers frequently and customers may want to switch their service providers when they want to change their mobile phones (Drew et al, 2001[9]; Lemmens and Croux, 2006[15]). Regarding to predicting performance, Mozer et al. (2000) [19] compared three predictive models including logistic regression, decision trees, and artificial neural networks. They found that an artificial neural network has the best performance. Drew et al. (2001) [9] combined survival analysis and artificial neural networks for customer classification successfully and improve the profitability of retention operations. Recently, a study found that both bagging and boosting techniques can significantly improve the classification performance of traditional classification models (Lemmens and Croux, 2006 [15]). The churn prediction issue has also been studied extensively in finance and insurance industries. For example, Smith et al. (2000) [29] utilized several techniques, including hypothesis test, statistics, clustering, decision trees, and neural network, at various stages of a holistic framework. Few studies have used data mining in retailing. Buckinx and Van den Poel (2005) [6] first proposed partial defection for churn prediction in retailing and also found that the random forest had better classification accuracy than logistic regression and neural networks. The concept of partial defection not only solves the situation that is unable to determine the exact moment when customers leave in retailing but is able to take actions before churn occurs. In addition, there are other techniques utilized in various domains, such as survival analysis (Bhattacharya, 1998[2]; Van den Poel and Larivière, 2004[30]), hazard model (Popkowski et al, 2000[24]), and support vector machine (Coussement and Van den Poel, 2006[8]).
researches only compared the performance of several techniques. In this study, we not only apply and compare the techniques applied for churn prediction, but also, we combine linear discrimanant analysis and artificial neural network and see if it will come out a better result.
RESEARCH METHODOLOGY Research Procedure
Base on the literature review, we choose a number of possible predicting variables and establish a churn prediction model/procedure. We then apply three classification techniques to select key churn prediction variables and then identify the possible partial churners. The first stage of the churn prediction is the data preparation. We clean, extract and transform the selected dataset from the original data files. The second stage is target selection. We identified two target groups. The first includes the entire store members and the second includes only the loyal members. The third stage is to apply the solution techniques. We apply three classification techniques, including logistic regression, random forests, and back propagation neural networks, by using MATLAB and R programs. Moreover, we combine the discriminant analysis with the back propagation neural networks for churn analysis. Finally, we evaluate and compare the performance of these techniques applied. The data used for this study is retrieved and modified from a branch store of a major retailer in Taiwan for a two-year range. The data sources include the customer profiles, the transaction data, and the promotion data. The retailer has a membership program and the active members for the particular store are around 100,000 customers.
Procedure/Model Building
In this section, we illustrate each step on how we construct the procedure/model. Step 1: Churn identification
One of the purposes of this research is to predict the partial defection probability of individual level in the future. The variables in our classification models are all binary that the dependent variable classifies a customer who is either a stayer or a partial-defection customer (0, 1). In this study, we follow and modify the characteristics of the partial defection customer defined by Buckinx and Van den Poel (2005)[6] as below:
1. The frequency of purchases between observation period and determination period decreases more than eighty percentages.
2. The monetary of purchases between observation period and determination period decreases more than eighty percentages.
The first criterion is similar to the definition of Buckinx and Van den Poel (2005)[6] and the second criterion is able to discover whether a customer decrease his/her wallet share.
The first year data are used to observe the purchase patterns of the customers as a reference. The second year data are used to detect the partial churners. As a result, we identify 29,977 customers as the partial-defection customers. This is about 32.74% of the clients under our investigation.
Step 2: Target selection
In this study, the first target group applies the entire members and the second target group includes the loyal customers. For the second target, we followed Buckinx and Van den Poel (2005)[6] and defined the loyal customers who met the two criteria : (1) the frequency of purchase is above the average. Second, the ratio of the standard deviation of the inter-purchase time to the mean inter-purchase time is below the average. Consequently, we select 24,086 customers, who are behaviorally loyal than other customers, from total available customers. There are 4,732 partial churners of behaviorally loyal customers and the churn rate of behaviorally loyal customers is 19.65%.
Step 3: Cross-Validation
Cross-validation is a statistical practice used by iteratively partitioning the sample in two subsets of the initial data set (Hastie, Tibshirani, and Friedman, 2001[13]; Martinez and Martinez, 2001[17]). One of the subsets is used for model building and the other one is used for evaluation. This research randomly chooses a fifth of the initial sample as the testing data and the remaining observations are retained as the training data.
Step 4: Applying the solution techniques:
In this research, we use logistic regression, discriminant analysis, random forests, and back propagation neural network to construct classification models. First, we use logistic regression, random forests, and back propagation neural networks separately to predict the possible churners. Second, we apply the discriminant analysis for variable selection and then use back propagation neural network for data classification.
Explanatory Variables
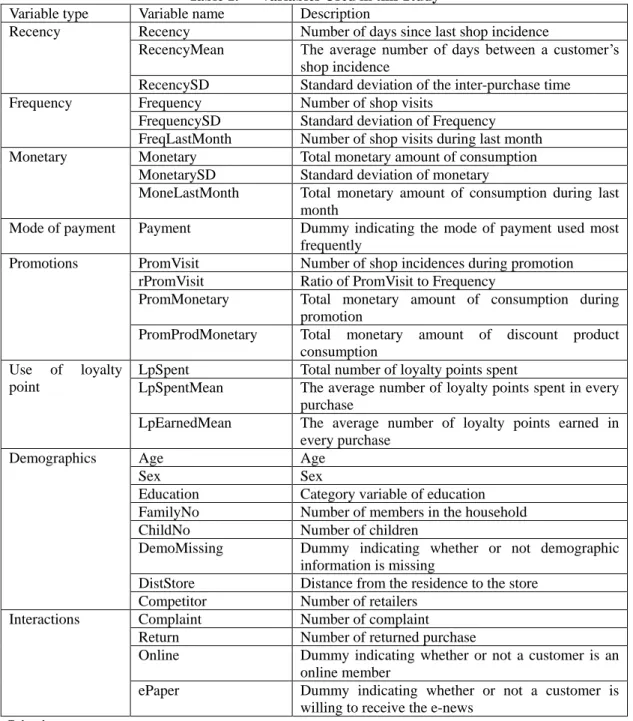
Based on literature reviews and the interviews with domain experts, we identified a number of explanatory variables as the inputs to the churn detection model. Table 1 lists the predictors used in this research.
Table 1. Variables Used in this Study
Variable type Variable name Description
Recency Recency Number of days since last shop incidence
RecencyMean The average number of days between a customer’s shop incidence
RecencySD Standard deviation of the inter-purchase time Frequency Frequency Number of shop visits
FrequencySD Standard deviation of Frequency FreqLastMonth Number of shop visits during last month Monetary Monetary Total monetary amount of consumption
MonetarySD Standard deviation of monetary
MoneLastMonth Total monetary amount of consumption during last month
Mode of payment Payment Dummy indicating the mode of payment used most frequently
Promotions PromVisit Number of shop incidences during promotion rPromVisit Ratio of PromVisit to Frequency
PromMonetary Total monetary amount of consumption during promotion
PromProdMonetary Total monetary amount of discount product consumption
Use of loyalty point
LpSpent Total number of loyalty points spent
LpSpentMean The average number of loyalty points spent in every purchase
LpEarnedMean The average number of loyalty points earned in every purchase
Demographics Age Age
Sex Sex
Education Category variable of education FamilyNo Number of members in the household ChildNo Number of children
DemoMissing Dummy indicating whether or not demographic information is missing
DistStore Distance from the residence to the store Competitor Number of retailers
Interactions Complaint Number of complaint Return Number of returned purchase
Online Dummy indicating whether or not a customer is an online member
ePaper Dummy indicating whether or not a customer is willing to receive the e-news
Evaluation Criteria
In order to evaluate the performance of classification techniques, we use two criteria: percentage correctly classified (PCC) and area under the receiver operating characteristic curve (AUROC). Percentage of correct classification, also called error rate, is the traditional performance criterion. It is the percentage of incorrectly classified observations in the validation set. The definition of PCC is noted as the higher the PCC is, the better the classification technique is. The formula is PCC = (A + D) / (A + B + C + D). The ROC measure takes into account all possible cut off levels and considers the sensitivity (the number of true positives versus the total number of switchers) and the specificity (the number of true negatives versus the total number of stayers) of the confusion matrix in a two-dimensional graph. The area under ROC (AUROC) can be used to evaluate the predictive accuracy of classification models.
DATA ANALYSIS AND RESULTS Performances of the Models
This study applies random forests, back propagation neural networks, and the combination of linear discriminant analysis and back propagation neural networks for churn prediction. As the benchmark, we use a logistic regression model on the same samples. Using the logistic regression model as the benchmark is also suggested by the previous studies (Buckinx and Van den Poel, 2005[6]; Lemmens and Croux 2006[15]).
Analysis of all customers
Table 2 represents the percentage correctly classified (PCC) and the area under the receiver operating characteristic curve (AUROC) of the proportion sample for entire customer base.
Table 2. Performance results of the training and testing sample for all customers
PCC AUROC
Training Test Training Test Logistic regression 0.8245 0.7633 0.8573 0.7960 Random forests 0.8791 0.8324 0.9024 0.8701 BPN 0.8480 0.7879 0.8872 0.8055 LDA+ BPN 0.8564 0.7922 0.8853 0.8276
Analysis of the loyal customers
Table 5 represents the percentage correctly classified (PCC) and the area under the receiver operating characteristic curve (AUROC) of the proportion sample for loyal clients. As a result, the back propagation neural networks have the best performance. Moreover, the combination model of linear discriminant analysis and back propagation neural networks outperforms logistic regression and random forests.
Table 3. Performance results of the training and testing sample for loyal customers
PCC AUROC
Training Test Training Test Logistic regression 0.9255 0.9041 0.9472 0.9239 Random forests 0.9660 0.9397 0.9890 0.9600 BPN 0.9819 0.9628 0.9944 0.9653 LDA+ BPN 0.9684 0.9426 0.9898 0.9600
From the analysis of results given above, we can see that the combination technique is able to maintaining good solution quality, saving memory size, and with reasonable computation time. Using linear discriminant analysis helps back propagation neural networks to decrease the dimension of the input data and to lower computation time since it selects the most important variables before training neural networks. In this research, the computation time of the combination techniques only requires about half of the time of back propagation neural networks.
Identified Key Variables for Churn Prediction
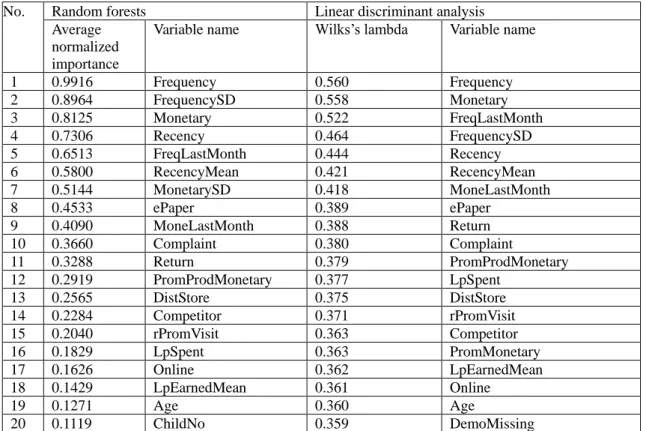
In this study, we do not only evaluate the prediction performance of different approaches but also identify several key variables in predicting churn and specific features of the churners. Results in Table 4 present the average normalized importance (Breiman, 2001[4]) of each predictor for the random forests approach and the Wilks’s lambda of each predictor for the linear discriminant analysis under the entire customer base. In Table 4, we report only the first twenty key variables for random forests. Table 5 describes the identified key variables for the group of loyal customers.
Table 4. Importance of variables for all customers
No. Random forests Linear discriminant analysis Average
normalized importance
Variable name Wilks’s lambda Variable name
1 0.9916 Frequency 0.560 Frequency 2 0.8964 FrequencySD 0.558 Monetary 3 0.8125 Monetary 0.522 FreqLastMonth 4 0.7306 Recency 0.464 FrequencySD 5 0.6513 FreqLastMonth 0.444 Recency 6 0.5800 RecencyMean 0.421 RecencyMean 7 0.5144 MonetarySD 0.418 MoneLastMonth 8 0.4533 ePaper 0.389 ePaper 9 0.4090 MoneLastMonth 0.388 Return 10 0.3660 Complaint 0.380 Complaint 11 0.3288 Return 0.379 PromProdMonetary 12 0.2919 PromProdMonetary 0.377 LpSpent 13 0.2565 DistStore 0.375 DistStore 14 0.2284 Competitor 0.371 rPromVisit 15 0.2040 rPromVisit 0.363 Competitor 16 0.1829 LpSpent 0.363 PromMonetary 17 0.1626 Online 0.362 LpEarnedMean 18 0.1429 LpEarnedMean 0.361 Online 19 0.1271 Age 0.360 Age 20 0.1119 ChildNo 0.359 DemoMissing
Table 5. Importance of variables for loyal clients
No. Random forests Linear discriminant analysis
importance 1 0.9811 MoneLastMonth 0.602 FreqLastMonth 2 0.8591 FreqLastMonth 0.511 FrequencySD 3 0.7866 MonetarySD 0.504 Recency 4 0.7146 Monetary 0.493 MonetarySD 5 0.6458 Recency 0.486 Frequency 6 0.5771 FrequencySD 0.475 Monetary 7 0.5094 DistStore 0.468 Competitor 8 0.4437 Frequency 0.465 ePaper 9 0.3786 rPromVisit 0.463 DistStore 10 0.3149 Competitor 0.461 rPromVisit 11 0.2685 ePaper 0.460 Online 12 0.2598 Online 0.459 Return 13 0.2564 Age 0.458 Complaint 14 0.1985 Complaint 0.457 Age 15 0.1412 Return 0.457 ChildNo 16 0.0881 ChildNo 0.456 LpSpent
Tables 4 and 5 offer the similar results. It is obvious from the ranks of variable importance that behavior variables, such as recency, frequency and monetary, are much more important than others. It is not surprising since recency, frequency, and monetary (RFM) variables are well-known predictors confirming by the previous literature (Schmittlein and Peterson, 1994[28]; Reinartz and Kumar, 2000[27]; Lemon, White, and Winer, 2002[16]; Buckinx and Van den Poel, 2005[6]). A model only using transaction and demographics variable offers an AUROC of 0.7601 compared to 0.8055 in the case of back propagation neural networks on the test sample. The results are similar in other models.
Nevertheless, some variables proposed in this study are similarly important on churn prediction, such as promotion, use of the loyalty points, and customer interaction. It is opposite to the finding of Buckinx and Van den Poel (2005)[6] that use of the loyalty points is not important on churn prediction. Since the loyalty points are earned from every purchase and can be used for price discount, they could be a switching cost for customers. On the other hand, customers who purchase lots of discount products and shop a lot during the promotions tend to be price-oriented. For customer interaction, variables like ePaper, Complaint, and Return are even in the top ten important predictors of random forests and discriminant analysis. It seems reasonable because the increase of complaint and returned goods result in dissatisfaction and lead to future defection. On the contrary, a customer who is willing to receive the information from the company may want to build a long term relationship with the company.
Comparing to other predictors, demographics seem not too important. It is notable that the most important variables of demographics are DistStore and Competitor. These variables give empirical evidence that customers may defect in the future because of inconvenience.
Descriptive Statistics of the Partial Churners
In the following paragraphs, we will character the several important characteristics of the partial churners between all customers and loyal customers.
All customers
The average age of the partial churners is 36.80 years old, younger than 39.91 years old of the stayers, and roughly 58 percentages of these customers are between 25 to 39 years old. Most of them are single or have no children. As the results of the personal information, the average distance between the churners’ residences and the store is around 29.80 minutes of driving and about 2.5 competitors in the area. The partial churners spend averagely NT$ 289.28 and visit around 0.23 times in a month. Both frequency and monetary of the partial churners are less than a half of the stayers. Moreover, they purchase lots of discount products and visit during the promotion periods.
CONCLUSION
In this research, the empirical findings lead us to give several conclusions. First, the performances of the techniques we applied vary from the data. Managers and researchers have to choose their techniques carefully based on their data. However, the rule-based and the machine learning techniques could outperform than the traditional statistical techniques. Second, it is not easy for loyal customers to distinguish the partial churners from the stayers by only analyzing their transaction patterns. Third, using the decrement of RFM as the threshold may be more appropriate than using the average, since the decrement of frequency between customers are various. Fourth, variables, such as promotion, use of loyal points, customer interaction, and some customer profiles, are useful to help determine a customer who may defect or not.
A major contribution of this study is that we improve the original definition of partial defection. We suggest using the decrement of frequency and monetary rather than average as the threshold for the definition of partial defection. Moreover, predicting partial defection instead of total defection allow managers to take actions, such as proactive customer retention implements, in time before churners leave. One goal of this study is to select the important variables for churn prediction that are not only theoretically sound but also managerially applicable. For example, variables like promotion, use of loyal points as well as customer interaction are able to cluster customers based on their purchase purposes, preferences, and life styles.
Consequently, marketing managers can use these variables to segment customers into several groups and provide different marketing programs for them to increase their loyalty and purchase.
In this research, we focus on not only the group of total customers but also on the loyal customers. Since some customers may not be worth of developing long-term relationships, firms do not need to analyze and to retain every customer. A large percentage of the sales come from a small percentage of your clients (Niraj, Gupta, and Narasimhan, 2001[22]; Buckinx and Van den Poel, 2005[6]). Only the loyal customers are worth of retention and loyalty efforts. For the possible partial churners whose values are above a certain threshold, the firm can provide some special incentives they might draw interest to them to keep them stay. It helps managers to focus their limited resource on the right target rather than mass marketing.
Churn prediction is only the first stage of customer relationship management (CRM). There requires more follow-up researches to investigate the actual reasons why customers switch and leave. In other words, the people who are classified as future churners can be used to compose focus groups and conduct questionnaires or interviews to understand the reasons and attributes of churn. Accordingly, managers can use the information to design more effective retention strategy and improve their quality of services and products to increase the retention rate and increase the profitability for the firm.
There are several limitations of this research. First of all, we use only one year of available data to determine the target of this study and another one year to evaluate partial churners. To what extent this time restriction affects our results is indistinct. The more the results may change whenever more data is available. This gives the opportunity for future researchers to investigate what happens after some time to the people who are classified as partial churners. Furthermore, the variables used as inputs in this research are based on the data from a company internal data warehouse. The variables are able to be extended with customer perceptions from focus groups and interviews to increase the performance of the models. Future researchers can use questionnaires to get useful insights from customers and combine it with data mining techniques to get more robust conclusions.
This study applies several statistical and machine learning techniques. However, there remain many classification models have not been used for churn prediction in retailing, such as support vector machine, survival analysis, and hazard model. There has no conclusion which model is the best since the performance of the models vary from data and input variables.
REFERENCE