Abdusslam, Shukri Ali
Detection and Diagnosis of Rolling Element Bearing Faults Using Time Encoded Signal Processing and Recognition
Original Citation
Abdusslam, Shukri Ali (2012) Detection and Diagnosis of Rolling Element Bearing Faults Using Time Encoded Signal Processing and Recognition. Doctoral thesis, University of Huddersfield. This version is available at http://eprints.hud.ac.uk/17806/
The University Repository is a digital collection of the research output of the University, available on Open Access. Copyright and Moral Rights for the items on this site are retained by the individual author and/or other copyright owners. Users may access full items free of charge; copies of full text items generally can be reproduced, displayed or performed and given to third parties in any format or medium for personal research or study, educational or not-for-profit purposes without prior permission or charge, provided:
• The authors, title and full bibliographic details is credited in any copy;
• A hyperlink and/or URL is included for the original metadata page; and
• The content is not changed in any way.
For more information, including our policy and submission procedure, please contact the Repository Team at: [email protected].
Detection and Diagnosis of Rolling Element
Bearing Faults Using Time Encoded Signal
Processing and Recognition
Shukri Ali Abdusslam
A thesis submitted to the University of Huddersfield in partial fulfilment of the requirements for the degree of Doctor of Philosophy
The University of Huddersfield
2
LIST OF CONTENTS
LIST OF CONTENTS ... 2 LIST OF FIGURES ... 5 LIST OF TABLES ... 10 ABSTRACT ... 11 DECLARATION ... 13 DEDICATION ... 14 ACKNOWLEDGEMENT ... 15 COPYRIGHT ... 16 PUBLICATIONS ... 17 CHAPTER ONE ... 191 Introduction to Condition Monitoring ... 19
1.1 Background ... 20
1.2 The Importance of Condition Maintenance and Fault Diagnosis ... 22
1.3 Condition Monitoring Using Vibration Analysis ... 23
1.4 Condition Monitoring Application to Rolling Element Bearings... 24
1.5 Literature Survey for Bearing Monitoring Methods ... 26
1.5.1 Time Domain Analysis ... 27
1.5.2 Frequency Domain Analysis ... 28
1.5.3 Time-Frequency Domain Analysis ... 30
1.5.4 Higher Order Spectral Analysis ... 31
1.5.5 Neural Networks Approach ... 32
1.5.6 Support Vector Machines ... 34
1.5.7 Fuzzy Logic ... 34
1.5.8 Model-Based Techniques ... 35
1.5.9 Bearing Prognostics Using Vibration Signatures ... 36
1.5.10 Acoustic Emission Monitoring ... 38
1.6 Research Motivation ... 40
1.7 Research Aim and Objectives... 45
1.8 Thesis Organisation... 46
CHAPTER TWO ... 48
2.1 Introduction ... 49
2.2 Types of Rolling Element Bearings ... 49
2.3 Bearing Description and Components ... 52
2.3.1 Inner Race... 52
2.3.2 Outer Race ... 53
2.3.3 Rolling Elements ... 53
2.3.4 Cage ... 53
2.4 Bearing Failure Modes ... 53
2.4.1 Primary Damage ... 55
2.4.2 Secondary Damage ... 61
2.4.3 Fatigue Spalling ... 66
2.5 Dynamic Responses of Roller Bearings to Local Defects ... 67
2.6 Characteristic Symptoms for Bearing Failure ... 68
CHAPTER THREE ... 72
3 Vibration Signal Analysis Techniques for Bearing Faults ... 72
3.1 Introduction ... 73
3.2 Vibration Measurement ... 74
3.3 The Theory of Vibration Analysis Techniques ... 75
3.3.1 Time Domain Parameters Theory ... 75
3.3.2 Frequency-Domain Techniques ... 80
3.3.3 Envelope Analysis ... 81
3.3.4 Time-Frequency Analysis - The Wavelet Transform ... 89
CHAPTER FOUR ... 95
4 Time Encoded Signal Processing and Recognition (TESPAR) ... 95
4.1 Introduction ... 96
4.2 TESPAR Coding Background ... 97
4.2.1 Infinite Clipping... 97
4.2.2 Zero-Based Analysis of Signals ... 98
4.3 TESPAR Alphabets... 100
4.4 TESPAR Advantages ... 102
4.5 TESPAR Data Matrices ... 103
4.5.1 The S-Matrix ... 105
4.5.2 The A-Matrix ... 105
4.6 TESPAR in Action ... 106
4.7 Simulation of TESPAR to Detection of Bearing Defects ... 108
4
4.7.2 The S-Matrix and Amplitude Modulation ... 112
4.7.3 Numerical Study of TESPAR A-Matrices ... 116
4.8 TESPAR Coding and Implementation Process ... 120
4.9 Test Procedure Adopted ... 124
CHAPTER FIVE ... 128
5 Test Rig Facility and Experimental Procedure ... 128
5.1 Experimental Facilities ... 129
5.1.1 Test Rig Construction and Components ... 129
5.1.2 Data Acquisition System ... 131
5.1.3 Vibration Transducer ... 133
5.1.4 Load Cell ... 134
5.1.5 Speed and Torque Controller... 135
5.2 Bearing Sample Preparation ... 135
5.3 Experimental and Data Collection Procedure ... 139
CHAPTER SIX ... 141
6 Results and Discussion ... 141
6.1 Initial Results and Discussion... 142
6.2 Base-Lining Analysis and Results ... 146
6.2.1 Envelope Spectrum ... 146
6.2.2 Wavelet Analysis ... 149
6.3 TESPAR Processing Specification ... 153
6.4 Fault Location Classification ... 154
6.4.1 Classification of Bearing Faults Using S-Matrix... 155
6.4.2 Classification of Bearing Faults Using A-Matrix ... 160
6.5 Fault Severities - Results and Discussion ... 166
6.6 TESPAR Comparison with Conventional Methods Used... 169
CHAPTER SEVEN ... 172
7 Conclusions and Recommendation of Future Work ... 172
7.1 Summaries and Conclusions ... 173
7.2 Review of Aim and Objectives ... 175
7.3 Contributions to Knowledge ... 178
7.4 Suggestions for Further Work ... 179
8 Appendix ... 181
LIST OF FIGURES
Figure 2-1 Schematic diagram showing contact angle, a0--- 51
Figure 2-2 Rolling elements bearing, NSK type N406 --- 52
Figure 2-3 Schematic of cylindrical roller bearing --- 52
Figure 2-4 Wear of the surface caused by abrasive particles --- 56
Figure 2-5 Bearing surfaces indentation --- 58
Figure 2-6 Bearing smearing --- 59
Figure 2-7 Bearing rust and corrosion --- 60
Figure 2-8 Bearing flaking --- 62
Figure 2-9 Bearing spalling --- 63
Figure 2-10 Bearing cracking --- 64
Figure 2-11 Bearing cage damage --- 64
Figure 2-12 0Bearing rollout --- 66
Figure 2-13 Bearing fatigue --- 67
Figure 2-14 Envelope spectrums for healthy and outer race faulty bearings --- 71
Figure 3-1 Simple example of modulation of carrier wave to produce a modulated wave -- 82
Figure 3-2 Schematic of digital demodulation --- 86
Figure 3-3 Envelope spectrum (Hz) for bearing with outer race fault --- 87
Figure 3-4 Amplitude modulation of the envelope signal for fault on inner race --- 88
Figure 3-5 Four common Daubechies wavelets --- 93
Figure 4-1 Infinite clipping: only zero crossing information preserved --- 98
6
Figure 4-3 TESPAR symbol stream conversion --- 102
Figure 4-4 TESPAR S-matrix used in speaker recognition --- 107
Figure 4-5 TESPAR A-matrix used in speaker recognition --- 107
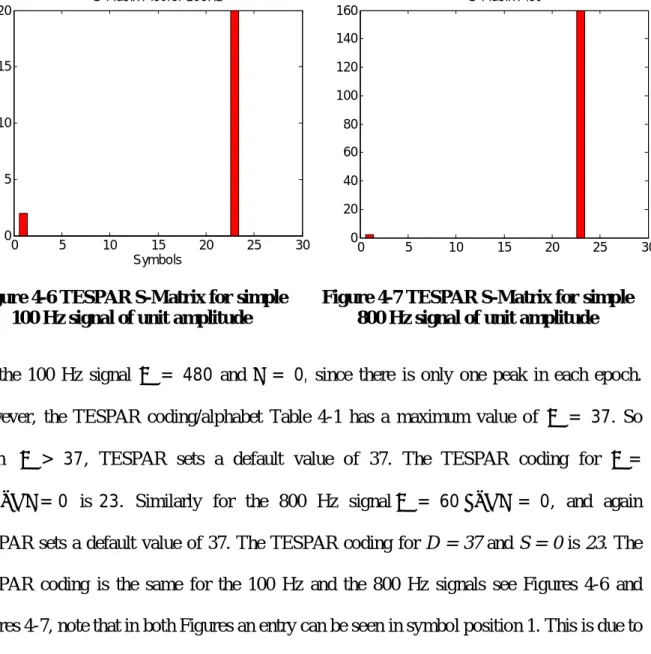
Figure 4-6 TESPAR S-Matrix for simple 100 Hz signal of unit amplitude --- 109
Figure 4-7 TESPAR S-Matrix for simple 800 Hz signal of unit amplitude --- 109
Figure 4-8 TESPAR S-Matrix for simple 8000 Hz signal of unit amplitude --- 111
Figure 4-9 S-Matrix for white noise --- 112
Figure 4-10 S-Matrix for 1 tenth of white noise with 100 Hz --- 112
Figure 4-11 The modulated signal of 100 HZ and 8000 HZ --- 113
Figure 4-12 S-Matrix for the modulated signal --- 114
Figure 4-13 S-Matrix for one tenth of white noise and the modulated signal --- 115
Figure 4-14 A-Matrix for 100 Hz sine wave with (96 000 S/s) --- 117
Figure 4-15 A-Matrix for 8000 Hz sine wave with (96 000 S/s) --- 117
Figure 4-16 A-matrix for modulated signal with (96 000 S/s) --- 118
Figure 4-17 A-Matrix for one tenth of white noise --- 118
Figure 4-18 A-Matrix for modulated signal with white noise --- 119
Figure 4-19 A-Matrix for modulated signal with white noise and delay = 12 --- 120
Figure 4-20 TESPAR coding and classification procedure action --- 121
Figure 5-1 Schematic of the test rig --- 130
Figure 5-2 Test rig construction --- 131
Figure 5-3 Sinocera YE6232B data acquisition system --- 132
Figure 5-4 Sinocera accelerometer model YD-5 --- 133
Figure 5-5 Sinocera load cell --- 134 Figure 5-6 Photograph of Siemens Micro Master Controller and data acquisition system - 135 Figure 5-7 Photograph of NSK type N406 cylindrical roller bearings with 30% roller
fault (R3) --- 137
Figure 5-8 Photograph of NSK type N406 cylindrical roller bearing with 60% inner race fault (I2) --- 137
Figure 5-9 Photograph of NSK type N406 cylindrical roller bearing with 100% outer race fault (O1) --- 138
Figure 6-1 Time domain waveforms for small outer and big inner races faulty bearings – 142 Figure 6-2 Vibration signals for normal bearing and bearing with outer race fault --- 144
Figure 6-3 Vibration spectra of normal bearing and bearing with outer race fault --- 145
Figure 6-4 Envelope spectrums for healthy and three different degrees of outer race faulty bearings --- 147
Figure 6-5 Envelope spectrums for healthy and three different degrees of roller faulty bearings --- 148
Figure 6-6 Envelope spectrum for healthy and three different degrees of inner race faulty bearings --- 148
Figure 6-7 Envelope spectrum for healthy bearing and three different bearing faults --- 149
Figure 6-8 Spectrum of wavelet filtered signals for a healthy and three different severities of outer race faults --- 150
Figure 6-9 Wavelet signals for a healthy and three different degrees of rollers faults --- 151
Figure 6-10 Wavelet signals for a healthy and three different degrees of inner race faults -152 Figure 6-11 Wavelet signals for a healthy and three different small bearings faults --- 152
Figure 6-12 (a) S-Matrix for the first Normal condition --- 155
Figure 6-12 (b) S-Matrix for the second Normal condition --- 155
Figure 6-12 (c) S-Matrix for the third Normal condition --- 155
Figure 6-12 (d) S-Matrix Archetype for the Normal condition --- 155
8
Figure 6-13 (b) S-Matrices for the 60% fault of the Outer Race --- 156
Figure 6-13 (c) S-Matrices for the 100% fault of the Outer Race --- 156
Figure 6-13 (d) S-Matrix Archetype for the Outer Race Fault --- 156
Figure 6-14 (a) S-Matrices for the 30% fault of the Roller --- 157
Figure 6-14 (b) S-Matrices for the 60% fault of the Roller --- 157
Figure 6-14 (c) S-Matrices for the 100% fault of the Roller --- 157
Figure 6-14 (d) S-Matrix Archetype for the Roller --- 157
Figure 6-15 (a) S-Matrices for the 30% fault of the Inner Race --- 157
Figure 6-15 (b) S-Matrices for the 60% fault of the Inner Race --- 157
Figure 6-15 (c) S-Matrices for the 100% fault of the Inner Race --- 158
Figure 6-15 (d) S-Matrix Archetype for the Inner Race Fault --- 158
Figure 6-16 (a) A-Matrix for the first Normal condition --- 160
Figure 6-16 (b) A-Matrix for the second Normal condition --- 160
Figure 6-16 (c) A-Matrix for the third Normal condition --- 161
Figure 6-16 (d) A- Matrix Archetype for the Normal condition --- 161
Figure 6-17 (a) A- Matrices for the 30% fault of the Outer Race --- 161
Figure 6-17 (b) A- Matrices for the 60% fault of the Outer Race --- 161
Figure 6-17 (c) A- Matrices for the 100% fault of the Outer Race --- 162
Figure 6-17 (d) A- Matrix Archetype for the Outer race fault --- 162
Figure 6-18 (a) A- Matrices for the 30% Roller fault --- 162
Figure 6-18 (b) A- Matrices for the 60% Roller fault --- 162
Figure 6-18 (c) A- Matrices for the 100% Roller fault --- 163
Figure 6-18 (d) A- Matrix Archetype for the Roller fault --- 163
Figure 6-19 (a) A- Matrices for the 30% Inner Race fault --- 163
Figure 6-19 (c) A- Matrices for the 100% Inner Race fault --- 164
Figure 6-19 (d) A- Matrix Archetype for the Inner Race fault --- 164
Figure 6-20 Mean absolute magnitude values for Outer Race Location --- 168
Figure 6-10 Mean absolute magnitude values for Roller Location --- 168
10
LIST OF TABLES
Table 2-1 Rolling element bearing types --- 50
Table 2-2 Bearing defection by cause --- 54
Table 2-3 Calculated defect frequencies and corresponding measured values for NGK bearing type N406 --- 70
Table 4-1 TESPAR symbol “alphabet” --- 101
Table 5-1 Data acquisition system specification --- 132
Table 5-2 Sinocera accelerometer specification --- 133
Table 5-3 Sinocera load cell specification --- 134
Table 5-4 Specification of NSK type N406 cylindrical roller bearing --- 135
Table 5-5 Bearings defect specification --- 138
Table 6-1 correlation scores for A-matrix archetypes --- 159
Table 6-2 Correlation scores for S-matrix archetypes --- 165
ABSTRACT
This thesis presents a systematic study of using TESPAR (Time Encoded Signal Processing and Recognition), which presently is in use as an effective tool for speech recognition and shows great advantages in computational demands and accuracy, to develop a new technique for rolling element bearing fault detection and diagnosis.The fundamentals of rolling element bearings are presented in line with different failure modes and relevant monitoring methods in the time domain, the frequency domain, the envelope spectrum and the wavelet analysis. These reviews show that vibration measurements are a proven and widely accepted data source for bearing monitoring of machinery.
This research thus has focused on developing TESPAR based approaches using vibration signals which are generated from bearings under different severities of faults located at the outer race, the inner race and the roller element. It firstly examines the theoretical basis of TESPAR and examines the diagnosis performance with a number of different simulated signals, which confirms that TESPAR based methods are able to resolve different signals by using their statistics including S-matrix, A-matrix and epoch duration, which paves a frame work to process and interpolate the bearing signal.
With understandings of the insights of bearing vibrations and TESPAR approaches a signal processing framework is then suggested to analyse bearing vibration signals. It consists of a pre-processing step which removes possible noise in the signal, a TESPAR coding step which converts the signal into TESPAR representations-TESPAR streams, a feature calculation
12 step, which produces different TESPAR statistic parameters, and finally a diagnosis step which applies common statistics to TESPAR statistic parameters to obtain required results.
The TESPAR solution proposed in this thesis shows that discrimination between different bearing signal waveforms has been implemented successfully. TESPAR S- and A-Matrices were constructed for the cases tested and used together with statistical correlation to differentiate between the types of faults. However, the severities of bearing faults have been identified using another TESPAR feature called the mean absolute magnitude value calculated using epoch durations.
The performance of the TESPAR approach was then evaluated against the envelope spectrum; this being the most common method for bearing condition monitoring that is conducted in two terms; the process complexity and diagnosis performance.
A major contribution of this research programme is the development of a method that can provide improved detection and diagnosis of bearing fault types and severity of faults seeded into roller bearings.
DECLARATION
No portion of the work presented in this thesis has been submitted in support of an application for another degree or qualification of this or any other university or other institute of learning.14
DEDICATION
I dedicate this work to my dear parents for the lifelong and boundless love that I received from them as well as their unwavering support, also dedicated to my wife for her unfaltering encouragement throughout my study and my little daughter Lamar. Without their support, reaching this point would not have been possible.ACKNOWLEDGEMENT
Few goals are ever achieved without the help of teachers, mentors, colleagues, family, and friends. For the assistance, support, and guidance I have received while completing mypostgraduate studies I am indebted to Prof. Andrew Ball, I would like to express my sincere
gratitude to him. Also I would like to express my genuine appreciation to my second supervisor
Dr. Fengshou Gu for his continuous direction, support and patience throughout my PhD research above and beyond the merely technical during my research, it was really my privilege to have such a supervisory team. I would like to acknowledge invaluable input and countless enlightening meetings, discussions and conversations with them.
My special appreciation goes to Mr Ashley Elkins for his kind help and assistance in this
research.
My special thanks goes to my colleagues and friends, I was fortunate to have nice peers in my research group.
16
COPYRIGHT
i. The author of this thesis (including any appendices and/or schedules to this thesis) owns
any copyright in it (the “Copyright”) and he has given The University of Huddersfield the right to use such Copyright for any administrative, promotional, educational and/or teaching purposes.
ii. Copies of this thesis, either in full or in extracts, may be made only in accordance
with the regulations of the University Library. Details of these regulations may be obtained from the Librarian. This page must form part of any such copies made.
iii. The ownership of any patents, designs, trademarks and any and all other intellectual
property rights except for the Copyright (the “Intellectual Property Rights”) and any reproductions of copyright works, for example graphs and (“Reproductions”), which may be described in this thesis, may not be owned by the author and may be owned by third parties. Such intellectual property rights and reproductions cannot and must not be made available for use without the prior written permission of the owner(s) of the relevant intellectual property rights and/or reproductions.
PUBLICATIONS
Abdusslam, S.A., Raharjo, Parno, Gu, Fengshou and Ball, Andrew (2012) Bearing defect detection and diagnosis using a time encoded signal processing and pattern recognition method. Journal of Physics: Conference Series, 364. 012036. ISSN 1742-6596.Raharjo, Parno, Abdusslam, S.A., Gu, Fengshou and Ball, Andrew (2012) Vibro-Acoustic Characteristic of A Self Aligning Spherical Journal Bearing due to Eccentric Bore Fault. In: CM 2012 and MFPT 2012: The Ninth International Conference on Condition Monitoring and Machinery Failure Prevention Technologies, 12th - 14th June 2012, London, UK.
Abdusslam, S.A., Ahmed, Mahmud, Raharjo, Parno, Gu, Fengshou and Ball, Andrew (2011) Time Encoded Signal Processing and Recognition of Incipient Bearing Faults. IEEE In: 17th International Conference on Automation and Computing (ICAC'11), 10th September 2011, Huddersfield, UK.
Ahmed, Mahmud, Abdusslam, S.A., Baqqar, Mabrouka, Gu, Fengshou and Ball, Andrew (2011) Fault Classification of Reciprocating Compressor Based on Neural Networks and Support Vector Machines. IEEE In: 17th International Conference on Automation and Computing (ICAC'11), 10th September 2011, Huddersfield, UK.
Raharjo, Parno, Abdusslam, S.A., Gu, Fengshou, Wang, Tie and Ball, Andrew (2011) An Investigation of Acoustic Emission Responses of a Self Aligning Spherical Journal Bearing. In: The Eighth International Conference on Condition Monitoring and Machinery Failure Prevention Technologies CM/MFPT 2011, 20th - 22nd June 2011, Cardiff, UK.
Abdusslam, S.A., Gu, Fengshou and Ball, Andrew (2010) Bearing fault diagnosis using time encoded signal processing and recognition. In: CM 2010 and MFPT 2010 : The Seventh International Conference on Condition Monitoring and Machinery Failure Prevention Technologies, 22-24 June 2010, Stratford-upon-Avon, UK.
18 Abdusslam, S.A., Gu, Fengshou and Ball, Andrew (2009) Bearing fault diagnosis based on vibration signals. In: Proceedings of Computing and Engineering Annual Researchers' Conference 2009: CEARC’09. University of Huddersfield, Huddersfield, pp. 93-98. ISBN 9781862180857.
Abdusslam, S.A., Ball, Andrew and Gu, Fengshou (2008) Diagnosis and Prognosis of Machinery Health based on Advanced Intelligent Computations. In: University of Huddersfield Research Festival 2009, 25 Feb-13 March 2008, Huddersfield.
CHAPTER ONE
1
Introduction to Condition Monitoring
This chapter reviews the importance of condition monitoring and fault diagnosis for the smooth running of industrial processes. It emphasises vibration measurement as this is both the most commonly used monitoring method in industry and the technique selected for the rolling element bearings used in this project. The sections of the chapter sequentially present the motivation for this research project, outline the aims and objectives and present the structure of this thesis.
20
1.1 Background
Condition Monitoring (CM) became widespread in the 1960’s and since then the technology has developed rapidly [1]. When operating as intended all electrical and mechanical systems generate a characteristic signal. If operating conditions change so does the signal, even if only slightly, indeed the small differences from the normal or healthy signal can be indicative of incipient fault development. Machine CM is the procedure of monitoring a parameter (e.g. temperature or vibration behaviour) of condition in machinery, such that a considerable alteration in a machine’s condition is indicative of a developing defect. The use of condition monitoring term permits schedule of maintenance or corrective actions to be taken place to evade catastrophic failure. However, a deviation from a normal value must happen to identify hidden faults. Today many books and journal papers are available in the field of CM and much industrial interest has been expressed both in research and provision of services [2-4]. However, these indicative changes in a machine’s condition may be so small that they are hidden by the noise in the system. Current interest is to combine modern transducers and signal processing techniques to differentiate between noise and significant trends and detect the presence of a fault at the earliest stage and even predict likely time to failure [5]. In a CM system, the measured signal changes with the parameter being monitored and, if chosen correctly will be a measurement of the electrical and/or mechanical condition of the machine. Such signals will include vibration level, acoustic emission and temperature. In addition other more traditional measurements such as the condition of the lubricant will enhance the possibility of accurately determining whether a machine may be considered “healthy” or has a fault which needs to be addressed and whether immediate maintenance action needs to be scheduled. Determining maintenance action in this way has enormous benefits; it cuts maintenance costs, extends the life of the machine, and avoids catastrophic failure [6–9].
CM is both an administrative and technical activity with the goal of maintaining or restoring a machine or process to a condition to carry out its intended functions. The technique is based on detecting the presence of a fault, diagnosing the cause of the fault, assessing its level of severity and making arrangements for its correction. CM offers numerous advantages, including [10]:
1- Reducing maintenance costs by minimising the number of machine overhauls by eliminating unnecessary interventions.
2- Because CM provides advanced information on the nature of the fault to be repaired advance preparations can be made and the duration of intervention time is minimised thereby minimising production loss.
3- Because CM provides advanced information on the severity of the fault to be repaired the likely duration of the intervention required can be determined early and disruption to the production process is minimised.
4- Avoiding/eliminating catastrophic failure.
The advantages gained by applying CM have led to a vast number of techniques now being available [2-10].
The condition of all dynamic systems changes with time, and thus its signature signal (vibration level, etc.) also changes. These changes in the system signal provide information on the presence, or otherwise, of the onset of a possible failure mode which until recently were commonly masked by system background noise. Today there is a growing emphasis on applying signal processing techniques in order to separate significant trends from random variations because this provides an earlier diagnosis and hence a longer time-to-failure which can be very important where the item of plant or machinery is of crucial importance for the production process, or an important component in any safety procedure. In other words, CM
22 introduces a reliable method to warn of the potential failure of critical components so that downtime can be based on a just-in-time principle rather than on a routine maintenance basis.
1.2 The Importance of Condition Maintenance and Fault Diagnosis
Competition in the global marketplace is forcing industrial companies to make greater efforts to reduce costs and enhance product quality to maintain their competitiveness. Catastrophic failures are dramatic and sometimes fatal and thus can be headline news but chronic failures which are smaller and often less visible are much more prevalent and frequent than catastrophic failure [11]. The consequence of chronic failures is frequent interruptions of production schedules, reduction in product quality and increased production costs. Generally, however, total downtime due to non-catastrophic failures is greater than that due to catastrophic failures, extraordinarily expensive and greatly exceeds maintenance costs [12].
Every year billions of dollars are spent on plant maintenance operations by the world’s industries [13] and it has been reported that maintenance costs may account for as much as one third the production costs of goods [14]. Substantial cost savings and increased profitability can be achieved by greater equipment availability and reliability. This requires the implementation of an effective CM and machinery maintenance programme [15]. If CM can be combined with regular and planned maintenance to minimize downtime it will increase productivity and should be cost-effective. Such a system would be expected to have contemporaneously improvement.
Correct and rapid fault detection and diagnosis can significantly improve machine availability. Thus many CM techniques have already been developed, in particular vibration monitoring using time and frequency domains to improve performance of both machines and systems [7, 8 and 16].
The earlier the detection and diagnosis the more time maintenance personnel have to take the necessary action to ensure production losses are avoided [10]. Because industrial processes tend to rely on specific machines, these machines are crucial for the smooth functioning of the system and their malfunction will result in costly production shut-downs. Preventive maintenance is vital for these machines and a significant amount of research is now being directed into that area [17, 18]. It follows that CM used with critical machines to provide an early warning of potential failure minimizes expensive downtime, greatly improving manufacturing efficiency, quality and safety [19].
Because mechanical failure can be catastrophic there is the risk of secondary damage to nearby components. CM minimizes such incidents. Traditionally industrial plant maintenance was reactive, unless the machine broke down it was not attended to - in common parlance: “if it isn’t broke, don’t fix it!” With the advent of cheap and powerful computers and advances in cost-effective sensor technology, by the 1990’s many industries had introduced a strategy of preventive maintenance to identify problem machines and predict maintenance requirements. A more recent approach to enhance maintenance technologies is called pro-active maintenance [17] which uses a comprehensive maintenance programme which is a balance of predictive and preventive maintenance.
1.3 Condition Monitoring Using Vibration Analysis
Considerable effort has been spent developing reliable methods for gear fault detection. Techniques which have been proven successful include analysis of lubricating oil, the acoustic signal generated by the gearbox when in operation, temperature and performance monitoring, electrical motor current analysis, angular speed of crank and drive shafts and, most popular today, vibration analysis.
24 Unfortunately, no one technique is able to detect all machine faults. However, it has been suggested that vibration measurement, which is the most widely used CM technique in industry, can accurately identify 90% of all machinery failures by the change in vibration signals which they produce and the level of signal can give an accurate prediction of future failure [7]. The task is to diagnose the fault at an early stage so corrective action can be taken as early as possible to extend the life of the machine [20].
1.4 Condition Monitoring Application to Rolling Element Bearings
This research focuses on CM of rolling element bearings because they are the most widely used component in rotating machinery and the consequences of bearing failure are the cause of widespread and substantial economic loss and, sometimes, catastrophic failure, [21]. In addition these bearings have presented a difficult task for maintenance programmes for a long time [22].
Rolling element bearings are widely used in all sizes of pumps and motors, and surveys have shown that failure in these elements accounts for just over half of electric motor failures [12]. Bearing defects are often a warning of other faults in the machine because, for example, misalignment and/or imbalance can be the cause of the bearing defects. Thus the CM of rolling element bearings is a very important component of many industrial maintenance programmes [12].
Despite the advances made in bearing design which have significantly increased bearing life, that life remains dependant on well-known factors such as lubrication (or lack thereof), contamination of the lubricant, bearing load, bearing speed, the precision of the initial setting of the component within the machine, the precision with which the component was
manufactured, the bearing maintenance programme and many other environmental factors including ambient temperature [23].
It is known theoretically that the time between installing the bearing and the first signs of material fatigue is a function of the number of bearing revolutions and the magnitude of the bearing load. However, with so many other factors to consider the life of any individual bearing can only be estimated since operating conditions will rarely be ideal and, in any case, there will always be slight variations during manufacture. It is known that apparently identical bearings can show considerably different lifetimes under the same test conditions [24].
The stresses experienced by bearings will invariably be cyclic in nature and such stresses produce metal fatigue. With time such stresses generate sub-surface cracks which gradually extend to the surface of the bearing raceway. The problem is exacerbated because the rolling elements of the bearing run over the cracks causing fragments of the surface to break away and increasing the area and depth of the crack. This is known as spalling or flaking. The surface wear progressively increases until the bearing is no longer viable and must be replaced. Because industrial processes require large numbers of bearings and individual bearing failures cannot be predicted accurately, the run time to failure of the process could be quite short with the danger of catastrophic failure and closure of the entire production line. It is therefore important to implement a plan for appropriate monitoring of the condition of all those bearings in the process machinery which are a key to continued production, preferably continuously, to avoid unplanned downtime and expensive repairs due to bearing failures [25].
26 Using modern technology a bearing CM programme would be expected to detect and locate the presence of a fault and identify the cause of the damage well before the fault developed to a serious stage [26, 27]. Early detection of bearing faults requires a method sensitive to impulsive signals and the changes in them. Early bearing fault detection has the same problem as all early detection systems, that the signal to be detected is small compared to other similar sources in the machine. A number of signal processing methods have been applied to improve the early defect detection of rolling element bearings and it is often said that focusing on the higher frequencies of the signals should be more successful because sharp impacts generate high frequencies and this has the added advantage of less background noise interference [6, 10]. Additionally a CM programme would track the severity of the fault allowing accurate prediction of bearing failure and timely corrective action to extend bearing life and minimize associated costs.
1.5 Literature Survey for Bearing Monitoring Methods
Localised defects are the most common failure mode for rolling element bearings with many problems in motor operations due to faulty bearings. These typically occur during operation when a significant piece of material is dislodged from the contact surface. Fatigue cracks due to cyclic contact stresses are a common cause [28]. Consequently, in industry there is an emphasis on fault detection and diagnosis of localized defects.
Correct defect diagnosis depends on using suitable signal analysis techniques. The vibration signal from the transducer will be complex (the sum of many different sources), non-stationary (the fault is developing) and contaminated by background noise. Processing of the signal is necessary to extract useful information related to any bearing fault. They are many signal processing techniques available; all fall into one of three categories: time-domain, frequency-domain and time-frequency domain [29]. These are briefly reviewed below.
1.5.1 Time Domain Analysis
The time-domain signal represents the time history of the energy contained in the signal and is dominated by the most energetic or “noisiest” elements. Time-domain measurement is often considered the simplest of the measurement techniques and requires relatively inexpensive and unsophisticated instrumentation. In the time-domain, a defect condition is often detected and evaluated using statistic descriptors of the vibration signal, such as the peak value, RMS, crest factor or kurtosis [30]. For a fault to be detected from the peak level or RMS value of the time-domain signal it must have progressed sufficiently to be seen “through” the background noise.
Analogue time-domain signals are considered continuous but with digital sampling the magnitude of the signal is collected at a sampling rate which should be at least twice the maximum frequency of interest. Time-domain signals can provide large amounts of useful information but this will usually require further analysis of the signal to extract important characteristics not readily observable. Some of the more common techniques used are explained below.
The RMS (or possibly the peak) value of the vibration signal can be produced as an ink trace on a chart and analysed visually, or simple statistical analysis is carried out and the values obtained examined to determine that they are within acceptable limits. These statistical parameters are often trended to better detect the early presence of bearing damage.
The most commonly used parameters are RMS, peak value, crest factor and kurtosis [29]. These values for a damaged bearing tend to be greater than the values for a normal bearing. Both RMS and peak values of the vibration signal increase with the onset and growth of a fault and by comparing these with values determined for acceptable operation of a normal bearing, the presence of a defect and its severity can be found.
28 Crest factor and kurtosis are not amplitude dependent; they are measures of the variability or spikiness of the vibration signal. Crest factor and kurtosis are most useful in the early stages of bearing damage when the spikiness of the vibration signal increases noticeably. Unfortunately, as the damage increases, the vibration signal takes on a more random appearance and the magnitudes of crest factor and kurtosis reduce back to those for more normal operation. Crest factor and kurtosis are thus not suited to the detection of bearing defects at later stages. Skew values of the rectified vibration signal were used [31] for the early detection of bearing faults and found able to detect bearing faults at an early stage. It was also found that the results obtained were largely independent of load and speed.
Heng and Nor [32] investigated the application of crest factor, kurtosis and skew to sound pressure and vibration signals in order to detect defects in a rolling element bearing. These authors also compared statistical parameters derived from the beta distribution to separate healthy and faulty cases. It was found that statistical methods can be used to identify different defects present in bearings. It was also demonstrated that there was no significant benefit gained from using the beta function parameters rather than kurtosis and crest factor.
1.5.2 Frequency Domain Analysis
With time domain parameters such as the RMS value, the contribution of an incipient fault will usually be swamped in the overall vibration signal. This is a severe limitation of time domain analysis that is largely overcome by frequency domain analysis. Because each component of a gear has its own characteristic frequency so does any fault associated with that component. These frequency signatures, or signal spectral content, are a good key to determining bearing condition. These signatures will not be lost in the overall signal because they appear at distinct frequencies. The FFT of the vibration signal is the most common
method for converting the time domain to the frequency domain. Trending of the frequency components is a common approach [32].
As a fault develops in a bearing component peaks appear in the vibration spectrum at the bearing defect frequency and its harmonics associated with that bearing component. Around each peak there are side bands. The separation of the side bands is complex and can depend on such factor as transmission path and any periodicities in the load, the amplitudes of the frequency peaks increase with fault severity. For an old, worn system the signal to noise ratio (SNR) will be low and the spectrum will contain a very large number of frequency peaks. In these circumstances it becomes almost impossible to separate out the peak(s) due to a single fault. For frequency analysis using the FFT this is a serious problem [32].
The article [33] entitled "On Initial Fault Detection of A Tapered Roller Bearing: Frequency Domain Analysis" reported an investigation of the vibration frequency spectrum of a defective roller bearing subject to different loads. Both multiple and single point defects located at arbitrary positions were studied. It was found that the peaks at the defect frequency and its harmonics produced by a single point defect on the bearing had an "equal frequency spacing distribution" pattern. It was confirmed that around each peak there were sidebands whose frequencies were related to the periodicity of the load and were a function of the transmission path. For multiple defects the frequency characteristics were found to be the superposition of the frequency characteristics for each defect separately, though this linear relation may have been due to the limited magnitude of the defects.
The most common frequency analysis technique used for detection and diagnosis of bearing faults is envelope analysis [34][35][94, 96, 97]. The technique is reported in details in [34], consider a localised defect hitting a raceway, each time the defect hits the raceway an
30 impulsive force (wide frequency content) is generated. This will excite structural resonances in the transmission bath between the point of impact and the point of measurement. Envelope analysis is a mechanism for extracting the periodic excitation or the amplitude modulation of the resonance allowing the presence and location of a defect to be detected. The envelope analysis will be thoroughly investigated in Chapter Three in Section 3.3.3 as the envelope has been used as a method in this research because of its widespread and effectiveness use in bearing diagnosis.
1.5.3 Time-Frequency Domain Analysis
The FFT transforms a time domain signal to the frequency domain information about the time domain signal is lost. Time-frequency domain techniques, however, contain both time and frequency domain information which enables investigation of such transient features as impacts. Time-frequency techniques include, for example, the Short Time Frequency Transform (STFT), the Wavelet Transform (WT) and the Wigner-Ville Distribution (WVD). These techniques are claimed to have the ability to detect and diagnose bearing faults in rotating machines where the SNR is low and a large number of frequency components are present [35].
Li and Ma present the use of the Wavelet Transform for detection of local defects in bearings [36]. The uncertainty principle means that good resolutions in either time or frequency-domains can only be achieved by loss of precision in the other [37]. The WT provides a method of scaling the time window to match the frequency of interest and minimize any compromise between time and frequency domains. WTs have been successfully applied to the periodic structural ringing generated by repeated impulsive forces induced by a rolling element passing over a defect [38]. The method was confirmed using experimental data collected from bearings with defects at different locations operating under different load
conditions [38]. The wavelet transform will be looked at in more details in Chapter Three in Section 3.3.4. The wavelet transform is also used in this research for bearings detection and diagnosis.
The article [39] entitled "Wavelet Packet Feature Extraction for Vibration Monitoring" argues that Fourier analysis provides a poor representation of signals well-localized in time because the FFT assumes a stationary signal and contains no information on when an event occurred. The article used the WT as a means of extracting time frequency information from the vibration signal but used statistically based feature selection to discard a large number of features containing little or no useful information this left a feature subset with a substantially reduced number of parameters. Such an approach is useful because it can substantially reduce neural network (NN) classifier training times and increase the ability of the NN classifier to generalise.
1.5.4 Higher Order Spectral Analysis
Higher Order Spectra can determine the phase correlation between different frequencies present in a vibration signal. The presence of a defect in a bearing will generate large values of phase correlation between the harmonics of one (or more) of the defect frequencies [40].
In rolling element bearings bicoherence spectra have been used for automatic detection and diagnosis of localized defects by finding features that indicate the condition of the bearing [40]. The article discussed which features best describe the degree of phase correlation between three harmonics of the characteristic fault frequencies of the bearing [40]. Bicoherence theory was used to detect local bearing defects and it was shown experimentally that the method was effective in detection and diagnosis of incipient bearing defects.
32 Some researchers have discussed the use of bispectral and trispectral analysis for condition monitoring [40]. They investigated Higher Order Spectra analysis of machine vibrations to determine useful diagnostic features. The experimental work was carried out on a based on a small test rig subjected to bearing faults. The bispectrum or trispectrum of the vibration signal were used as input features to train a NN classifier to determine the condition of the bearings. The researchers then compared the technique with simpler statistical feature and power spectral extraction algorithms and undertook a more detailed investigation of the HoS of the signals to obtain practical features that can be easily estimated to provide readily available improved diagnostic information about the bearings.
There are many other methods for classification, common to that are data-driven methods which is the desired system output modelling using historical data, and not necessarily of the system mechanics, these techniques include conventional numerical algorithms such as that are normally found in the machine learning and data mining areas. The latter algorithms encompass artificial neural networks (ANNs), Support Vector Machines (SVMs), fuzzy logic and decision trees etc. We enumerate below the most popular data-driven methods for fault diagnosis are enumerated below. The review given in [41] provides an extensive overview over data-driven methods in the context of computational intelligence.
1.5.5 Neural Networks Approach
With the Neural Networks (NNs) approach, bearing fault diagnosis is viewed as a pattern recognition problem. Standard techniques are used to extract features from the vibration signals which are then used for training NNs to match the features to a specified condition of the bearing (typically normal, fault 1, fault 2, etc.).
The extraction method must be such that features obtained for different classes of fault form well separated clusters in the feature space. The performance attained with the NN approach depends strongly on the method of feature extraction.
Two researchers [42] report the results obtained from two NN based approaches; a multi-layer feed forward NN trained using an Error Back Propagation (EBP) technique and an unsupervised Adaptive Resonance Theory-2 (ART2) based NN. These two methods were applied to the automatic detection/diagnosis of local defects in ball bearings. The vibration signal was recorded for defective and normal bearings for a range of speeds and loads. Statistical measures of the signals were extracted and used as features to train the NNs. The outputs of each NN denoted the state of the ball bearing; the success rate of the EBP technique was more than 95%, while that of the ART network was even better, 100%. The latter was also found to be very fast.
One researcher [43] has described how bearing vibration can play an important role in the performance of driven motor systems. In many cases they found the accuracy of controlling devices were strongly dependent on the dynamic performance of the bearings of the motor. Thus, fault detection of a motor system is directly related to the diagnosis of the bearing assembly. These authors examined the use of the vibration frequency features of bearings for identifying bearing faults. Next, they discussed a method of fault diagnosis using NN and features from time frequency-domain analysis of bearing vibration. Using both real-world testing and simulation they demonstrated that such a system can effectively detect a number of motor bearing faults. Others have analysed the vibration spectra of bearings using fuzzy logic and showed that fuzzy logic could be usefully applied for accurate diagnosis of bearing faults if the input data was processed appropriately [44].
34
1.5.6 Support Vector Machines
Neural Networks (ANNs) have been proven that they are good classifiers, but yet they need huge number of samples for training, and that is not at all times true in practice [45]. Support vector machines (SVMs) are based on the theory of statistical learning and they focus on a smaller number of samples. SVMs have better generalisation than ANNs and assure the global and local optimal solution similar to that attained by ANN [46]. Recently, SVMs have been tested to be good and effective in numerous real-world scenarios [47, 48]. As it is difficult to gain enough fault samples in practice, SVMs have been used on applications for machinery defect diagnosis by different researchers in recent years [49-51]. Envelop spectrum of intrinsic mode function has been used as input data to SVMs for bearing defects classification, also improved wavelet transform and SVMs have been applied for bearing defects detection [51].
SVM is developed from the optimal separation plane under linearly distinguishable condition. Its fundamental principle can be demonstrated in two-dimensional manner. Generally, the SVM attempts to put a linear boundary between two categories of data and orients them in such manner that the margin is enlarged and the distance separates the boundary and the closest point of data in each category is maximal. The closest points of data are used to identify the margin and are named as support vectors.
1.5.7 Fuzzy Logic
The rule of Fuzzy based systems employ fuzzy logic for inference. Fuzzy logic method is based on the concept or the theory of fuzzy set in a way that binary set has been extended to take in partial membership that range between 0 and 1 [52]. By contrast to other similar techniques, fuzzy sets have gradual transitions between defined sets, which permit to directly
model the uncertainty associated with these concepts. The mapping of inputs data to outputs can be considered as a set of IF-THEN rules and that after identifying each model variable with a series of overlapping fuzzy sets, this process completely determined from expert knowledge, or from data. Nevertheless, unlike neural networks, fuzzy models tend to a rule explosion, for instance, the number of rules increase exponentially if the number of variables or fuzzy sets per variable increases that makes it complicated to identify the whole model from the knowledge of an expert only [53]. There are different automated techniques have been used recently for optimising fuzzy models [53], including neural networks and genetic algorithms.
The fuzzy sets and rules are depended on the knowledge-base of fuzzy model. Inputs to the fuzzy model are initially fuzzified via the knowledge-base; the rules are processed by a fuzzy inference engine via a fuzzy inference procedure [54], then the fuzzy surface solution resulted from the conduction of the rule-base is defuzzified to generate the system output(s). Fuzzy IF-THEN rules can also be comprised of functional consequents, typically of a linear or polynomial form [55, 56]. The crisp inputs are fuzzified according to the fuzzy set definitions, joint via the inference engine, and the functional consequents are weighted which result from the implementation of the rules. The overall outcome is the equations weighted average as more than a rule can positively fire during a single pass of the rule-base. Fuzzy logic has found numerous successful applications in which the fuzzy rule-based systems are capable to be built by processing historical data and therefore shaping a data-driven model.
1.5.8 Model-Based Techniques
Model based techniques attempt to match a mathematical model to an electrical, mechanical or other physical system. Here a mechanical bearing would be modelled is that its output matched the vibration response of the bearing with and without faults present. A
36 comprehensive model would include effect due to unbalance, misalignment, etc., to produce the overall response of the system.
A model that described the vibration response of a rolling element bearing has been developed [57], the bearing was subjected to constant radial load with a single point defect on the inner race. This model was relatively sophisticated and included the effects of shaft speed, bearing geometry, load distribution and transfer function. Comparison of measured and predicted vibration spectra confirmed the model performed satisfactorily.
A general model has been established for the vibration signals produced by a faulty rolling element bearing [58]. For low shaft speeds they were able to derive the system’s envelope-autocorrelation function. A simplified version of the model was used for bearing condition monitoring. Measured and simulated data were compared and the validity and effectiveness of envelope-autocorrelation confirmed for effective fault detection for shaft bearings at low speeds.
A one-dimensional, multiple degree-of-freedom model has been developed for fault detection using the vibration produced by rolling element bearings in a rotor-bearing system [59]. The faults were situated on the outer and inner raceways. Two outputs (inner and outer ring acceleration) were defined based on the theory of Detection Filter Design. It also has been reported that a robust monitoring system which integrated a sliding mode detector capable of isolating fault surfaces in the residual space of the detection filter [59].
1.5.9 Bearing Prognostics Using Vibration Signatures
An important area of condition monitoring research is the prediction of the remaining life of a bearing, which many bearing manufacturers take into account, using trends extracted from the vibration signal. However, relatively few papers have been published on bearing
prognosis because (i) usually, there is insufficient vibration data available and (ii) the difficulty in estimating the remaining life of a bearing even with an accurate vibration history [60]. Most papers in this field are concerned with statistical life estimation using data from laboratory experiments.
Currently most calculations of the fatigue life of a bearing are based on the Standard Life Rating formula provided by ANSI/AFBMA and which is based on the fatigue life theory [60]:
=
where is the rolling contact fatigue life in × 10 ,
1 is a reliability factor,
2 is a material factor,
3 is a lubrication factor,
is the basic load rating of the bearing,
is the equivalent load applied to the bearing, and is3 for ball bearings and10/3 for roller bearings.
However, real life conditions may depart quite severely from those assumed in the above calculation so the expected and actual lives of a bearing can differ significantly. Thus estimation of remaining life based on online vibration measurement is receiving considerable attention.
A number of tests on bearings have been conducted in which ran for between 100 to 900 hours before failing [61]. The tests included bearings with inner race, outer race and ball defects. The RMS, peak, crest factor and kurtosis of the vibration signal in the frequency
38 band 5.0 -12.5 kHz were measured and trended in the tests. It was found that the RMS was particularly useful for predicting the bearing’s remaining life.
The remaining life of a bearing has been estimated using a defect propagation model [62]. The relation of the RMS of the vibration signal in the frequency band 3.0-5.0 kHz to defect size was found in the form of a linear equation. By comparing measured and predicted defect sizes it was possible to develop an adaptive algorithm to fine-tune the parameters of the model. This allowed the rate of defect propagation to be determined from which it was possible to determine an accurate estimate of the bearing’s remaining life.
1.5.10 Acoustic Emission Monitoring
Acoustic Emission (AE) has been defines as “transient elastic waves generated from a rapid release of strain energy caused by a deformation or damage within or on the surface of a material [63]. In the application to rotating machinery monitoring, AE are defined as transient elastic waves generated by the interaction of two media in relative motion. Sources of AE in rotating machinery include impacting, cyclic fatigue, friction, turbulence, material loss, cavitations, leakage, etc. For instance, the interaction of surface asperities and impingement of the bearing rollers over a defect on an outer race will result in the generation of AE.”
Most AE sources are due to material damage of some form, thus monitoring of AE is commonly used to detect and/or predict material failure. In industry AE is widely used for the detection of leakage in high pressure vessels and piping systems. One of the advantages of AE monitoring is that it can detect the growth of subsurface cracks. Hence, it is an important tool for condition monitoring and it is one of the most effective methods [64].
Generally AE signal processing has as its goal either determining a suitable ‘process model’ from which the properties of specific variables can be used to define the wave state; or the
creation of a feature data base so that changes in the characteristics of the wave can be monitored. The important problem with processing AE signals is elimination of noise and to extract features that correlate uniquely with target process parameters [65, 66].
AE signals are often classified as continuous or burst-type [67]. In fact continuous AE signals are those where the bursts are sufficiently frequent for the overall signal to have a continuous appearance. Both types are seen during crack growth, material fracture or chipping.
Once AE signal parameters have been established for a healthy configuration, the RMS (or another suitable characteristic) of the AE signal may be monitored and compared to the nominally healthy values to detect the presence of an abnormal event. It has been shown that such monitoring can detect defects before the defects can be detected the vibration signal [68-69]. Also it has been shown that peak amplitude and count for the AE signal have been particularly useful in the detection of defects in ball bearings under load at normal and low speeds [70]. AE monitoring has been applied to detection of faults in rolling element bearings and has proposed the area under the time-amplitude plot as a preferred method for defect detection [71]. The RMS of the AE signal has been successfully used to determine milling tool breakage during the cutting process [72].
At its present stage of development the major disadvantage of commercial AE systems is that they can give only qualitative estimates of how much the test material has been damaged and only estimate the remaining life of a component. Consequently, other non-destructive testing methods are needed for a more rigorous examination and to provide quantitative predictions. While the frequency range of the AE signals used to monitor machinery and equipment is usually well outside the range of background noise nevertheless AE signals are usually weak and must be measured in the vicinity of their generation. Because the AE signals are weak
40 reduction of noise present in the signal and signal discrimination can be difficult but are necessary for successful application.
1.6 Research Motivation
Many novel and interesting CM methods have been developed in recent years [5]; however, the challenge will always remain of producing a CM system capable of detecting and identifying the presence of a fault at ever earlier stages of its development. This research is focused on the development of an approach based on advanced computations to detect and diagnose bearing condition.
The first motive for this project is that it is important to detect bearing defects as early as possible to provide maximum time for corrective action preventing further damage and extending bearing life. Without such early detection, maintenance staff must wait until the later stages of the fault by which time the damage has become both more severe and extensive.
The second motive is more personal, to be the first to attempt a novel approach to bearing fault diagnosis and detection. Time Encoded Signal Processing and Recognition (TESPAR) is a set of signal analysis and classification software that can be used to describe and classify band limited signals [73].
The use of TESPAR in the context of signal processing is not completely novel there is already work and some publications especially on speech recognition in electronic field as
mentioned here: King R A, Gosling W, 'Time Encoded Speech', Electronics Letters, 20 July
1978, also King R. A. & Phipps T.C. “Shannon, TESPAR and Approximation Strategies September 1998 and Vu V V and King R A; “Automatic Diagnostic and Assessment Procedures for the Comparison and Optimisation of Time Encoded Speech (TES) DVI
systems” September 1989. In addition, in the context of condition monitoring the TESPAR S and A matrices have been used generally to analyse the input data there are few publications such as : Rodwell G M and King R A, “TESPAR/FANN Architectures for low-power, low cost Condition Monitoring Applications” July 1996, and George M H, ‘Time for TESPAR’, Condition Monitor Number 105, September 1995. However, the novelty of this research is the adaption of the approach using a new feature and statistics with TESPAR matrices to identify bearing conditions in both fault location and severity.
The history and development of TESPAR is described in Chapter 4. Here it is sufficient to say that originally TESPAR was developed to process speech waveforms which are known to be very complex and highly dynamic [74], an approach which could be useful for the analysis of impulsive vibration signals. The idea here is to use this technique to explore fault detection in a bearing rolling element and to compare the capability and effectiveness of TESPAR based methods with more traditional techniques in terms of identifying the onset of a defect in different bearing elements. These traditional techniques are described thoroughly in Chapter Three and will include time domain analysis, frequency domain analysis and wavelet analysis.
Specifically the idea of using the TESPAR approach as a focus for this research comes from the observation that almost all current commonly used bearing CM techniques are frequency domain or time frequency domain, and that there are insufficient studies in the time domain, of course, except the use of very basic statistics parameters, thus, this research considers a new focus in the time domain by investigating and exploring the application of TESPAR to fault detection and diagnosis.
42 During this research the following TESPAR benefits that exist over other existing methods have been identified:
Early Fault Detection & Identification: TESPAR is able to utilise its classification capability to identify faults at the earliest stages of their inception. Once detected, any fault can either be repaired or continuously monitored to identify changes in its severity and if appropriate, predict the time duration before a catastrophic failure.
Low Power and Low Processor/Memory Solution: TESPAR requires two orders of magnitude less processing power and memory than its frequency domain counterparts which opens up the prospect of bringing real-time condition monitoring to devices possessing much less processing power than a DSP (Digital Signal Processor). Moreover, a significant reduction in battery power is required which provides a greater scope for tackling problems previously consider infeasible because of the amount of operating current required. This reduction in processing power and memory has enabled a real-time TESPAR classification to be successfully implemented to a number of low-end processors such as the 8-bit Intel 8051 and the ARM 7 core.
Improve Existing Classification System by Running TESPAR Solution in Parallel: If a traditional frequency-based system is already monitoring a piece of machinery, in many cases it is possible to also implement the TESPAR solution in parallel with the existing approach by using only the spare capacity of the current processor (e.g. DSP). This is achievable because of the small footprint and processing requirements of the TESPAR approach. This parallel methodology allows the advantages of TESPAR to be realised without having the expense or inconvenience of replacing the current system.
Applicable Across a Wide Range of Sensor Types: TESPAR has been applied to signals from a wide range of sensors including Accelerometers, Vibration, Acoustic emission, Densitometers (nucleonic devices), Pressure, Temperature, Geophones / Hydrophones etc. An important advantage of TESPAR is that it does not rely on expensive high quality sensors in order to successfully achieve its objective – unlike some tradition condition monitoring systems. In a number of real-world case studies, Tespar have achieved similar high levels of performance from both cheap (£10) and expensive (£2000) sensors.
Low False Alarms and Misclassifications: TESPAR achieves a low number of misclassifications and false alarms by coupling the flexibility of the TESPAR “coding table”, the information rich TESPAR symbol stream / matrices, with appropriate highly accurate classification tools. The TESPAR solution effectively groups the faults into feature space clusters and by selecting the appropriate TESPAR processing configuration:
o The elements within these clusters become more tightly grouped and
o Separations between different clusters become more clearly defined
o Thus causing a reduction in the number of misclassifications and false alarms.
Resistant to Noisy Signals: TESPAR is highly resistant to noise that may be present and as a result has a significant advantage over traditional frequency based approaches. The TESPAR solution can extract signals from heavy noise contamination even at noise levels of 0dB. There are a number of TESPAR processing techniques that can be used to significantly reduce the effects of noise effects such as white noise and impulse noise. One such advantage over the traditional frequency based domain is in the presence of impulse noise – this typically presents itself across a large proportion of the frequency spectrum, which typically results in a
44 inferior classification accuracy. Conversely in the TESPAR time domain, the impulse noise only appears as one or two epochs in the Tespar vector and so can easily be excluded from the classification.
Accurate Identification of Fault Source: Using TESPAR for fault detection and prediction allows the fault source to be accurately identified in a number of ways:
o Each fault type to be detected can be assigned one or more of the various
TESPAR feature sets / matrices
o The output of different sensor types can, if required, be combined using
higher-level logic to obtain more than one view of the potential fault
o If a repetitive action is associated with the machinery under test, not only can
the fault be detected by examining the TESPAR symbols, it will also be possible to identify its cyclic nature and therefore pinpoint the offending component. Moreover, if a piece of machinery is expected to operate at a known rotational speed, specific TESPAR matrices have been developed to indicate the extent to which the machine has deviated from the expected rotation speed.
Model Adaptation: Once TESPAR models have been generated for each condition to be recognised, it is possible to easily adapt these TESPAR models (matrix archetypes) to ensure that any natural deviation in the machinery’s operating condition can be incorporated in real-time into the model.
Fault Level Intensity Indicator: A number of techniques exist that allow the output of the TESPAR classification stage to be represented on a linear scale in order that a meaningful level of fault intensity/severity can be calculated. I.e. The profile of the TESPAR matrices and other feature vectors can be displayed on a scale such that a 1 implies low severity and a 10 implies a high severity.
Provide Continuous Real-Time Monitoring: As TESPAR requires little processing overhead, this approach can easily support continuous real-time monitoring.
1.7 Research Aim and Objectives
The aim of this research is to investigate the development of an efficient technique using TESPAR for the more reliable, cost efficient and precise detection and diagnosis of incipient bearing faults.
The main objectives of this research are:
Objective one: To present and discuss machine condition monitoring and the applications of rolling element bearings.
Objective two: To describe the fundamentals of rolling bearing transmission, including bearing types and components, their failure modes and methods of monitoring.
Objective three: To review signal processing conventional methods and their parameters of bearing fault detection and diagnosis using vibration signal.
Objective four: To describe and explore the fundamentals of the TESPAR approach.
Objective five: To discuss and analyse the data outputs from an accelerometer using TESPAR methods applied to the time domain data collected for ten different bearing conditions.
Objective six: To perform a relative evaluation performance of the TESPAR application in order to explore its effectiveness and reliability on bearing detection compared to conventional techniques.
46
1.8 Thesis Organisation
The thesis begins by reviewing the importance of condition monitoring and fault diagnosis for the smooth running of industrial processes. It emphasises vibration measurement as this is the technique selected in this project for monitoring the rolling element bearings. The motivation for this research is described and the aim and objectives stated.
Chapter two describes the different types of roller bearing and their component parts. It also describes the typical bearing defects that occur and shows that, generally, such defects are due to inadequate maintenance or improper installation. The chapter then reviews dynamic response of roller bearings to local (or point) defects and shows that the typical symptoms are characteristic peaks in the vibration spectrum. Theoretical predictions of the characteristic frequencies for the test bearing are compared with measured results.
Chapter three introduces vibration measurement as a method of condition monitoring and defect detection in roller bearings. It reviews time domain, frequency domain and time-frequency domain analysis of the vibration signal from roller bearings and compares their performance regarding incipient fault detection and diagnosis. Various commonly used statistical parameters are described and their usefulness for incipient fault detection commented on. Chapter four describes the TESPAR technique as being a technique explored by this research, its background is given and an introduction to how it works. The chapter also gives examples of TESPAR in action. In order to provide a new insight into fault detection and diagnosis, simulation of TESPAR has been conducted to illustrate its principles. Finally, the TESPAR coding and implementation process is explained in details leading to the new procedure adopted.
![Figure 2-3 Schematic of cylindrical roller bearing [100]](https://thumb-us.123doks.com/thumbv2/123dok_us/523273.2561599/53.892.117.785.595.859/figure-schematic-of-cylindrical-roller-bearing.webp)
![Figure 2-9 Bearing spalling [110]](https://thumb-us.123doks.com/thumbv2/123dok_us/523273.2561599/64.892.114.729.209.406/figure-bearing-spalling.webp)
![Figure 2-11 Bearing cage damage [110]](https://thumb-us.123doks.com/thumbv2/123dok_us/523273.2561599/65.892.126.731.107.307/figure-bearing-cage-damage.webp)
![Figure 3-1 Simple example of modulation of carrier wave to produce a modulated wave (here signals have amplitudes = 1) [136]](https://thumb-us.123doks.com/thumbv2/123dok_us/523273.2561599/83.892.202.634.753.1073/figure-simple-example-modulation-carrier-produce-modulated-amplitudes.webp)
![Figure 3-4 Amplitude modulation of the envelope signal for fault on inner race [145]](https://thumb-us.123doks.com/thumbv2/123dok_us/523273.2561599/89.892.324.587.537.904/figure-amplitude-modulation-envelope-signal-fault-inner-race.webp)
![Figure 3-5 Four common Daubechies wavelets, clockwise from top left db = 2, db = 3, db = 8 and db = 4, [149]](https://thumb-us.123doks.com/thumbv2/123dok_us/523273.2561599/94.892.113.790.487.758/figure-common-daubechies-wavelets-clockwise-left-db-db.webp)
![Figure 4-1 Infinite clipping: only zero crossing information preserved [74]](https://thumb-us.123doks.com/thumbv2/123dok_us/523273.2561599/99.892.270.666.108.363/figure-infinite-clipping-zero-crossing-information-preserved.webp)