Zurich Open Repository and Archive University of Zurich Main Library Strickhofstrasse 39 CH-8057 Zurich www.zora.uzh.ch Year: 2018
Magnetic Resonance Imaging-Based Grading of Cartilaginous Bone Tumors:
Added Value of Quantitative Texture Analysis
Fritz, Benjamin ; Müller, Daniel A ; Sutter, Reto ; Wurnig, Moritz C ; Wagner, Matthias W ; Pfirrmann, Christian W A ; Fischer, Michael A
Abstract: OBJECTIVES The aim of this study was to assess the interreader agreement and diagnos-tic accuracy of morphologic magnediagnos-tic resonance imaging (MRI) analysis and quantitative MRI-based texture analysis (TA) for grading of cartilaginous bone tumors. MATERIALS AND METHODS This retrospective study was approved by our local ethics committee. Magnetic resonance imaging scans of 116 cartilaginous bone neoplasms were included (53 chondromas, 26 low-grade chondrosarcomas, 37 high-grade chondrosarcomas). Two musculoskeletal radiologists blinded to patient data separately analyzed 14 morphologic MRI features consisting of tumor and peritumoral characteristics. In addition, 2 dif-ferent musculoskeletal radiologists separately performed TA including 19 quantitative TA parameters in a similar fashion. Interreader reliability, univariate, multivariate, and receiver operating characteristics analyses were performed for MRI and TA parameters separately and for combined models to determine independent predictors and diagnostic accuracy for grading of cartilaginous neoplasms. P values of 0.05 and less were considered statistically significant. RESULTS Between both readers, MRI and TA features showed a mean kappa value of 0.49 (range, 0.08-0.82) and a mean intraclass correlation coefficient of 0.79 (range, 0.43-0.99), respectively. Independent morphological MRI predictors for grading of cartilaginous neoplasms were bone marrow edema, soft tissue mass, maximum tumor extent, and active periostitis, whereas TA predictors consisted of short-run high gray-level emphasis, skewness, and gray-level and run-length nonuniformity. Diagnostic accuracies for differentiation of benign from malignant as well as for benign from low-grade cartilaginous lesions were 87.0% and 77.4% using MRI predictors exclusively, 89.8% and 89.5% using TA predictors exclusively, and 92.9% and 91.2% using a combined model of MRI and TA predictors, respectively. For differentiation of low-grade from high-grade chondrosarcoma, no statistically significant independent TA predictors existed, whereas a model containing MRI predictors exclusively had a diagnostic accuracy of 84.8%. CONCLUSIONS Texture analysis improves diagnostic accuracy for differentiation of benign and malignant as well as for benign and low-grade cartilaginous lesions when compared with morphologic MRI analysis.
DOI: https://doi.org/10.1097/RLI.0000000000000486
Posted at the Zurich Open Repository and Archive, University of Zurich ZORA URL: https://doi.org/10.5167/uzh-153664
Journal Article Published Version Originally published at:
Bone Tumors: Added Value of Quantitative Texture Analysis. Investigative Radiology, 53(11):663-672. DOI: https://doi.org/10.1097/RLI.0000000000000486
Magnetic Resonance Imaging
–
Based Grading
of Cartilaginous Bone Tumors
Added Value of Quantitative Texture Analysis
Benjamin Fritz, MD,*†
Daniel A. Müller, MD,†‡
Reto Sutter, MD,*†
Moritz C. Wurnig, MD, MSc,†§
Matthias W. Wagner, MD,†§ Christian W.A. Pfirrmann, MD, MBA,*†
and Michael A. Fischer, MD*†
Objectives:The aim of this study was to assess the interreader agreement and di-agnostic accuracy of morphologic magnetic resonance imaging (MRI) analysis and quantitative MRI-based texture analysis (TA) for grading of cartilaginous bone tumors.
Materials and Methods:This retrospective study was approved by our local ethics committee. Magnetic resonance imaging scans of 116 cartilaginous bone neoplasms were included (53 chondromas, 26 low-grade chondrosarcomas, 37 high-grade chondrosarcomas). Two musculoskeletal radiologists blinded to pa-tient data separately analyzed 14 morphologic MRI features consisting of tumor and peritumoral characteristics. In addition, 2 different musculoskeletal radiolo-gists separately performed TA including 19 quantitative TA parameters in a sim-ilar fashion. Interreader reliability, univariate, multivariate, and receiver operating characteristics analyses were performed for MRI and TA parameters separately and for combined models to determine independent predictors and diagnostic ac-curacy for grading of cartilaginous neoplasms.Pvalues of 0.05 and less were considered statistically significant.
Results:Between both readers, MRI and TA features showed a mean kappa value of 0.49 (range, 0.08–0.82) and a mean intraclass correlation coefficient of 0.79 (range, 0.43–0.99), respectively. Independent morphological MRI predictors for grading of cartilaginous neoplasms were bone marrow edema, soft tissue mass, maximum tumor extent, and active periostitis, whereas TA predictors consisted of short-run high gray-level emphasis, skewness, and gray-level and run-length nonuniformity. Diagnostic accuracies for differentiation of benign from malig-nant as well as for benign from low-grade cartilaginous lesions were 87.0% and 77.4% using MRI predictors exclusively, 89.8% and 89.5% using TA predic-tors exclusively, and 92.9% and 91.2% using a combined model of MRI and TA predictors, respectively. For differentiation of low-grade from high-grade chondrosarcoma, no statistically significant independent TA predictors existed, whereas a model containing MRI predictors exclusively had a diagnostic accu-racy of 84.8%.
Conclusions:Texture analysis improves diagnostic accuracy for differentiation of benign and malignant as well as for benign and low-grade cartilaginous lesions when compared with morphologic MRI analysis.
Key Words:cartilaginous neoplasms, enchondroma, chondrosarcoma, texture analysis, quantitative analysis, magnetic resonance imaging
Invest Radiol2018;00: 00–00)
C
artilaginous neoplasms are characterized by the production of chondroid matrix.1The majority of lesions are benign enchondromas,which can be found with a prevalence of 2.9% and 2.1% on knee and shoulder MRI examinations, respectively.2,3 Chondrosarcomas are less common but represent the second most common sarcoma of the bone with an annual incidence of approximately 1:200,000.4,5
Based on histopathological criteria, chondrosarcomas can be cat-egorized as grade 1 to 3, as well as into different subtypes including dedifferentiated chondrosarcoma.1,6 Grade 1 chondrosarcomas are low-grade tumors of intermediate malignancy with low rates of recur-rence and metastatic spread, which can be treated with intralesional cu-rettage and optional local adjuvant therapy.7–10Grade 2, grade 3, and dedifferentiated chondrosarcomas represent high-grade tumors with high rates of recurrence, metastatic spread, and mortality, which usually require surgical resection with wide margins and subsequent recon-struction or amputation.11–15
Because the reliable differentiation and grading of cartilaginous neoplasms can be a challenging task for radiologists and pathologists due to the overlap of imaging features and histopathological criteria of benign lesions and grade chondrosarcomas as well as low-grade and high-low-grade chondrosarcomas,16–20there is a need for more accurate techniques.
Classic magnetic resonance imaging (MRI) is often used for grading of cartilaginous neoplasms. Avariety of MRI features assessing tumor matrix, bone remodeling, and peritumoral tissue abnormalities have been described16,21–24; however, their interreader reproducibility and predictive values are to some extent unclear.24
Texture analysis is a novel objective biomarker for quantitative tumor assessment, which has shown encouraging results in tumors of the brain, lung, and liver.25–27Texture analysis is a mathematical tech-nique, which allows computerized quantification of image characteris-tics based on the distribution of pixels or voxels and their intensities within a defined region of interest (ROI). Although texture analysis (TA) is typically applied to characterize the tumor matrix, peritumoral abnormalities are usually not included in the analysis, although visible on MRI scans. Therefore, a combined approach of morphologic MRI anal-ysis and TA may show a complementary effect and potentially result in higher diagnostic accuracies. We aimed to assess the interreader agreement and diagnostic accuracy of MRI-based TA for grading of cartilaginous bone tumors in comparison to standard morphologic MRI analysis.
MATERIALS AND METHODS
This retrospective single-center study was approved by our local ethics committee.
Study Design and Patients
Patients with cartilaginous bone neoplasms who underwent contrast-enhanced MRI were identified through a search of our hospital and radiological information systems between January 2008 and December 2016. Inclusion criteria were (1) enchondromas or periosteal chondromas proven by histopathology (n = 16) or by a follow-up period of minimum 5 years without alteration in size and shape accompanied with typical imaging features of cartilaginous lesions including lobu-lated texture and T2-weighted hyperintensity on MRI (n = 37);
Received for publication February 7, 2018; and accepted for publication, after revision, April 17, 2018.
From the *Department of Radiology, Balgrist University Hospital;†Faculty of Medicine, University of Zurich;‡Department of Orthopedic Surgery, Balgrist University Hospital; and §Institute of Diagnostic and Interventional Radiology, University Hospital Zurich, Zurich, Switzerland.
The authors report no conflicts of interest.
Correspondence to: Benjamin Fritz, MD, Department of Radiology, Balgrist Uni-versity Hospital, Forchstrasse 340, CH-8008 Zurich, Switzerland. E-mail: [email protected].
Copyright © 2018 Wolters Kluwer Health, Inc. All rights reserved. ISSN: 0020-9996/18/0000–0000
DOI: 10.1097/RLI.0000000000000486
O
RIGINAL
A
RTICLE
(2) conventional central or periosteal chondrosarcomas grade 1–3 and dedifferentiated chondrosarcoma proven by histopathology (n = 63); (3) MRI of the cartilaginous neoplasm performed at a time interval of maximum 6 months before biopsy, curettage, or surgery for tumors di-agnosed by histopathology; and (4) contrast-enhanced MRI performed on clinical 1.5 T or 3 T scanners, including at least sequences ac-quired in 2 planes with T1-weighted (T1w) and contrast-enhanced T1w fat-suppressed (CE-T1wfs) images as well as at least one addi-tional fluid-sensitive fat-suppressed sequence. Exclusion criteria were (1) chondroma or chondrosarcoma of the spine, rips, scull, hands, or feet (n = 17); (2) extraskeletal chondrosarcoma (n = 5); (3) secondary chondrosarcoma due to a preexisting cartilaginous lesion, that is, aris-ing from enchondroma or osteochondroma (n = 6); (4) cartilaginous bone neoplasms of patients with enchondromatosis (Ollier disease); (5) pathological fracture in the area of the tumor (n = 4); (6) ambiguous histopathology report (n = 6); (7) insufficient image quality of the MRI (n = 6); and (8) locally recurrent chondrosarcoma (n = 4).
The final study population included 116 patients (62 women and 54 men) with a mean age of 48.8 ± 18.2 years (range, 15–88 years). Sixty-eight patients (58.6%) underwent MRI at our institution and 48 patients (41.4%) underwent MRI at outside institutions. The carti-laginous neoplasms consisted of 53 benign tumors (46 enchondromas and 7 periosteal chondromas), 26 low-grade chondrosarcomas (20 con-ventional chondrosarcomas and 6 periosteal chondrosarcomas), and 37 high-grade chondrosarcomas (24 grade 2/3 and 13 dedifferentiated chondrosarcomas; 31 conventional chondrosarcomas and 5 periosteal chondrosarcomas). The cartilaginous neoplasms were located in the fe-mur (n = 38), humerus (n = 29), pelvis (n = 17), tibia (n = 15), scapula (n = 9), fibula (n = 4), sternum (n = 2), radius (n = 1), and ulna (n = 1). The study design consisted of a qualitative morphologic read-out by 2 blinded expert musculoskeletal radiologists, who graded each le-sion according to clinical routine and determined the presence of 14 common MRI features of cartilaginous bone tumors, as well as a quan-titative assessment of tumor texture by 2 different musculoskeletal radiologists (Fig. 1).
Histopathology
Histopathology reports were reviewed respectively for the final diagnosis. At the time of diagnosis, the pathologists did not have elec-tronic access to the MRI examinations of the patients, which were stored in the picture archiving and communication system (PACS) of
a different institution. All included chondrosarcomas as well as 16 chondromas (all 7 periosteal chondromas and 9 enchondromas) were diagnosed based on the presence of hyaline cartilage production and classified according to cellularity, cellular atypia, myxoid change, and mitotic figures as well as entrapment or destruction of trabecu-lar bone.6,17,28,29The remaining 37 enchondromas were proven by a follow-up period of minimum 5 years without alteration of size and shape. For the histopathologically proven chondrosarcomas and chondromas, histopathologic diagnoses relied on resections of the entire tumors. Cartilaginous tumors were classified as benign for enchondromas and periosteal chondromas, as low-grade for chondrosarcomas grade 1, and as high-grade for chondrosarcomas grade 2, grade 3, and dedifferentiated chondrosarcomas.30
Morphologic MRI Analysis
Two experienced, fellowship-trained musculoskeletal radiolo-gists (readers 1 and 2, C.W.A.P. and R.S.) with 18 and 12 years of expe-rience in musculoskeletal radiology, respectively, evaluated the anonymized studies separately on dedicated PACS workstations. The readers were aware that all patients had a benign or malignant cartilag-inous neoplasm but were blinded to any other information, including the histopathological diagnosis, clinical course of the disease, and any additional imaging study. In preparation for the study evaluation, both readers underwent a joint training session on 15 cases with cartilaginous lesions that were not included in the study.
Readers were tasked to evaluate the studies for 14 MRI features that have been described for the differentiation of cartilaginous bone lesions16,21–24,31,32: (1) cortical thickening, defined as abnormal thick-ening of the osseous cortex bordering the tumor in comparison to adja-cent bone cortex without existing tumor interface; (2) scalloping of the cortical bone, defined as a focal thinning of the osseous cortex by the adjacent tumor; (3) cortical destruction, defined as a lytic or sclerotic process destroying the integrity and continuity of the cortical bone; (4) bone expansion, defined as focal distension and widening of the bone diameter by the tumor mass without destruction of the cortical in-tegrity; (5) active periostitis, defined as increased contrast enhancement of the periosteum and/or focal thin fluid accumulation adjacent to the periosteum; (6) bone marrow edema, defined as high signal intensity on fluid-sensitive fat-suppressed images inside the bone with preserved bone texture; (7) soft tissue edema, defined as high signal intensity on fluid-sensitive fat-suppressed images of the tumor surrounding soft tis-sue with or without contrast enhancement; (8) soft tistis-sue mass, defined as solid, extraosseous tumor mass with contrast enhancement replacing or displacing physiological tissue; (9) internal septal or ring-and-arc en-hancement, defined as an enhancement of scalloped and curvilinear septa31,32; (10) lobular outer margin, defined as a lobular pattern of the tumor boundary with contrast enhancement or fluid-like signal in-tensity; (11) central nonenhancing portion, defined as a confluent re-gion embedded inside the tumor lacking contrast enhancement; (12) intralesional enhancing solid portion was defined as confluent tumor tissue with marked homogenous enhancement; (13) fat inclusions were defined as focal lesions with fat-like signal surrounded by tumor tissue. Imaging features 1 to 13 were categorized on a binary scale into present or absent. Feature 14 was the maximum tumor extent, which was assessed by measuring the maximum tumor distance in millimeters in any plane or sequence.
In addition, both readers were asked to grade the cartilaginous neoplasms as benign, low grade, or high grade based on their impres-sion after review of all available MRI sequences and rate their confi-dence level on a scale from 0 to 10.
Texture Analysis
Based on the works of Vallières et al33 and Wei,34a custom Matlab-based software routine (Matlab; The MathWorks, Natick, MA) FIGURE 1. Illustration of the study design. The 116 cartilaginous bone
lesions were analyzed in 4 different ways. Derived models and expert diagnosis were compared using diagnostic accuracies represented by the area under the of ROC analysis.
was programmed in-house, that implemented a total of 19 different 2-dimensional (2D) TA features. The features consisted of 4 first-order rameters (variance, skewness, kurtosis, and entropy), 4 second-order pa-rameters (gray-level co-occurrence matrix features: energy, contrast, correlation, homogeneity), and 11 higher-order parameters (gray-level run-length matrix features: short-run emphasis, long-run emphasis, gray-level nonuniformity, run-length nonuniformity, run percentage, low gray-level run emphasis, high gray-level run emphasis, short-run low gray-level emphasis, short-short-run high gray-level emphasis, long-run low gray-level emphasis, and long-run high gray-level em-phasis) (see document, Supplemental Digital Content 1, for detailed explanation and formulas).35–38
Two experienced, fellowship-trained musculoskeletal radiolo-gists (reader 3 and 4, M.A.F. and B.F.) with 9 and 5 years of experience in musculoskeletal radiology, respectively, performed the texture analy-ses in an independent fashion. Readers selected the image with the larg-est tumor dimension and imported the DICOM image to Matlab. Preference was given to axial images; however, coronal images were the second, and sagittal images were the third choice (Fig. 2). For dis-tinction of solid tumor from peritumoral abnormalities, readers were allowed to examine all available sequences of the MRI on the PACS viewer. Next, readers segmented the tumor by drawing a free-hand ROI along the tumor border on T1w and CE-T1wfs images. The Matlab algorithm automatically performed a normalization of the gray levels and calculated all TA features based on the voxels inside the ROI.
Second- and higher-order features were calculated in 4 directions differ-ing from each other in a 45-degree angle with subsequent calculation of mean values for minimizing the relevance of the needed choice of direction (Fig. 3).
Statistics
Statistical analyses were performed using SPSS version 21.0 (IBM, Chicago, IL) and MedCalc version 17.6 (MedCalc Software bvba, Ostend, Belgium). General descriptive statistics were employed with continuous data being reported as mean and standard deviations and categorical data as proportions. Continuous data were tested for normal distribution using the Kolmogorov-Smirnoff test. A 2-sided
Pvalue of less than 0.05 was considered to represent significance. Reader performances for grading of cartilaginous lesions were determined by receiver operating characteristics (ROC) analysis with the incorporation of the confidence levels. For measuring interreader re-liability, we applied Cohen kappa for categorical data and intraclass cor-relation coefficient (ICC) for continuous data.39Kappa values were considered to represent substantial/good agreement if 0.61 to 0.8 and al-most perfect/very good agreement if greater than 0.8,40,41and ICC values were considered to represent good agreement if 0.6 to 0.74 and excellent agreement if 0.75 to 1.42Associations of MRI features and histological grades of cartilaginous neoplasms were tested using the Fisher exact test for dichotomous data and the independent Student
ttest for maximum tumor extent. Significant differences of TA features
FIGURE 2. A 60-year-old woman with an enchondroma of the proximal tibia. Sagittal STIR recovery (A) and axial contrast-enhanced T1w fat-saturated (B) MRI scans showing typical septal and ring-and-arc enhancement (arrowheads) with subtle lobular outer margin (white arrows) and cortical scalloping (black arrow) of the dorsal aspect of the tibia. Panel C shows the overlay of a free-hand ROI drawn on panel B, including the entire tumor as performed during TA. Subsequently, the TA algorithm automatically performs cropping and intensity normalization of the tumor texture, as shown in panel D, allowing for calculation of TA features (see Fig. 3). While 1 of the 2 expert readers graded this lesion incorrectly as chondrosarcoma grade I, TA graded this lesion correctly as enchondroma.
Investigative Radiology • Volume 00, Number 00, Month 2018 MRI-Based Grading of Cartilaginous Bone Tumors
between histological grades of cartilaginous neoplasms were assessed with the independentttest for parametric data and the Mann-Whitney
Utest for nonparametric data. For further statistical analysis, mean TA values of both readers (reader 3 and 4) and morphological features rated by the senior reader were used.
To create a model for prediction of tumor grade, stepwise lo-gistic regression analysis was performed separately and in combina-tion (ratio of 1:1 between MRI and TA features) for significant and reproducible (kappa or ICC value≥0.6) MRI and TA features. To avoid overfitting, a ratio of independent variable to cases was deter-mined to be 1:10. In case of exceeding the number of independent variables qualifying for inclusion into regression models, the fea-tures with the lowestPvalues were selected. Models were calculated with 5-fold cross-validation.
Independent predictors after regression analysis are reported with odds ratios and 95% confidence intervals (CIs),Pvalues, as well as the regression coefficient and standard error. For each model, sensi-tivity and specificity as well as the area under the curve (AUC) along with the 95% CI received from ROC analysis were calculated. Differ-ences between the models were calculated by comparison of the AUC of the ROC curves according to the method of DeLong et al.43
RESULTS Morphologic MRI Analysis
Expert Diagnosis
For reader 1 and for reader 2, the diagnostic accuracies repre-sented by the AUC were 0.862 (95% CI, 0.793–0.932) and 0.904 (0.841–0.966) for differentiation of benign from malignant lesions, 0.810 (0.709–0.911) and 0.875 (0.799–0.951) for differentiation of
benign from low-grade lesions, and 0.785 (0.671–0.899) and 0.682 (0.545–0.820) for differentiation of low-grade from high-grade lesions, respectively.
MRI Features
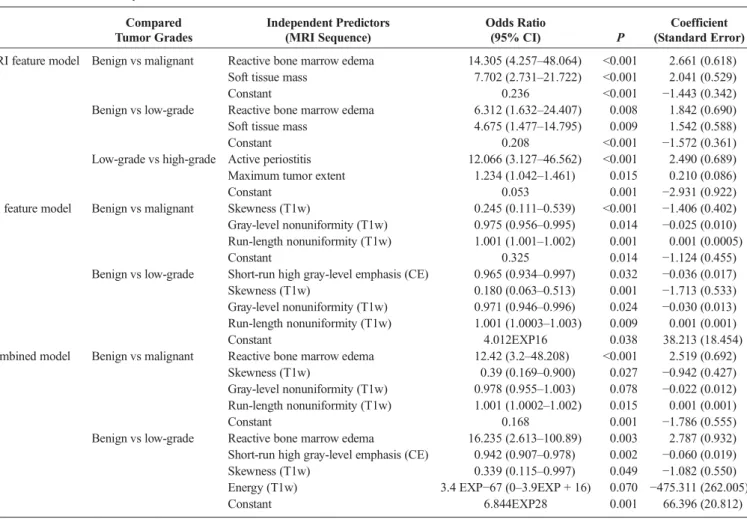
The frequency of the 14 MRI features and the interreader re-liability according to histological tumor grades, as well as the dis-crimination of benign versus malignant, benign versus low-grade, and low-grade versus high-grade cartilaginous neoplasms are pre-sented in Table 1. Significant MRI features of univariate analysis with a kappa value≥0.6 qualified as predictor variables for the re-gression models (Table 1). Derived independent imaging features for differentiation of benign from malignant, benign from low-grade, and low-grade from high-grade lesions are given in Table 2. Diagnostic accuracies represented by the AUC as well as sensitivities and specificities are presented in Table 3.
Texture Analysis
Intraclass correlation coefficient between reader 3 and reader 4 was calculated for each of the 19 TA features on T1w and CE-T1wfs se-quences separately, resulting in a mean ICC of 0.79 (standard deviation, 0.14; range, 0.43–0.99). In total, 18 TA features assessed on CE-T1wfs images and 15 TA features assessed on T1w images had at least good interobserver agreement with an ICC value of 0.6 or above. The mean value of each TA feature from both readers was calculated and used for analysis. Results of univariate analysis for differentiation of benign from malignant and benign from low-grade cartilaginous lesions are presented in Table 4. There were no significant TA features after univar-iate analysis for differentiation of low-grade from high-grade lesions. Only highly significant TA features of univariate analysis showing an FIGURE 3. Illustration of the TA algorithm. First, tumor segmentation was performed by drawing a free-hand ROI along the border of the tumor (column 1). Second, cropping and normalization of voxel gray levels inside the ROI was performed (column 2), as demonstrated by a simplified matrix containing gray levels ranging from 1 to 4. Third, histogram, gray level co-occurrence matrix, and gray level run-length matrix were calculated based on the gray level distribution of voxels (column 3). Examples of gray level co-occurrence and run-length matrix (calculated in horizontal orientation) are given in correspondence to the gray level matrix of column 2. Finally, first-order features were derived from the histogram, second-order features were derived from the gray level co-occurrence matrix, and higher-order features were derived from the gray level run-length matrix (column 4).
ICC value≥0.6 were included as predictor variables into regression models (Table 4). Derived independent TA features for discrimination of benign from malignant and benign from low-grade lesions are given in Table 2. The AUC, as well as sensitivities and specificities, are given in Table 3. Additional performed subanalysis on 81 patients that included T2w and short tau inversion recovery (STIR) images into TA showed no additional increase of the diagnostic accuracy for differentiation of benign from malignant, benign from low-grade, and low-grade from high-grade cartilaginous neoplasms.
Combined TA and Morphologic MRI Analysis
Predictor models including both morphologic MRI features and TA features were calculated similarly to the individual MRI or TA feature analyses. The regression model for differentiation of benign from malignant lesions included 5 MRI features and 5 TA features, whereas the regression model for differentiation of benign from low-grade lesions included 3 MRI features and 5 TA features (Table 1 and 4). As no significant TA features existed after univariate analysis for differentiation of low-grade from high-grade lesions, no regression model was calculated. Derived independent MRI and TA features for discrimination of benign from malignant and benign from low-grade lesions are given in Table 2. The AUCs, as well as sensitivities and specificities, are presented in Table 4 and Figure 4.
DISCUSSION
Accurate grading of cartilaginous bone neoplasms is of primary clinical interest, because appropriate therapy differs significantly be-tween different tumor grades, ranging from watchful waiting for benign
lesions, to intralesional curettage for low-grade chondrosarcoma, and wide resection or amputation for high-grade chondrosarcoma. However, both the radiological and histopathological grading of cartilaginous bone neoplasms are difficult, as shown by the low reproducibility of radiological and histopathological grading of 46 cartilaginous neo-plasms by expert readers.19Similarly, our study revealed a substantial variability of diagnostic accuracies in the grading of cartilaginous bone tumors by expert radiologists ranging from moderate to excel-lent. Thus, objective quantitative biomarkers are desirable to improve grading of cartilaginous neoplasms, especially for the clinically diffi-cult but important task of differentiating between benign and low-grade malignant lesions, as well as between low-low-grade and high-low-grade malignant lesions19(Fig. 5).
We analyzed the diagnostic value and interreader reproduc-ibility of established MRI features for grading of cartilaginous neoplasms.16,20–24,31,32,44Similar to a previous study of Crim et al,24 our study showed a large overall variability of interreader agreement for individual MRI features, which ranged from poor to excellent (kappa value, 0.08–0.822). Limited interreader reproducibility of some MRI features such as cortical thickening, cortical scalloping, bone expansion, fat entrapment, lobular outer margin, or internal septal or ring-and-arc enhancement may be caused by difficult and ambiguous definitions.21,22,32,44
To establish a reproducible model for improved prediction of tu-mor grades, we only included MRI features into the multivariate analy-sis that had a kappa value of at least 0.6. Our models (Table 3) identified in total 4 independent predictors for grading of cartilaginous neoplasms consisting of bone marrow edema, soft tissue mass, maximum tumor extent, and active periostitis. The latter was primarily important for TABLE 1. Univariate Analysis of Association of MRI Features and Histological Tumor Grades
MRI Features Benign (n = 52) Low Grade (n = 27) High Grade (n = 37) Malignant (n = 64) Benign vs Low Grade (P) Low Grade vs High Grade (P) Benign vs
Malignant (P) Kappa Value 1 Cortical thickening 4 (7.7%) 7 (25.9%) 3 (8.1%) 10 (15.6%) 0.039 0.081 0.256 0.193 2 Cortical scalloping 11 (21.2%) 11 (40.7%) 16 (43.2%) 27 (42.2%) 0.111 1 0.018 0.223 3 Cortical destruction*†‡§|| 10 (19.2%) 16 (59.3%) 32 (86.5%) 48 (75.0%) 0.001 0.019 <0.001 0.741 4 Bone expansion 5 (9.6%) 7 (25.9%) 4 (10.8%) 11 (17.2%) 0.95 0.179 0.287 0.35 5 Active periostitis*§|| 7 (13.5%) 9 (33.3%) 32 (86.5%) 41 (64.1%) 0.074 <0.001 <0.001 0.693 6 Reactive bone marrow edema*†‡§|| 4 (7.7%) 12 (44.4%) 30 (81.1%) 42 (65.6%) <0.001 0.003 <0.001 0.7 7 Reactive soft tissue edema *§|| 5 (9.6%) 7 (25.9%) 27 (73.0%) 34 (53.1%) 0.095 <0.001 <0.001 0.657 8 Soft tissue mass*†‡§ 8 (15.4%) 15 (55.6%) 30 (81.1%) 45 (70.3%) <0.001 0.051 <0.001 0.809 9 Internal septal or
ring-and-arc enhancement
48 (92.3%) 21 (77.8%) 27 (73.0%) 48 (75.0%) 0.082 0.774 0.015 0.434 10 Lobular outer margins 47 (90.4%) 25 (0,926) 26 (70.3%) 51 (79.7%) 1 0.033 0.13 0.388 11 Central nonenhancing portion 44 (84.6%) 22 (81.5%) 31 (83.8%) 53 (82.8%) 0.755 1 1 0.093 12 Intralesional enhancing
solid portion
35 (67.3%) 21 (77.8%) 33 (89.2%) 54 (84.4%) 0.436 0.3 0.046 0.149 13 Fat inclusion 16 (30.8%) 2 (7.4%) 1 (2.7%) 3 (4.7%) 0.023 0.568 <0.001 0.414 14 Maximum tumor extent, cm*|| 5.1 (SD 3.6) 6.2 (SD 3.6) 9.9 (SD 4.7) 8.3 (SD 4.6) 0.201 0.001 <0.001 0.99¶
Results of univariate analysis of the association of tumor grade and imaging features assessed by the senior expert reader as well as interreader reader reliability in between both expert readers. Statistical significantPvalues are marked in bold print.
*Features included in the multivariate analysis for differentiation of benign and malignant lesions for the MRI feature model.
†Features included in the multivariate analysis for differentiation of benign and low-grade lesions for the MRI feature model.
‡Features included in the multivariate analysis for differentiation of benign and low-grade lesions for combined feature model. §Features included in the multivariate analysis for differentiation of benign and malignant lesions for the combined feature model. ||Features included in the multivariate analysis for differentiation of low-grade and high-grade lesions.
¶Interreader reliability calculated using the intraclass correlation coefficient. MRI indicates magnetic resonance imaging; SD, standard deviation.
Investigative Radiology • Volume 00, Number 00, Month 2018 MRI-Based Grading of Cartilaginous Bone Tumors
the diagnosis of high-grade neoplasms, which is in line with findings of Douis et al.21 Compared with the grading based on expert readers' impression, diagnostic accuracies of these prediction models were
superior for differentiation of low-grade from high-grade lesions but similar or inferior for differentiation of benign from malignant or benign from low-grade lesions. In comparison to published data, the TABLE 2. Multivariate Analysis
Compared Tumor Grades Independent Predictors (MRI Sequence) Odds Ratio (95% CI) P Coefficient (Standard Error) MRI feature model Benign vs malignant Reactive bone marrow edema 14.305 (4.257–48.064) <0.001 2.661 (0.618)
Soft tissue mass 7.702 (2.731–21.722) <0.001 2.041 (0.529)
Constant 0.236 <0.001 −1.443 (0.342)
Benign vs low-grade Reactive bone marrow edema 6.312 (1.632–24.407) 0.008 1.842 (0.690) Soft tissue mass 4.675 (1.477–14.795) 0.009 1.542 (0.588)
Constant 0.208 <0.001 −1.572 (0.361)
Low-grade vs high-grade Active periostitis 12.066 (3.127–46.562) <0.001 2.490 (0.689) Maximum tumor extent 1.234 (1.042–1.461) 0.015 0.210 (0.086)
Constant 0.053 0.001 −2.931 (0.922)
TA feature model Benign vs malignant Skewness (T1w) 0.245 (0.111–0.539) <0.001 −1.406 (0.402) Gray-level nonuniformity (T1w) 0.975 (0.956–0.995) 0.014 −0.025 (0.010) Run-length nonuniformity (T1w) 1.001 (1.001–1.002) 0.001 0.001 (0.0005)
Constant 0.325 0.014 −1.124 (0.455)
Benign vs low-grade Short-run high gray-level emphasis (CE) 0.965 (0.934–0.997) 0.032 −0.036 (0.017) Skewness (T1w) 0.180 (0.063–0.513) 0.001 −1.713 (0.533) Gray-level nonuniformity (T1w) 0.971 (0.946–0.996) 0.024 −0.030 (0.013) Run-length nonuniformity (T1w) 1.001 (1.0003–1.003) 0.009 0.001 (0.001)
Constant 4.012EXP16 0.038 38.213 (18.454)
Combined model Benign vs malignant Reactive bone marrow edema 12.42 (3.2–48.208) <0.001 2.519 (0.692) Skewness (T1w) 0.39 (0.169–0.900) 0.027 −0.942 (0.427) Gray-level nonuniformity (T1w) 0.978 (0.955–1.003) 0.078 −0.022 (0.012) Run-length nonuniformity (T1w) 1.001 (1.0002–1.002) 0.015 0.001 (0.001)
Constant 0.168 0.001 −1.786 (0.555)
Benign vs low-grade Reactive bone marrow edema 16.235 (2.613–100.89) 0.003 2.787 (0.932) Short-run high gray-level emphasis (CE) 0.942 (0.907–0.978) 0.002 −0.060 (0.019) Skewness (T1w) 0.339 (0.115–0.997) 0.049 −1.082 (0.550) Energy (T1w) 3.4 EXP−67 (0–3.9EXP + 16) 0.070 −475.311 (262.005)
Constant 6.844EXP28 0.001 66.396 (20.812)
Results of multivariate analysis for all regression models. Note that no significant TA features for differentiation of low-grade from high-grade chondrosarcoma existed, therefore no TA- or combined-regression model was calculated. TA features are represented with the respective sequence in parentheses.
MRI indicates magnetic resonance imaging; CI, confidence interval; CE, contrast-enhanced T1-weighted fat-saturated sequence; T1w, T1-weighted sequence.
TABLE 3. ROC Analysis Results for Regression Models and Reader Impressions
Tumor Grade MRI Feature Model TA Feature Model Combined Model MRI vs TA TA vs Combined MRI vs Combined Benign vs malignant Sensitivity 85.9% 81.3% 82.8%
Specificity 80.8% 90.4% 88.5%
AUC (95% CI) 0.870 (0.795–0.925) 0.898 (0.828–0.946) 0.929 (0.866–0.968) P= 0.458 P= 0.070 P= 0.034
Benign vs low-grade Sensitivity 70.4% 77.8% 74.1%
Specificity 80.8% 90.4% 88.5%
AUC (95% CI) 0.774 (0.666–0.861) 0.895 (0.806–0.953) 0.912 (0.827–0.964) P= 0.038 P= 0.363 P= 0.008
Low-grade vs high-grade Sensitivity 91.9% NA NA
Specificity 70.1% NA NA
AUC (95%-CI) 0.848 (0.736–0.925) NA NA
Statistical significantPvalues are marked in bold print.
MRI indicates magnetic resonance imaging; TA, texture analysis; CI, confidence interval; ROC, receiver operating characteristics; AUC, area under the curve; NA, not applicable.
diagnostic accuracies of our predictor models are lower for differentiation of low-grade from high-grade chondrosarcoma21,22 and for the differentiation of benign from malignant lesions,44 when compared with reported diagnostic accuracies of 95.6% and 93.4%, respectively. The differences might be explained by different study protocols, as previous studies did not take into consideration the interreader reliability of MRI features21,22 or performed additional dynamic contrast-enhanced MRI.44
Texture analysis showed excellent robustness between both readers as indicated by an excellent mean ICC value of 0.79, which was substantially higher than the interreader reliability of morphologic analysis of MRI imaging features and comparable to previously re-ported data.45Analogous to the morphologic MRI analysis, only signif-icant texture features of univariate analysis with ICC values of 0.6 or above were included in regression models.
In comparison to the morphologic MRI feature analysis, the di-agnostic accuracies of 89.8% of the TA model for the differentiation of benign from malignant lesions were only slightly higher without sta-tistical significance, whereas the diagnostic accuracies of 89.5% of the
TA model for the differentiation of benign from low-grade cartilaginous lesions were significantly superior.
A recent publication evaluating the diagnostic value of 3-dimensional (3D)–based TA for differentiation of enchondroma from low-grade chondrosarcoma on 22 patients also found significant differ-ences between TA features after univariate analysis.46 However, in TABLE 4. Univariate Analysis of Association of TA Features and
Histological Tumor Grades
CE-T1wfs T1w Benign vs malignant Contrast (P< 0.001)* Variance (P= 0.005) Correlation (P< 0.001)* Skewness (P< 0.001) *† Energy (P= 0.045) Kurtosis (P= 0.026)‡ Homogeneity (P< 0.001)* Energy (P< 0.001) Entropy (P< 0.001)‡ GLN (P< 0.001)*† SRE (P< 0.001)* RLN (P< 0.001)*† LRE (P= 0.004) LGRE (P= 0.006) GLN (P< 0.001)*† SRLGE (P= 0.007) RLN (P< 0.001)* LRLGE (P= 0.019) RP (P< 0.001)* SRHGE (P< 0.001)*† LRHGE (P= 0.002) Benign vs low-grade Contrast (P= 0.035) Variance (P= 0.010)*† Correlation (P= 0.044) Skewness (P< 0.001)*† Homogeneity (P= 0.020)* Energy (P= 0.001)*† Entropy (P= 0.034)‡ GLN (P= 0.015)* SRE (P= 0.024) RLN (P= 0.006)*† GLN (P= 0.027) LGRE (P= 0.021)* RLN (P= 0.044) SRLGE (P= 0.025) RP (P= 0.043) SRHGE (P= 0.002)*† LRHGE (P= 0.029) Low-grade vs high-grade
No significant TA features No significant TA features Results of univariate analysis demonstrating TA features withP< 0.05 for differentiation of benign from malignant, benign from low-grade, and low-grade from high-grade cartilaginous neoplasms.
*Features included in TA multivariate regression analysis.
†Features included in combined multivariate regression analysis with both MRI and TA features.
‡TA features with an ICC < 0.6.
TA indicates texture analysis; CE-T1wfs, contrast-enhanced T1-weighted fat-suppressed; T1w, T1-weighted; SRE, short-run emphasis; LRE, long-run emphasis; GLN, gray-level nonuniformity; RLN, run-length nonuniformity; RP, run percentage; LGRE, low gray-level run emphasis; SRLGE, short-run low gray-level emphasis; SRHGE, short-run high gray-level emphasis; LRHGE, long-run high gray-level emphasis; LRLGE, long-run low gray-level emphasis.
FIGURE 4. Receiver operating characteristic analysis of each regression model for differentiation of (A) benign from malignant cartilaginous neoplasms and (B) benign from low-grade cartilaginous neoplasms. The AUC was highest for the combined model of MRI and TA features (yellow line) as compared with the MRI feature only (blue line) and TA feature only model (green line), showing an AUC of 0.929 and 0.912, respectively.
Investigative Radiology • Volume 00, Number 00, Month 2018 MRI-Based Grading of Cartilaginous Bone Tumors
contrast to our results, the authors found significant differences for en-tropy on T1w images and for kurtosis and skewness on CE-T1wfs im-ages. On the other hand, the significant TA features of our study were either not statistically significant or not evaluated in the mentioned study. These differences might relate to differences for 3D and 2D anal-ysis or to differences for calculating the texture features, which were not described in the published study. Furthermore, our study implemented 2 readers who performed TA compared with one reader of the previous study and included a larger number of patients on each subgroup, which also may explain for differences in between both studies.
Similar to our study, recent publications also showed an additive value of TA and, in general, of computer-aided diagnostics, for the as-sessment of neoplasms and nonneoplastic conditions in other parts of the body, such as the brain, lung, gastrointestinal tract, or the heart.25,26,47–50Interestingly, the significant and independent TA features for grading of cartilaginous lesions in our study were partly overlapping with independent TA features of other tumor entities such as run-length nonuniformity in glioblastoma,25lipoma, and liposarcoma,51as well as skewness in renal cell carcinoma.52However, several other TA features differed substantially between recent TA studies evaluating malignan-cies,26,45,53probably reflecting the biological and histopathological dif-ferences of various neoplasms.
To further improve diagnostic accuracies, we combined morpho-logic MRI and TA features allowing to compete for inclusion into re-gression models. Our results show a complementary effect of both techniques resulting in the highest diagnostic accuracies of 92.9% for differentiation of benign from malignant and 91.2% for differentiation of benign from low-grade lesions, which were statistically significantly higher in comparison to the morphologic MRI feature models for both analyses. The increase of diagnostic accuracies compared with separate morphologic MRI analysis or separate TA is predominately based on an improved diagnostic accuracy for differentiation of benign cartilaginous lesions from low-grade chondrosarcomas, which is likely explained by the fact that TA evaluated the actual tumor structure, whereas included MRI features assessed the surrounding tumor abnormalities. The diag-nostic accuracies of our combined model are overall among the highest reported in the literature for MRI-based grading of cartilaginous neo-plasms.16,21,22,24,32,44,54Importantly, diagnostic accuracy of the com-bined model of 91.2% for differentiation of benign from low-grade
lesions is higher than previously reported24,54and the diagnostic accu-racies of our expert reader assessment, underlining the added value of TA even for the experienced musculoskeletal radiologist.
For differentiation of benign from malignant cartilaginous neoplasms, the diagnostic accuracy of 92.9% of the combined model of our study is similar to results of studies of De Coninck et al,44who reported a diagnostic accuracy of 93.4% using dynamic contrast-enhanced MRI, and Murphey et al16of a statistical analysis of multimodality imaging with radiography, computed tomography, and MRI. In contrast, our study also included a relevant proportion of periosteal lesions and dedifferentiated chondrosarcoma, reflecting al-most the entire spectrum of cartilaginous neoplasms. Nevertheless, be-cause cartilaginous neoplasms of the hands and feet are most likely benign and cartilaginous neoplasms of the spine, rips, and scull are most likely malignant, we excluded these patients, because assessments purely based on tumor location rather than MRI morphology could have influenced results significantly. In addition to dynamic contrast-enhanced MRI, diffusion-weighted imaging is another func-tional MRI technique that is frequently employed for tumor imaging, which, however, does not aid in the differentiation and grading of cartilaginous neoplasms.55
A large variety of TA features have been proposed and published relying on either histogram analysis or on analysis of specific matrixes, such as the co-occurrence matrix or the gray-level run-length matrix as implemented in our study. We evaluated a total of 19 texture features consisting of 5 first-order features and of 14 second- or higher-order features, which we applied on both T1w and on fat-saturated contrast-enhanced T1w images. First-order features rely on histogram analysis describing the gray-level distribution of an image. As an example, the first-order feature variance describes the width of the histogram and measures the deviation of gray levels from the mean. The first-order feature skewness, which was an independent predictor of our study, measures the asymmetry of the histogram in relation to the mean, de-scribing if the histogram has a tail to lower or higher intensities. En-tropy, on the other hand, describes the irregularity of gray-level distributions and is considered as a measure of heterogeneity. In con-trast to first-order features, second-order features and higher-order features are more complex and describe not only voxel intensities but give information about their spatial distribution. Although some attempts have been made to link these features to tissue microenviron-ment,53second- and higher-order features are mostly accepted to be statistical representations of texture patterns not appreciable be standard morphologic image interpretation without further knowledge of their microenvironmental counterparts.56–58
Our study has limitations. First, this study was performed ret-rospectively, which did not allow for the use of dynamic contrast-enhanced MRI or a multimodality approach.16,44However, a recent study stated that dynamic contrast-enhanced MRI is not useful for dif-ferentiation of enchondroma from low-grade chondrosarcoma.59 Nevertheless, we achieved similar to higher diagnostic accuracies, whereas focusing on reproducibility of both our calculated models as well as included imaging sequences. Although we performed cross-validation of the calculated models, prospective verification of our study results would further underline the value of TA for grading of cartilaginous neoplasms. Second, we did not include additional TA on T2w or STIR images because those sequences were not available in all patients. However, our subanalysis did not suggest additional improvements in diagnostic accuracies through the addition of T2w-or STIR-based TA features. Third, we used a 2D approach fT2w-or TA, by selecting the image with the largest tumor area. This decision was based on studies suggesting that 2D TA is noninferior to 3D TA.60In addition, 2D TA is a more clinical applicable approach in comparison to 3D TA, because ROI definition can be achieved much faster. Finally, histopath-ological diagnosis, which was used as the standard of reference in our study, may be influenced by substantial interreader variability19and FIGURE 5. An 18-year-old man with high-grade chondrosarcoma of the
medial femoral condyle. A, Coronal STIR MRI scan shows extensive bone marrow edema (asterisks) surrounding the tumor and a thin fluid accumulation along the cortical bone (arrowhead) representing periostitis. B, Contrast-enhanced T1w fat-saturated MRI scan shows corresponding marked contrast enhancement of the periosteum adjacent to the tumor (arrows), suggesting periostitis. One reader graded this lesion as a low-grade chondrosarcoma, whereas the other reader, as well as the MRI feature model, graded this lesion correctly as a high-grade chondrosarcoma. Texture analysis, in comparison, did not show a benefit for differentiation of low-grade from high-grade chondrosarcoma.
therefore may have influenced our results. Furthermore, in some cases, histopathological diagnoses were influenced by imaging data because selected cases were discussed in multidisciplinary conferences by pa-thologists and radiologists. Although this is common practice and there-fore inevitable, histopathology may not be considered as a truly independent standard of reference for morphological MRI analyses in all cases, possibly leading to an overestimation of diagnostic accuracies based on morphological MRI analyses.
In conclusion, TA improves diagnostic accuracy for differentia-tion of benign and malignant as well as for benign and low-grade carti-laginous lesions when compared with morphologic MRI analysis.
REFERENCES
1. Bertoni F, Bacchini P, Hogendoorn PCW. Cartilage tumours. In: Fletcher CDM, Unni KK, Mertens F, eds.World Health Organization Classification of Tumours. Pathology and Genetics of Tumours of Soft Tissue and Bone. Lyon, France: IARC Press; 2002:247–251.
2. Walden MJ, Murphey MD, Vidal JA. Incidental enchondromas of the knee. AJR Am J Roentgenol. 2008;190:1611–1615.
3. Hong ED, Carrino JA, Weber KL, et al. Prevalence of shoulder enchondromas on routine MR imaging.Clin Imaging. 2011;35:378–384.
4. Unni KK, Dahlin DC.Dahlin's Bone Tumors: General Aspects and Data on 11,087 Cases. Philadelphia, PA: Lippincott-Raven; 1996.
5. Giuffrida AY, Burgueno JE, Koniaris LG, et al. Chondrosarcoma in the United States (1973 to 2003): an analysis of 2890 cases from the SEER database. J Bone Joint Surg Am. 2009;91:1063–1072.
6. Welkerling H, Kratz S, Ewerbeck V, et al. A reproducible and simple grading sys-tem for classical chondrosarcomas. Analysis of 35 chondrosarcomas and 16 enchondromas with emphasis on recurrence rate and radiological and clinical data.Virchows Arch. 2003;443:725–733.
7. Verdegaal SH, Brouwers HF, van Zwet EW, et al. Low-grade chondrosarcoma of long bones treated with intralesional curettage followed by application of phenol, ethanol, and bone-grafting.J Bone Joint Surg Am. 2012;94:1201–1207. 8. Donati D, Colangeli S, Colangeli M, et al. Surgical treatment of grade I central
chondrosarcoma.Clin Orthop Relat Res. 2010;468:581–589.
9. Hanna SA, Whittingham-Jones P, Sewell MD, et al. Outcome of intralesional cu-rettage for low-grade chondrosarcoma of long bones.Eur J Surg Oncol. 2009;35: 1343–1347.
10. Campanacci DA, Scoccianti G, Franchi A, et al. Surgical treatment of central grade 1 chondrosarcoma of the appendicular skeleton.J Orthop Traumatol. 2013;14:101–107.
11. Fiorenza F, Abudu A, Grimer RJ, et al. Risk factors for survival and local control in chondrosarcoma of bone.J Bone Joint Surg Br. 2002;84:93–99.
12. Bergh P, Gunterberg B, Meis-Kindblom JM, et al. Prognostic factors and outcome of pelvic, sacral, and spinal chondrosarcomas: a center-based study of 69 cases. Cancer. 2001;91:1201–1212.
13. Rizzo M, Ghert MA, Harrelson JM, et al. Chondrosarcoma of bone: analysis of 108 cases and evaluation for predictors of outcome.Clin Orthop Relat Res. 2001:224–233.
14. Lee FY, Mankin HJ, Fondren G, et al. Chondrosarcoma of bone: an assessment of outcome.J Bone Joint Surg Am. 1999;81:326–338.
15. Reith JD, Horodyski MB, Scarborough MT. Grade 2 chondrosarcoma: stage I or stage II tumor?Clin Orthop Relat Res. 2003:45–51.
16. Murphey MD, Flemming DJ, Boyea SR, et al. Enchondroma versus chondrosarcoma in the appendicular skeleton: differentiating features.Radiographics. 1998;18: 1213–1237; quiz 44–5.
17. Mirra JM, Gold R, Downs J, et al. A new histologic approach to the differentiation of enchondroma and chondrosarcoma of the bones. A clinicopathologic analysis of 51 cases.Clin Orthop Relat Res. 1985:214–237.
18. Eefting D, Schrage YM, Geirnaerdt MJ, et al. Assessment of interobserver vari-ability and histologic parameters to improve relivari-ability in classification and grad-ing of central cartilaginous tumors.Am J Surg Pathol. 2009;33:50–57. 19. Skeletal Lesions Interobserver Correlation among Expert Diagnosticians Study G.
Reliability of histopathologic and radiologic grading of cartilaginous neoplasms in long bones.J Bone Joint Surg Am. 2007;89:2113–2123.
20. De Beuckeleer LH, De Schepper AM, Ramon F. Magnetic resonance imaging of cartilaginous tumors: is it useful or necessary?Skeletal Radiol. 1996;25:137–141. 21. Douis H, Singh L, Saifuddin A. MRI differentiation of low-grade from high-grade
appendicular chondrosarcoma.Eur Radiol. 2014;24:232–240.
22. Yoo HJ, Hong SH, Choi JY, et al. Differentiating high-grade from low-grade chondrosarcoma with MR imaging.Eur Radiol. 2009;19:3008–3014.
23. De Beuckeleer LH, De Schepper AM, Ramon F, et al. Magnetic resonance imag-ing of cartilaginous tumors: a retrospective study of 79 patients.Eur J Radiol. 1995;21:34–40.
24. Crim J, Schmidt R, Layfield L, et al. Can imaging criteria distinguish enchondroma from grade 1 chondrosarcoma?Eur J Radiol. 2015;84:2222–2230. 25. Kickingereder P, Burth S, Wick A, et al. Radiomic profiling of glioblastoma: iden-tifying an imaging predictor of patient survival with improved performance over etablished clinical and radiologic risk models.Radiology. 2016;280:880–889. 26. Yoon SH, Park CM, Park SJ, et al. Tumor heterogeneity in lung cancer: assessment
with dynamic contrast-enhanced MR imaging.Radiology. 2016;280:940–948. 27. Zhou W, Zhang L, Wang K, et al. Malignancy characterization of hepatocellular
carcinomas based on texture analysis of contrast-enhanced MR images.J Magn Reson Imaging. 2017;45:1476–1484.
28. Evans HL, Ayala AG, Romsdahl MM. Prognostic factors in chondrosarcoma of bone: a clinicopathologic analysis with emphasis on histologic grading.Cancer. 1977;40:818–831.
29. Dahlin DC, Beabout JW. Dedifferentiation of low-grade chondrosarcomas. Cancer. 1971;28:461–466.
30. Enneking WF. A system of staging musculoskeletal neoplasms.Clin Orthop Relat Res. 1986:9–24.
31. Murphey MD, Walker EA, Wilson AJ, et al. From the archives of the AFIP: imaging of primary chondrosarcoma: radiologic-pathologic correlation. Radiographics. 2003;23:1245–1278.
32. Aoki J, Sone S, Fujioka F, et al. MR of enchondroma and chondrosarcoma: rings and arcs of Gd-DTPA enhancement.J Comput Assist Tomogr. 1991;15: 1011–1016.
33. Vallières M, Freeman CR, Skamene SR, et al. A radiomics model from joint FDG-PET and MRI texture features for the prediction of lung metastases in soft-tissue sarcomas of the extremities.Phys Med Biol. 2015;60:5471–5496.
34. Wei X. Gray Level Run Length Matrix Toolbox v1.0, Software. Beijing Aeronau-tical Technology Research Center; 2007.
35. Haralick RM, Shanmugam K, Dinstein I. Textural features for image classifica-tion.IEEE Trans Syst Man Cybern. 1973;SMC-3:610–621.
36. Galloway MM. Texture analysis using gray level run lengths.Computer Graphics and Image Processing. 1975;4:172–179.
37. Chu A, Sehgal CM, Greenleaf JF. Use of gray value distribution of run lengths for texture analysis.Pattern Recognition Letters. 1990;11:415–419.
38. Dasarathy BV, Holder EB. Image characterizations based on joint gray level—run length distributions.Pattern Recognition Letters. 1991;12:497–502.
39. Cohen J. A coefficient of agreement for nominal scales.Educ Psychol Meas. 1960;20:37–46.
40. Landis JR, Koch GG. The measurement of observer agreement for categorical data.Biometrics. 1977;33:159–174.
41. Altman D. Inter-rater agreement.Practical Statistics for Medical Research. 1991; 5:403–409.
42. Cicchetti DV. Guidelines, criteria, and rules of thumb for evaluating normed and standardized assessment instruments in psychology. Psychol Assess. 1994;6: 284–290.
43. DeLong ER, DeLong DM, Clarke-Pearson DL. Comparing the areas under two or more correlated receiver operating characteristic curves: a nonparametric ap-proach.Biometrics. 1988;44:837–845.
44. De Coninck T, Jans L, Sys G, et al. Dynamic contrast-enhanced MR imaging for differentiation between enchondroma and chondrosarcoma.Eur Radiol. 2013;23: 3140–3152.
45. Doshi AM, Ream JM, Kierans AS, et al. Use of MRI in differentiation of papillary renal cell carcinoma subtypes: qualitative and quantitative analysis.AJR Am J Roentgenol. 2016;206:566–572.
46. Lisson CS, Lisson CG, Flosdorf K, et al. Diagnostic value of MRI-based 3D texture analysis for tissue characterisation and discrimination of low-grade chondrosarcoma from enchondroma: a pilot study.Eur Radiol. 2018;28:468–477.
47. Ahn SY, Park CM, Park SJ, et al. Prognostic value of computed tomography tex-ture featex-tures in non-small cell lung cancers treated with definitive concomitant chemoradiotherapy.Invest Radiol. 2015;50:719–725.
48. De Cecco CN, Ganeshan B, Ciolina M, et al. Texture analysis as imaging bio-marker of tumoral response to neoadjuvant chemoradiotherapy in rectal cancer pa-tients studied with 3-T magnetic resonance.Invest Radiol. 2015;50:239–245. 49. Mannil M, von Spiczak J, Manka R, et al. Texture analysis and machine learning
for detecting myocardial infarction in noncontrast low-dose computed tomogra-phy: unveiling the invisible.Invest Radiol. 2018;53:338–343.
50. Ingrisch M, Schneider MJ, Norenberg D, et al. Radiomic analysis reveals prognos-tic information in T1-weighted baseline magneprognos-tic resonance imaging in patients with glioblastoma.Invest Radiol. 2017;52:360–366.
Investigative Radiology • Volume 00, Number 00, Month 2018 MRI-Based Grading of Cartilaginous Bone Tumors
51. Thornhill RE, Golfam M, Sheikh A, et al. Differentiation of lipoma from liposarcoma on MRI using texture and shape analysis.Acad Radiol. 2014;21: 1185–1194.
52. Sasaguri K, Takahashi N, Gomez-Cardona D, et al. Small (<4 cm) renal mass: dif-ferentiation of oncocytoma from renal cell carcinoma on biphasic contrast-enhanced CT.AJR Am J Roentgenol. 2015;205:999–1007.
53. Lubner MG, Stabo N, Abel EJ, et al. CT textural analysis of large primary renal cell carcinomas: pretreatment tumor heterogeneity correlates with histologic find-ings and clinical outcomes.AJR Am J Roentgenol. 2016;207:96–105. 54. Geirnaerdt MJ, Hermans J, Bloem JL, et al. Usefulness of radiography in
dif-ferentiating enchondroma from central grade 1 chondrosarcoma.AJR Am J Roentgenol. 1997;169:1097–1104.
55. Douis H, Jeys L, Grimer R, et al. Is there a role for diffusion-weighted MRI (DWI) in the diagnosis of central cartilage tumors?Skeletal Radiol. 2015;44:963–969.
56. Lerski RA, Straughan K, Schad LR, et al. MR image texture analysis—an approach to tissue characterization.Magn Reson Imaging. 1993;11:873–887.
57. Ganeshan B, Goh V, Mandeville HC, et al. Non-small cell lung cancer: histo-pathologic correlates for texture parameters at CT.Radiology. 2013;266: 326–336.
58. Bézy-Wendling J, Kretowski M, Rolland Y, et al. Toward a better understanding of texture in vascular CT scan simulated images.IEEE Trans Biomed Eng. 2001;48: 120–124.
59. Douis H, Parry M, Vaiyapuri S, et al. What are the differentiating clinical and MRI-features of enchondromas from low-grade chondrosarcomas?Eur Radiol. 2018;28:398–409.
60. Lubner MG, Stabo N, Lubner SJ, et al. CT textural analysis of hepatic metastatic colorectal cancer: pre-treatment tumor heterogeneity correlates with pathology and clinical outcomes.Abdom Imaging. 2015;40:2331–2337.