Physica A 367 (2006) 531–537
Wiring cost in the organization of a biological neuronal network
Yong-Yeol Ahn
a, Hawoong Jeong
a, Beom Jun Kim
b,aDepartment of Physics, Korea Advanced Institute of Science and Technology, Daejeon 305-701, Korea bDepartment of Physics, Sungkyunkwan University, Suwon 440-746, Korea
Received 30 September 2005; received in revised form 1 November 2005 Available online 6 January 2006
Abstract
To find out the role of the wiring cost in the organization of the neuronal network of the nematodeCaenorhabditis elegans, we build the spatial neuronal map ofC. elegansbased on geometrical positions of neurons. We show that the number of interneuronal connections of the Euclidean lengthddecays exponentially withd, implying that the wiring cost, defined as the sum of the interneuronal distances, plays an important role in the actual neuronal network. Using the two methods to shuffle the neuronal network in systematic ways, the edge exchange and the vertex swapping, we show that positions of neurons are not randomly distributed but organized to reduce the wiring cost. Furthermore, we discuss the trade-off between the wiring cost and the performance of the network.
r2006 Elsevier B.V. All rights reserved.
Keywords:Biological network; Neuronal network; Wiring cost
Human beings have been attracted by their own brains’ vast ability and complexity [1]. Although the topology of connections among neurons in a brain is of the fundamental interest in the brain research, it is still impossible to obtain the whole information because of the tremendous number of neurons (more than hundreds of billions). Only macroscopic and indirect informations on connectivity are accessible in the entire brain’s scale so far[2–5]. However, primitive organisms that have rather small sizes shed a light on the research of the structure of connections in a brain thanks to their relatively simple organization. The nematode
Caenorhabditis elegans, which was the first multicellular organism whose whole genome was sequenced in 1998
[6], is one of such examples. The remarkable feature of this nematode is that most individuals ofC. elegans
have almost the same cellular properties such as shapes, connectivities and positions of neurons, which makes it possible to label each neuron. Throughout the pioneering work by White et al., the connectivity of the neuronal network has been uncapped[7,8].
A decade after the intensive works on the nematode, the researches on large-scale complex networks were initiated. Since the founding works of modelling complex networks [9,10] and the revealing of the real networks’ structures[11], numerous models have been suggested and studied, and various real networks have also begun to reveal their characteristics, such as small-worldness, power-law degree distribution, and high level of clustering [12]. The concepts, tools, and methods of the complex network researches have been
www.elsevier.com/locate/physa
0378-4371/$ - see front matterr2006 Elsevier B.V. All rights reserved. doi:10.1016/j.physa.2005.12.013
Corresponding author.
diffused into various fields, especially into biology. As the knowledge about biological networks grows, the issue of identifying the organizing principle of them becomes more substantial. In this issue, a powerful approach is focusing on the high effectiveness of biosystems because of the very essentiality of natural selection in the evolution. There are evidences of optimization in biological networks as we see in the normal biological organs. For example, the average distance between two metabolites of 43 microorganisms’ metabolic networks remain the same even though their numbers of nodes span from 200 to 800[13]. This optimization viewpoint can be also applied to technological systems (e.g. electric circuit [14], modular structure of a software[15]) because technological systems also evolve by the pressure toward high efficiency. It was discovered that the power-law degree distribution can come out from the optimization based models
[14,16,17]. In these models, a total cost is defined as the number of edges (or total length of edges) and the effectiveness is defined by several different measures, e.g. the short characteristic path length. The energy function to be optimized is defined using the cost and the effectiveness measures, and then, by minimizing the energy function, the scale-free network emerges as a result. When a network is spatially embedded, the geographic positions of vertices and the Euclidean lengths of edges are clearly defined, and such networks have been recently studied [18–21]. For example, it has been revealed that the wiring length distribution of the Internet routers and autonomous systems shows the power-law decay form as a function of the edge length
[19], while the cortical system network of macaque has been modeled by the exponential form[20].
Recently, in Ref.[23]the pattern recognition ability of Hopfield model[22]was used to gauge the network functionality. Interestingly, the neuronal network ofC.elegans shows worse performance than Barabasi–Al-bert (BA) network [10] and Watts–Strogatz (WS) network [9] with the rewiring probability p¼1:0 [23]. Another important result in Ref. [23] is that the performance of the Hopfield network is enhanced monotonically as the clustering property of the network becomes weak. Although the use of the pattern recognition in the Hopfield model as a generic measure of the network performance can hardly be justified, we strongly believe that the clustering coefficient can be a good measure of network performance. In more detail, the large clustering coefficient in a given network implies that there exist many short detouring connections. In the point of view of network performance, we are wasting our precious resources if we make too many triangles in networks since those edges participating in triangles could equally have been used to connect remote vertices. Consequently, the worse performance of theC. elegansneuronal network in Ref.[23]appears to suggest that the performance of the network competes with other measures.
The key question we are trying to answer in this paper is how the performance of the network competes with the wiring cost in the network. If we are allowed to use as many connections as we want, we can make network functioning very well by using sufficiently many edges. However, putting more edges consumes more resources in practice, and thus there should be a trade-off relation between the performance and the cost (measured as the total number of edges in this case). One can extend this discussion towards the case where the total number of edges is fixed but the network is geographically embedded in space. In this case, a sensible definition of the wiring cost can be the sum of the Euclidean lengths of edges. Real networks that can be viewed in such a way include the electric circuits, the Internet, the power grid, and the neuronal network in biological organisms. In this perspective, the cascading failure (the large-scale blackout) in power grid can be understood as the dark side effect of enhancing network performance. Suppose that the total length of power transmission lines is given. In order to distribute the electric power to more individuals, one should avoid making triangles since one can distribute electricity to broader region by sacrificing the formation of triangles. In this regard, it is to be noted that many technological networks such as the power grid[9]and the electronic circuits [14]have relatively small clustering coefficients.
In this paper, we construct the three-dimensional neuronal map ofC. elegans, and we display and estimate the effect of the wiring cost against the performance in the organization of the neuronal network ofC. elegans. It is to be noted that the strong evidence of the cost optimization inC. eleganswas discovered by showing that the natural position of ganglia inC. eleganshas the lowest wiring cost among the vast number of all possible positioning combinations[24]. We are investigating the wiring cost in the scale of individual neurons in the present work.
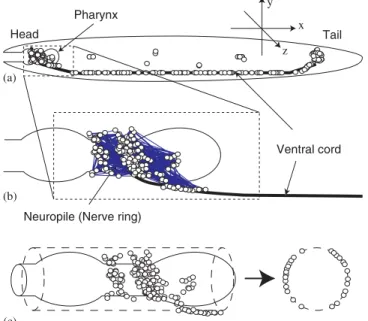
First of all, we construct the map of neurons inC. elegans. We define the position of a neuron as that of the soma which is collected from the figures of the actual nervous system [7]. We introduce the following assumptions to construct three-dimensional map from the two-dimensional figures. The first assumption is
that the head neurons wrap the pharynx closely and they are located on the surface of an imaginary cylinder whose diameter is the same as the pharynx’s diameter. At the center of the body, we put the neurons that appear in the both figures from the viewpoint of left side and right side. We place the ventral cord neurons at the bottom center of the body and assume that the neurons in the body part are placed just below the cuticle layer due to the pseudocoelome (body cavity) of the organism. However, for the tail neurons it is uncertain that they are placed just below the cuticle layer. We simply use the assumption that they are on the liney¼z
andy¼ z, which will not change the results of our analysis anyway since the tail neurons are localized in quite small volume. The positions of neurons and the schematic diagram of map construction are shown in
Fig. 1.
Although the wiring is generally not straight and guided by the structures such as the nerve ring and the ventral cord, we start here with the null hypothesis that approximates the connection between any two neurons is along the straight line and the wiring cost of the whole network is defined as the sum of the Euclidean distances of interneuronal connections. Henceforth, the distance is normalized in units of the head–tail length.
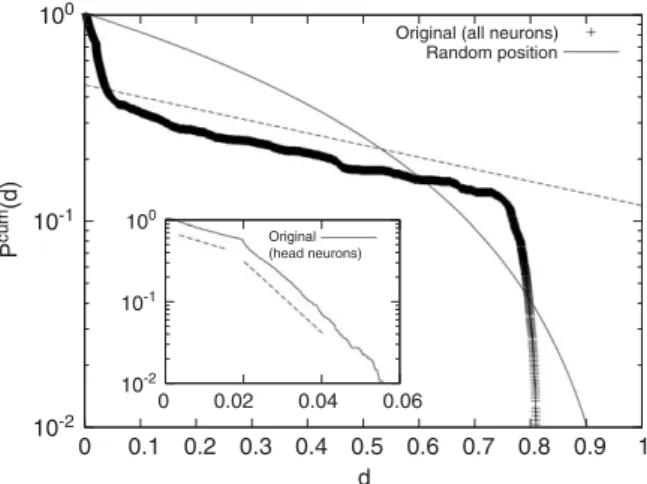
The cumulative distribution of the interneuronal distancesdof the originalC. elegansnetwork is shown in
Fig. 2. The cumulative distribution PcumðdÞ, measuring the frequency of interneuronal connections of the
length larger than d, exhibits a piecewise exponential decay form of expðd=xÞ with three different length scales: x0:03;0:01, and 0.74. The longest length scale 0.74 is almost the same order of magnitude as the body-spanning length scale which has been normalized to unity. We believe that the other two shorter length scales are related with the radius of pharynx ð0:02Þ. The non-cumulative distribution function PðdÞ, measuring how many interneuronal connections of the lengthd exist, is obtained from the derivative of the cumulative distribution with respect tod: the steeper slope in Fig. 2at smalldindicates that there are more shorter connections than longer ones, validating the concept of the wiring cost in the present work. For comparison, we also drawPcumðdÞobtained by randomly distributing the positions of all the neurons (the solid line inFig. 2): the difference from the actual distribution clearly indicates that the neuronal positions are far from random and that the Euclidean distances of neuronal connections plays an important role in the organization of the network although the actual connections are not along the straight lines in reality, as suggested in Ref.[20]. In the original neuronal network it is found that there are certain amount (about 10%) of long-range links which span about 80% of the whole body. These body-spanning wirings must be crucial
Head Tail
Pharynx
Neuropile (Nerve ring)
Ventral cord (a) (b) x y z (c)
Fig. 1. (a) Schematic diagram of locations of neurons inC. elegans. (b) Locations of head neurons, neuropile, and ventral cord and the connections between the head neurons and (c) Schematic diagram of constructing the three-dimensional neuronal map from a two-dimensional figure of head neurons.
for the coordinated function of the worm, such as coherent movement and the egg-laying behavior, as is the spinal cord in a human body. Besides these long-range links, the neuronal network has smaller number of middle-ranged links and much larger number of short links, which supports our proposition that the wiring cost defined as the sum of Euclidean lengths of interneuronal connections is an important factor inC. elegans
neuronal network.
To seek further evidences for the role of the wiring cost, we use two systematic ways to shuffle the neuronal network structure. The first one is called the edge exchange (EE) shuffling method[25] in which vertices of randomly selected two edges exchange their partner vertices, i.e. the two edgesðv1;v2Þandðv3;v4Þare changed
toðv1;v4Þandðv2;v3Þwithvibeing theith vertex. The EE shuffling keeps the degree of each vertex unchanged
and the positions of all vertices remain the same. The second method is the vertex swapping (VS) shuffling method[24], in which two randomly chosen vertices simply exchange their positions while preserving all the connections. In the VS, the connection structure of the network never changes, however, the interneuronal distances are greatly altered as we repeat the process. In addition, we adopt the Monte-Carlo (MC) scheme as follows: we use the wiring cost, defined as the sum of the Euclidean lengths of all interneuronal connections, as our Hamiltonian, and then perform the MC simulation at a given temperature T using the standard Metropolis algorithm. It should be noted thatTis introduced only as a parameter controlling the MC update algorithm, and thus has nothing to do with any actual meaning of the real temperature. In our scheme, the fully random shuffling of network structure by using either EE or VS method corresponds to the MC simulation atT ¼ 1. We also minimize the energy, i.e. the wiring cost in this work, within the VS shuffling method, by using the standard technique of the simulated annealing: starting fromT¼ 1, we slowly decrease
Tin MC simulations untilT ¼0 is reached. In the conventional MC method, this technique is frequently used when the ground-state configuration needs to be found out.
InFig. 3, we show the result of the wiring costs for four different network structures. From the left to the right, heights of boxes represent wiring costs for the networks obtained by the VS shuffling method atT ¼ 1
(the first box), by the EE atT¼ 1(the second one), for the original network without shuffling process (the third one), and the network with VS atT¼0 obtained from the simulated annealing technique (the last one). The cost of the original network is smaller than that of randomly shuffled two networks, obtained by using VS and EE atT¼ 1, which again supports that wiring cost plays an important role in the organization of theC. elegans neuronal network. However, the organization principle cannot be solely based on wiring cost, as indicated by the smaller value of wiring cost in the optimized network obtained by using VS atT¼0 (the ratio
10-2 10-1 100 0 0.1 0.2 0.3 0.4 0.5 0.6 0.7 0.8 0.9 1 P cum (d) d
Original (all neurons) Random position 10-2 10-1 100 0 0.02 0.04 0.06 Original (head neurons)
Fig. 2. Cumulative distribution functionPcumðdÞversus the interneuronal distanced, which exhibits the piecewise exponential decay form
of expðd=xÞ. For comparison, we also show the corresponding curve, labelled as ‘Random position’ for the case when all neurons are randomly distributed, described by the functional form ofðd1Þ2. The difference in functional forms clearly indicates that the geometric distances of interneuronal connections play an important role in the organization of the network. The inset shows the cumulative distribution of the neuron pairs only in the head part. Sudden change of slope is due to the separation between the left and the right parts of head neurons, which corresponds to the radius of pharynx 0.02. If we only consider thexcoordinates of neurons, anomaly atd0:02 vanishes as expected.
of wiring costs is 0.53, meaning that the optimized network is about twice more cost-effective than the original network). In other words, the original neuronal network can be made to have a smaller wiring cost without changing the connection topology at all by simply changing the neuronal positions. In this regard, it is very interesting to note that if we remove body-spanning long connections of lengths larger than 0.75, the ratio of wiring costs between the original network and the optimized one is changed much from 0.53 to 0.67. This suggests that there are many long-range interneuronal connections that have to be placed without consideration of the wiring cost. Accordingly, if we neglect those long-range connections, role of wiring cost becomes more important in organization of network.
To study the relation between performance and wiring cost more systematically, we build networks that have the given value of wiring cost. In more detail, we repeat the EE shuffling until the given value of wiring cost is realized. We then stop the EE shuffling and measure the clustering coefficient of the network. As was discussed above in this paper, we believe that clustering coefficient can detect the network performance in the sense that high clustering in general corresponds to redundant wirings in the network. Fig. 4 reveals the interesting relation between the clustering coefficient and the wiring cost. The clearly observed negative correlation between the two quantities inFig. 4implies that wiring cost can only be reduced at the expense of network performance. Accordingly, although the neuronal network can be made more efficient (by reducing clustering coefficient), this can be achieved only by increasing wiring cost. In Fig. 4, original C. elegans
network (marked as the symbol) is far off the obtained curve, which indicates that the original network can be made to have much smaller wiring cost without any change in connection topology.
We below suggest three plausible reasons why C. elegans neuronal network does not have the optimal wiring cost. First, possible reason is the existence of the neuropile, such as nerve ring and ventral cord. If two neurons are connected through these structures, actual wiring may not cost too much although two neurons are separated by a long distance. Second reason one can think of is the functional constraints as mentioned above: the minimal subnetwork topologies for generating certain dynamical behaviors such as oscillation or chaotic motion are identified and named as ‘‘dynamical motifs’’ in Ref. [26], which has shown that some network topologies are unavoidable to perform certain behaviors regardless of wiring cost. One can also argue that full optimization of network structure can hardly be realized in actual biological evolution: the developmental process of every living organism is highly conserved through history of life [27]. Even if C. eleganscan minimize the wiring cost by modifying developmental process, this may not happen if the risk of failures in development is too great.
In conclusion, we have shown that the wiring cost, measured by total lengths of interneuronal connections, plays some how an important roles in the organization of theC. elegansneuronal network. The reduction of
0 100 200 300 400 500 600 700 VS (T=0) Original EE (T=∞) VS (T=∞) Total cost
Fig. 3. Wiring costs of networks obtained by fully random VS shuffling atT¼ 1and by fully random EE shuffling atT¼ 1are compared with wiring costs for the original network and the optimized network obtained by simulated annealing MC method with VS shuffling. VS and EE stand for the vertex swapping and the edge exchange as described in detail in the text. Shaded boxes show the wiring cost of the network whose long-range links (40:75) are excluded in the calculation of wiring costs. Error bars on top of boxes are computed from many independent MC runs.
the wiring cost is also shown to be accompanied by decrease of network performance, phenomenologically measured by the clustering coefficient.
Y.-Y.A. was supported by the Ministry of Science and Technology through Korean Systems Biology Research Grant (M10309020000-03B5002-00000), and H. J. was supported by KOSEF ABRL Program through Grant No. R14-2002-059-01002-0. B. J. K. was supported by the Ministry of Science and Technology through the Nanoscopia Center of Excellence at Ajou University.
References
[1] M. Bear, M.F. Bear, B.W. Connors, M.A. Paradiso, Neuroscience: Exploring the Brain, Lippincott Williams & Wilkins, Baltimore, MD, 2002.
[2] V.M. Eguı´luz, D.R. Chialvo, G.A. Cecchi, M. Baliki, A.V. Apkarian, Phys. Rev. Lett. 94 (2005) 018102. [3] S.T. Carmichael, J.L. Price, J. Comput. Neurol. 346 (1994) 366.
[4] D.J. Felleman, D.C. van Essen, Cereb. Cortex 1 (1991) 1. [5] J.W. Lewis, D.C. van Essen, J. Comput. Neurol. 428 (2000) 79. [6] TheC. elegansSequencing Consortium, Science 282 (1998) 2012.
[7] J.G. White, E. Southgate, J.N. Thomson, S. Brenner, Philos. Trans. R. Soc. London Ser. B 314 (1986) 1.
[8] T.B. Achacoso, W.S. Yamamoto, AY’s Neuroanatomy ofC. elegansfor Computation, CRC Press, Boca Raton, FL, 1991. [9] D.J. Watts, S.H. Strogatz, Nature (London) 393 (1998) 440.
[10] A.-L. Baraba´si, R. Albert, Science 286 (1999) 509;
A.-L. Baraba´si, R. Albert, H. Jeong, Physica A 272 (1999) 173. [11] R. Albert, H. Jeong, A.-L. Baraba´si, Nature 401 (1999) 130–131. [12] R. Albert, A.-L. Baraba´si, Rev. Mod. Phys. 74 (2002) 47;
S.N. Dorogovtsev, J.F.F. Mendes, Adv. Phys. 51 (2002) 1079; M.E.J. Newman, SIAM Rev. 45 (2003) 167.
[13] H. Jeong, B. Tomber, R. Albert, Z.N. Oltvai, A.-L. Barabasi, Nature (London) 407 (2000) 651. [14] R.F. Cancho, C. Janssen, R.V. Sole´, Phys. Rev. E 64 (2001) 046119.
[15] R.F. Cancho, R.V. Sole´, e-print cond-mat/0111222.
[16] S. Valverde, R.F. i Cancho, R.V. Sole´, Europhys. Lett. 60 (2002) 512. [17] Y.-Y Ahn, P.-J. Kim, H. Jeong, (unpublished).
[18] S.S. Manna, P. Sen, Phys. Rev. E 66 (2002) 06614.
[19] S.-H. Yook, H. Jeong, A.-L. Baraba´si, Proc. Natl. Acad. Sci. USA 99 (2002) 13382. [20] M. Kaiser, C.C. Hilgetag, Neurocomputing 58–60 (2004) 297.
[21] M. Kaiser, C.C. Hilgetag, Phys. Rev. E 69 (2004) 036103. 0 0.1 0.2 0.3 0.4 0.5 0.6 0 100 200 300 400 500 600 700 800 Clustering Coefficient Wiring Cost Original
Fig. 4. Wiring cost versus clustering coefficient. At the given value of wiring cost, we repeat the edge exchange shuffling method starting from the original network until the given wiring cost is reached. The negative correlation clearly implies that there is a trade-off relation between performance and wiring cost.
[22] See for reviews, e.g., J. Hertz, A. Krogh, R.G. Palmer, Introduction to the Theory of Neural Computation, Perseus Books, Cambridge, 1991.
[23] B.J. Kim, Phys. Rev. E 69 (2004) 045101(R). [24] C. Cherniak, J. Neurosci. 14 (1994) 2408. [25] S. Maslov, K. Sneppen, Science 296 (2002) 910. [26] V.P. Zhigulin, Phys. Rev. Lett. 92 (2004) 238701.
[27] L. Wolpert, R. Beddington, T. Jessell, P. Lawrence, E. Meyerowitz, J. Smith, Principles of Development, Oxford University Press, New York, 2002.