METHODOLOGY AND TOOLS FOR FIELD TESTING OF SYNCHROPHASOR SYSTEMS
A Thesis by
CHRISTOPH SEIDL
Submitted to the Office of Graduate and Professional Studies of Texas A&M University
in partial fulfillment of the requirements for the degree of MASTER OF SCIENCE
Chair of Committee, Mladen Kezunovic Committee Members, Thomas Overbye
Steve Liu
Srinivas Shakkottai Head of Department, Miroslav Begovic
December 2019
Major Subject: Electrical Engineering
ii ABSTRACT
The electrical power grid, as one of today’s most critical infrastructures, requires constant monitoring by operators to be aware of and react to any threats to the system’s condition. With control centers typically located far away from substations and other physical grid equipment, field measurement data forms the basis for a vast majority of control decisions in power system operation. For that reason, it is imperative to ensure the highest level of data integrity as
erroneous data may lead to inappropriate control actions with potentially devastating
consequences. Performance of one of the most advanced monitoring systems, the synchrophasor system, is the focus of this thesis.
This research will look at testing techniques used for performance assessment of
synchrophasor system performance in the field. Existing methods will be reviewed and evaluated for deficiencies in capturing system performance regarding data quality. The focus of this work will be on improving synchrophasor data quality, by introducing new testing methodology that utilizes a nested testing approach for end-to-end testing in the field using a portable test set and associated software tools. The capability of such methods and these tools to fully characterize and evaluate the performance of synchrophasor systems in the field will be validated through implementation in a large-scale testbed.
The purpose of this research is to specify, develop and implement a methodology and associated tools for field-testing of synchrophasor systems. To this day, there is no dedicated standard for field-testing of synchrophasor systems. This resulted in an inability to define widely accepted procedures to detect deterioration of system performance due to poor data quality and caused communication failures, unacceptable device and subsystem accuracy, or loss of
iii
calibration. This work will demonstrate how the new approach addresses the mentioned performance assessment gap.
The feasibility of implementation of the proposed test procedures will be demonstrated using different test system configurations available in a large-scale testbed. The proposed method is fully leveraging the benefits of a portable device specifically developed for field-testing, which may be used for improvement of commissioning, maintenance and
troubleshooting tests for existing installations. Use Cases resulting from this work will illustrate the practical benefits of the proposed methodology and associated tools.
iv
ACKNOWLEDGEMENTS
I would like to thank my advisor and committee chair, Dr. Mladen Kezunovic, for his guidance and support throughout the course of this research.
Furthermore, I would like to thank my committee members for their time and support as well as their collaboration on projects related to this thesis.
Thanks also go to my friends and colleagues and the department faculty and staff for making my time at Texas A&M University a great experience.
Finally, thanks to my mother and father for their encouragement and to Sabrina Kuhrn for her patience and love.
v
CONTRIBUTORS AND FUNDING SOURCES
This work was facilitated and financially supported by Dr. Mladen Kezunovic by offering access to his laboratory facilities and instruments at Texas A&M University, and providing the Research Assistant support from on-going related projects.
The data analyzed for this thesis was in parts taken from a project funded by the Department of Energy (DOE) – Timing Intrusion Measurements Ensuring Resiliency.
Special thanks go to the Fulbright Foundation for providing financial support and visa sponsorship awarded as a Fulbright Scholarship.
vi
NOMENCLATURE
BPA Bonneville Power Administration
DOE Department of Energy
DUT Device Under Test
EMS Energy Management System
FTS Field Test Set
GLONASS GLObal NAvigation Satellite System GPS Global Positioning System
ICAP IEEE Conformity Assessment Program
IRIG-B Inter Range Instrumentation Group Time Code – Format B
IT Instrument Transformer
NASPI North American SynchroPhasor Initiative NIST National Institute of Standards and Technology PDC Phasor Data Concentrator
PMU Phasor Measurement Unit
PNNL Pacific Northwest National Laboratory
PPS Pulse Per Second
PSTT Performance and Standards Task Team ROCOF Rate Of Change Of Frequency
SCADA Supervisory Control And Data Acquisition TEES Texas Engineering Experiment Station THD Total Harmonic Distortion
vii
TI Timing Intrusion
TTE Total Time Error
TUR Test Uncertainty Ratio
viii
TABLE OF CONTENTS
Page
ABSTRACT ... ii
ACKNOWLEDGEMENTS ... iv
CONTRIBUTORS AND FUNDING SOURCES ...v
NOMENCLATURE ... vi
TABLE OF CONTENTS ... viii
LIST OF FIGURES ... xi
LIST OF TABLES ... xiii
1. INTRODUCTION ...1
1.1. Overview of Power System Monitoring Importance ...1
1.2. SCADA vs. Synchrophasor Systems ...2
1.3. Monitoring System Performance During Emergency in Power Systems ...2
1.4. Importance of Field Testing ...3
1.5. Thesis Organization ...3
2. BACKGROUND ...5
2.1. Synchrophasor Systems and Applications ...5
2.2. Phasor Representation ...7
2.3. Sychrophasor Reference for PMU Characterization ...8
2.4. Field Testing of PMUs and Synchrophasor Systems ...9
2.5. Field Implementation of End-to-end and Nested Testing ...11
2.6. Indicators of Irregular Synchrophasor Data ...12
3. PRIOR WORK ...13
3.1. Standardization ...13
3.2. Lab Implementation of Standardized Tests ...14
3.3. Guidelines for Non-Standardized Tests ...16
3.4. Tools and Methodologies for Synchrophasor System Performance Assessment ....17
3.5. Conclusions ...18
4. PROBLEM STATEMENT ...19
ix
4.1.1. Performance issues...19
4.1.2. Existing standards ...19
4.1.3. Performance Issues not Covered by Existing Standards...21
4.2. Hypothesis...21
4.3. Focus of the Thesis ...22
4.4. Demonstration Approach ...23
4.5. Conclusions ...23
5. END-TO-END SYNCHROPHASOR SYSTEM EVALUATION ...24
5.1. Background ...24
5.2. Standard Requirements ...24
5.3. Type Testing ...27
5.3.1. Type Testing Setup ...28
5.3.2. Type Testing Methodology ...31
5.4. Application Testing ...33
5.4.1. Application Test Methodology ...34
5.4.2. Fault Location Application ...35
5.5. Field Test Set - FTS ...39
5.5.1. FTS – Functional Description ...40
5.5.2. Use of FTS in Field-Testing ...41
5.5.3. FTS – Signal Replaying ...42
5.5.4. Synchrophasor Comparison Logic ...45
5.6. Nested End-to-end Testing Using a Portable Test Set ...46
5.6.1. Levels of Nested Testing ...46
5.6.2. Network-Based Nested Testing ...52
5.6.3. Life-Cycle Testing Stages ...56
5.7. Conclusions ...59
6. RESULTS ...61
6.1. Implementation of Application Tests in the Field Environment ...61
6.1.1. Analysis of Application Test Implementation ...61
6.1.2. Result Assessment ...64
6.2. Nested End-to-end Calibration Using A Portable Test Set ...64
6.2.1. Test Plan for Nested End-to-end Test Demonstration ...64
6.2.2. Calibration Test in Controlled Environment...65
6.2.3. Maintenance Test with Error Detection ...69
6.2.4. Troubleshooting Test with Multiple Error Sources ...70
6.2.5. Result Assessment ...72
6.3. Evaluation of a Network-Based Nested Testing Approach ...73
6.3.1. Result Assessment ...77
6.4. Conclusions ...79
x
7.1. Conclusions ...81
7.1.1. Need for Improved Synchrophasor System Analysis ...81
7.1.2. Overview of Proposed Concepts ...81
7.1.3. Validation of Hypothesis ...82
7.2. Summary of Contributions ...85
7.3. Future Work ...86
REFERENCES ...87
xi
LIST OF FIGURES
Page
Figure 1: Synchrophasor System Example Architecture. Adapted with permission from [19]. .... 5
Figure 2: Synchrophasor Data Flow in the North American Power Grid. Reprinted from [11] .... 6
Figure 3: Waveform to phasor correlation ... 7
Figure 4: Nested testing strategy enabling End-to-End testing of synchrophasor system ... 11
Figure 5: Benefit of Establishing a Calibration Threshold ... 28
Figure 6: Block diagram of a NIST PMU test system. IRIG-B stands for the Inter-Range Instrumentation Group time code B. CT refers to current transformer. Reprinted from [24]. ... 30
Figure 7: Individual Test Sequence Flow Chart ... 32
Figure 8: Effect of uncertainty on testing evaluation with a) TUR 4, b) TUR 10. Adapted with permission from [7]. ... 33
Figure 9: 5-bus Fault Location Test System ... 35
Figure 10: Fault Location - Phasor to Signal Correlation for Line 2 Fault at 66% ... 37
Figure 11: Impact Evaluation on Fault Location Application. Reprinted with permission from [19]. ... 39
Figure 12: Field Test Set Hardware ... 41
Figure 13: Implementation of Field Test Set for Evaluation of Synchrophasor System. Adapted with permission from [19]. ... 42
Figure 14: Type Test Signal Generation with Reference Phasor Stream ... 44
Figure 15: Application Test Signal Generation with Reference Phasor Stream ... 44
Figure 16: Synchrophasor Comparison Logic - Flow Chart ... 46
Figure 17: Time module test setup a) without intrusion, b) with intrusion. Adapted with permission from [19]. ... 47
xii
Figure 19: PMU test setup a) without intrusion, b) with intrusion. Adapted with permission
from [19]. ... 50
Figure 20: PDC test setup a) without intrusion, b) with intrusion. Adapted with permission from [19]. ... 51
Figure 21: Application Level Evaluation. Adapted with permission from [19]. ... 52
Figure 22: Network Based Nested Testing Setup ... 54
Figure 23: Advanced Network Based Nested Testing System ... 55
Figure 24: Advanced Network Based Nested Testing Logic... 56
Figure 25: Fault Location – Phasor Magnitude Evaluation for Line 2 Fault at 66%... 62
Figure 26: Fault Location – Phasor Angle Evaluation for Line 2 Fault at 66% ... 63
Figure 27: Timing Integrity Evaluation through Comparison of Extracted PPS Signal of Commercial Clock (blue) and GPS Signal (yellow) ... 66
Figure 28: Test Result Visualization of Calibration Test. Adapted with permission from [19]. .. 68
Figure 29: Maintenance Test Result Visualization. Adapted with permission from [19]. ... 70
Figure 30: Test Result Visualization of Troubleshooting Test. Adapted with permission from [19]. ... 71
xiii
LIST OF TABLES
Page
Table 1: Listing of defined type tests. Adapted from [7] ... 20
Table 2: C37.118.1(a) TVE thresholds. Adapted from [7]. ... 26
Table 3: Proposed Test Mode Use-Cases ... 59
Table 4: Application Test Evaluation - Phasor vs. Application Output Error ... 63
Table 5: Nested End-to-end Test in Controlled Environment - Results ... 68
Table 6: Maintenance Test Result Overview ... 69
Table 7: Troubleshooting Test Results Overview ... 71
Table 8: Network Based Synchrophasor Comparison Points ... 74
1
1. INTRODUCTION
1.1. Overview of Power System Monitoring Importance
The electrical power grid, as one of today’s most critical infrastructures, requires constant monitoring by operators to be aware of and react to any threats to the system’s condition. With control centers located far from sub stations and other points of interest, data measured and monitored in the field conclude the basis for all control decisions in the power system. For that reason, it is imperative to ensure the highest level of data integrity as erroneous data may lead to inappropriate control actions with potentially devastating consequences.
As the power system is constantly exposed to different kinds of disturbances, it is important to capture data throughout the wide-ranging system to counteract the potentially severe impacts [1]. Monitoring not only aims at withstanding disturbances and providing reliable continuous operation, it also aims at protecting the power apparatus, whose failure has much more severe impacts than temporary outages [2].
Analysis of events such as the severe blackout in North America that affected parts of the US and Canada on August 14th, 2003 [3], has shown that the design of the Energy Management
System (EMS) is inadequate for monitoring heavily dynamic power system behavior. This created a need for improved monitoring technology, which resulted in efforts to promote synchrophasor technology. The North American SynchroPhasor Initiative (NASPI) was the leading force in improving “power system reliability and visibility through wide area measurements and control” through synchrophasor technology [4].
2
1.2. SCADA vs. Synchrophasor Systems
According to [5] “the accurate time resolution of synchrophasor measurements allows unprecedented visibility into system conditions, including rapid identification of details such as oscillations and voltage instability that cannot be seen from SCADA measurements”. With reporting rates of up to 120 synchronized data frames per second, synchrophasor technology has a superior role in monitoring and analysis of Power Systems over the legacy SCADA system that only reports every 4-6 seconds. While the SCADA system also monitors other information, such as breaker states that do not require such frequent updating, synchrophasor technology has already redeemed SCADA for monitoring of voltage, current and frequency of the power system. Using synchrophasors not only helps improving the monitoring aspect of power systems, but also helps improving models through PMU data validation, as shown for a generator model in the Bonneville Power Administration [6].
1.3. Monitoring System Performance During Emergency in Power Systems The merit of synchrophasor data certainly lies within the improved dynamic capabilities over the SCADA system. Especially its large-scale compatibility due to synchronization of the PMUs is incredibly helpful concerning analyzing dynamic events, such as faults. While some work has been done to analyze synchrophasors under fault conditions or power swing, the important issue of monitoring the actual system performance and therefore ensuring data integrity during such events has not been properly addressed so far. One of the few attempts to characterizing such behavior using replayed fault waveforms is described in this thesis with results presented in chapter 6.1.
3
1.4. Importance of Field Testing
Many previous efforts are focused on testing and evaluating synchrophasor systems or components in a controlled laboratory environment, which will be elaborated later in the review of prior work. While these efforts are very important to uphold and improve the design quality, the methods and tools are very often not feasible for field environments. Field-testing imposes special requirements on the testing methodology: tools portability, automation of test procedures, and ease of operation suited for technicians. It is very important to perform tests of a system in the field after being installed and fully capture any characteristics specific to the non-controlled field environment. For that reason, it is necessary to develop tools and methods that work around these constraints, such as the Field Test Set and the end-to-end methods presented and used in this thesis.
Another important aspect is the security and troubleshooting aspect of a setup that requires minimum impact and downtime for testing and troubleshooting purposes, while maintaining a great level of accuracy. Many issues like network and security constraints or compatibility of other substation equipment are likely to be different from what is found in a laboratory
environment, which adds to the special needs when evaluating field equipment or installations. 1.5. Thesis Organization
Chapter 1 provides an introduction to the importance and general matter of power system monitoring. The new synchrophasor technology is put in comparison to the legacy SCADA system. It also elaborates on the field-testing importance for synchrophasor systems.
Chapter 2 gives an introduction to the background of synchrophasor systems and provides requirements for field testing techniques and evaluation criteria.
4
Chapter 3 looks at previous work and establishes the state-of-the-art, focusing on synchrophasor system development and analysis, and evaluating their impact on the testing requirements. Shortcomings are analyzed and outlined for evaluation in this thesis.
Chapter 4 describes the importance and key problems this thesis is trying to address and resolve. It poses a hypothesis that if type (design) and application tests, as well as
commissioning, maintenance and troubleshooting tests are performed on synchrophasor systems in the field, then the synchrophasor stream and application output will be more accurate and reliable, which improves system quality and helps ensure continuous power system operation.
Chapter 5 gives a detailed explanation of synchrophasor system evaluation methods using type and application tests. Both existing and novel methods are presented. This chapter also presents testing tools developed for evaluating synchrophasor systems in the field.
Chapter 6 gives further input on how to apply the methods and tools introduced in chapter 5 by providing step-by-step instructions for end-to-end testing in the field.
Chapter 7 provides results to illustrate the feasibility and credibility of the proposed methods and tools.
Chapter 8 summarizes the work and contributions of this thesis and outlines open issues out of the scope of this thesis to be addressed in future work.
References quoted in the Thesis and list of papers published by the author are given at the end.
5
2. BACKGROUND
2.1. Synchrophasor Systems and Applications
According to the IEEE standard for synchrophasors [7] and its amendment [8],
synchrophasors are time-synchronized measurements of so-called phasors. The units that are located in substations and perform these measurements are called Phasor Measurement Units (PMUs). They are using a reference time signal provided by a GPS/GNSS synchronized clock to sample voltage and current waveforms, and consequently calculate an estimate of the magnitude, frequency and phase angle from the waveform samples. They are used to create phasors that are then streamed to Phasor Data Concentrators (PDCs) located in the control center via specified protocols [9]. PDC performance requirements are specified in [10]. An example of an
architecture of such a system is shown in Figure 1.
Station 1 Station 3 Time receiver GPS GPS PMU PMU PMU PDC Time receiver PMU PMU PMU PDC WAN Station 2 Time receiver GPS PMU PMU PMU PDC Control Center PDC End user application
6
Large deployment of interconnected PMUs provides phasor data streams as shown in Figure 2, which beneficially increases the observability as well as the visibility of Power System
operations in the USA. The additional benefit of acquiring up to 120 data frames per second, as opposed to the existing Supervisory Control and Data Acquisition (SCADA) System that typically reports data every 4-6 seconds, gives synchrophasor technology a superior role in monitoring and analysis of Power Systems. This is one of the reasons for field deployment of PMUs in the USA increasing by a factor of 10 within the last 10 years, reaching well over 2,500 units installed so far [11]. Its functionality covers a wide range of applications that encompass, among others, Phase Angle Monitoring [12], Fault Location [13], Oscillation Detection [14], Wide Area Monitoring and Control [15], as well as Modeling Improvements [16]. Other applications for current and future uses are listed in [17].
7
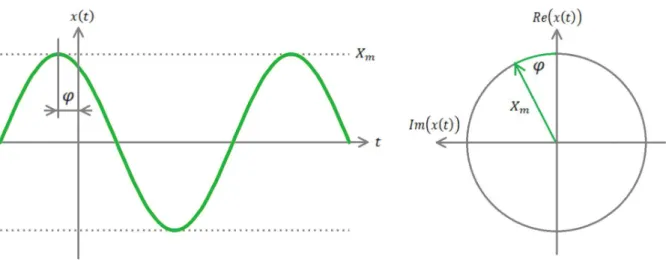
2.2. Phasor Representation
Phasor representation of waveforms is very commonly used in power systems to represent node voltages and line currents under the assumption of constant frequency or steady state for the time frame under consideration. A sinusoidal waveform is defined as follows [7]:
𝑥(𝑡) = 𝑅𝑒 √2𝑋𝑒 = 𝑋 cos(𝜔𝑡 + 𝜑),
where the phasor X is a complex number:
𝑋 = |𝑋|𝑒 = |𝑋|∠𝜑 = |𝑋| cos(𝜑) + 𝑗|𝑋| sin(𝜑) |𝑋| = 𝑋 /√2
The magnitude of a phasor is the RMS value of the waveform. The value of 𝜑 depends on the time scale, particularly where 𝑡 = 0. It is important to note this phasor is defined for the angular frequency 𝜔; evaluations with other phasors must be done with the same time scale and frequency.
8
2.3. Sychrophasor Reference for PMU Characterization
According to the IEEE standard C37.118.1 [7], a reference system or calibration device for PMUs needs to meet national standards and perform with a test uncertainty ratio of four or better in comparison to the test requirements. The defined evaluation of Phasor Measurement Units (PMUs) uses a metric called Total Vector Error (TVE) that uses a ratio of the output
synchrophasor stream to an expected reference. This reference consists of the test signals described in the standard, which defines the composition of generated analog input waveforms provided to the input of the PMU under test. An IEEE working group worked on the Definition of Accurate Reference Synchrophasors for Static and Dynamic Characterization of PMUs [18]. In a laboratory environment, this can be achieved by establishing a calibrated reference system capable of providing highly accurate results for comparison. In the field where establishing and maintaining such a reference system is not feasible, this may be accomplished by using a portable test set featuring such capability. However, this functionality is currently not commercially available, which creates a need for such testing tools.
In this thesis, this concept of a reference will also be adopted for application tests.
Application tests use signal replaying based on simulated or measured waveform data to recreate pre-defined waveform scenarios for testing the synchrophasor systems and respective
applications. While there is no standard available for application tests, the prior knowledge of the waveform data will be leveraged and used as a reference for evaluation purposes. This requires synchronization with an accurate timing source to align the replayed waveforms with the
reference data. Establishing a reference for application tests creates even bigger challenges based on the dynamic input data of certain applications. A reference system calibrated according to the standards [7]-[9] might not be able to capture the full range of input signals, which strengthens
9
the call for new testing tools. This issue is addressed in this thesis by proposing methodology and tools novel to field-testing of synchrophasor systems.
2.4. Field Testing of PMUs and Synchrophasor Systems
While acceptance tests are typically performed in a controlled lab environment to ensure reproducible results when evaluating performance requirements of a device or module, field-testing aims at addressing the constraints and needs of setups in the field. Field-field-testing comprises commissioning, calibration, periodic maintenance, and troubleshooting tests. As mentioned in chapter 2.3, establishing a reference for testing in the field is extremely challenging and has not been properly addressed so far. This leaves current testing practices and tools with a limited ability to fully characterize and evaluate a synchrophasor system in the field, which is addressed in this thesis.
The status of field equipment and all its components when installed or after continued service for an extended period of time is typically unknown. In addition, some updates to the system may include adding new components or reconfiguring existing ones, causing slightly different base performance. For that reason, the field-testing methodology covers several different aspects:
Commissioning Test
This test verifies the proper installation of a system and characterizes all its components to determine the connection status, detect anomalies in device and system behavior, and
consequently establish a working environment for operation and future testing by addressing erratic behavior.
10 Calibration
This form of testing is used to calibrate a system and its components to assert characteristic behavior, adjust variable control factors, and establish a reference for operation and future testing to optimize a systems performance. This test is typically performed after commissioning and before the system goes into production mode, and then again in regular intervals to ensure consistent system operation. It usually consists of a full suite of type and possibly application tests, and is performed in a controlled non-attack environment.
In-field Test
Also referred to as a periodic maintenance test, it may be performed during normal operation or periodically recurring system maintenance sessions to ensure safe and reliable operation. This test is be used to re-evaluate a systems calibration status and detect any hidden anomalies by replaying and evaluating selected test scenarios, as well as comparing results with the initial calibration test results. This test predominantly uses type test waveforms to check for intrusions and system health but may entail application tests if needed.
Troubleshooting Test
Being aware of a certain problem in the system, either by performing an In-field test or through another detection approach requires troubleshooting to resolve the problem. Using the same tools as for commissioning, calibration and periodic maintenance, the methodology and especially the replayed waveforms can be tailored to pinpoint the source and extent of erratic behavior. This aims to assess the problem and determine potential counter measures. The tests may entail both type and application signals.
11
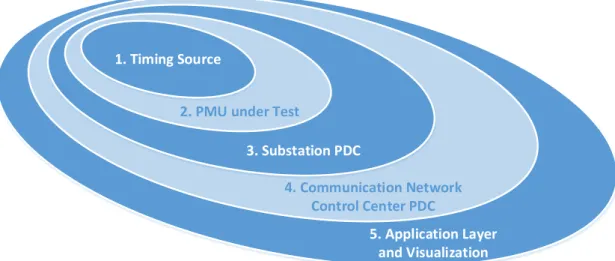
2.5. Field Implementation of End-to-end and Nested Testing
To evaluate the end-to-end integrity of a synchrophasor system in the field, this thesis introduces the concept of nested testing for synchrophasor applications [19] and [20]. The idea of this testing methodology is to evaluate all components of a system layer by layer with a bottom up approach, as shown in Figure 4, using a portable test set.
Starting with the timing reference, i.e. GNSS clock receiver, the span of the test loop is gradually increased to include PMUs, PDCs, communications network and finally an end-user application. The mentioned papers [19] and [20] not only describe the development of a test methodology, but also the implementation of the portable modules as well as a calibration laboratory to determine the impact of erroneous behavior on a synchrophasor system using nested testing.
1. Timing Source
2. PMU under Test
3. Substation PDC
4. Communication Network Control Center PDC
5. Application Layer and Visualization
12
2.6. Indicators of Irregular Synchrophasor Data
The goal of synchrophasor system testing procedures is to evaluate system’s performance including its components, and to reveal potential indicators of irregular behavior. Some of the most common reasons for irregular behavior are as follows [19], [21]:
Calibration: One or more modules in the system are poorly calibrated.
Measurement: Erroneous PMU filter design or issues due to measurement channel. Communication: Latency, network congestion, or failure of communication nodes. Malfunctions: One or more modules in the system fails and show unexpected behavior. Synchronization Error: PMU is not properly synchronized with a timing source.
Intrusion: Malicious attacks may affect system behavior.
13 3. PRIOR WORK 3.1.Standardization
Over the years, a lot of standardization work was done to accelerate the development and use of synchrophasor systems. In 2005, an IEEE working group released the first version of the standard C37.118-2005 [22] specifying requirements for the use of synchrophasors for power systems and introducing the concepts of compliance tests, Total Vector Error and the “Absolute Phasor” referenced to UTC. This document replaced the original standard IEEE Std. 1344-1995, that was reaffirmed in 2001. In 2011, the C37.118-2005 standard evolved into the two standards C37.118.1 [7] and C37.118.2 [9], covering measurement provisions and data communication, respectively. Further test methodology clarification was provided, the testing concepts were expanded, and dynamic tests have been introduced. Furthermore, two performance classes were introduced: 1) P-class (Protection), intended for applications requiring fast response and no explicit filtering requirements, and 2) M-class (Measurement), intended for less time-sensitive applications that may be affected by aliasing, which implies specific filtering performance. This often affects specification of a desirable PMUs dynamic response. In 2013, efforts to improve synchrophasor performance resulted in a Guide for Phasor Data Concentrator Requirements for Power Systems [10]. In 2014, the standard C37.118.1 was amended with C37.118.1a [8] to modify selected performance requirements. This relaxed some constraints that were deemed unrealistic, especially regarding Rate Of Change Of Frequency (ROCOF) errors, as
computational methods for interaction between phasor, frequency and ROCOF were not developed well enough at the time of publication.
14
3.2. Lab Implementation of Standardized Tests
Based on the requirements of the aforementioned standards, there have been some developments of calibration laboratories, incorporating the standardized form of testing. In a joint effort, the Bonneville Power Administration (BPA) and Pacific Northwest National Laboratory (PNNL) published their work on standardized testing in 2006 [17]. The used standardized testing approach for PMUs was creating waveform data in COMTRADE format from simulation data and replaying it synchronously to a PMU using a commercial test set. With that method, the used test set was not able to generate the analog waveforms accurate enough to fully characterize the PMU under test. In 2007, G. Stenbakken, working for the National Institute of Standards and Technology (NIST), developed a dynamic PMU performance measurement system [24]. Furthermore, an analysis model was proposed. The system demonstrated the necessary accuracy to determine dynamic errors in PMU measurement quantities, such as TVE and Rate of Change of Frequency (ROCOF). In the same year the North American
Synchrophasor Initiative (NASPI) Performance and Standards Task Team (PSTT) published two integral documents, [25] and [26], with the intent to cover instrument transformers used by PMUs, which improved the team’s earlier work [27] and [28], as elaborated in [29]. The first document being a guide for PMU System Testing and Calibration, featuring a multitude of test descriptions to be performed on PMUs, such as conformance, performance, interoperability and acceptance tests. The second document elaborates on impacts on phasor measurements caused by instrumentation channels. While this work has provided some good suggestions and insights to PMU testing, it does not address comprehensive testing of the entire synchrophasor system and its operation in the field. In a separate effort, a working group provided a Definition of Accurate
15
Reference Synchrophasors for Static and Dynamic Characterization of PMUs [18], which helped create a better understanding of synchrophasor references for testing.
In 2012 and 2013 NIST published papers [30] and [31], featuring the development of a PMU calibration system with an estimated uncertainty of 0.05%, which was a major
improvement to the setup used in 2007. Early efforts to create test environments for assessing the dynamic test requirements of the standard amendment [8] were presented in [32], but failed to fully exploit the level of anticipated accuracy required by the standard in their tests. A joint effort of NIST with the IEEE Conformity Assessment Program (ICAP) later published the
Synchrophasor Measurement Test Suite Specification Guide [33], which developed a thorough procedure and guidelines for performing PMU certification tests. That document provided requirements for equipment used for PMU testing, measurements made by PMU test equipment and reporting of measurements in a controlled laboratory environment. It still does not address the use and calibration of equipment in a field environment. The greater level of detail than the standard for PMU performance, and the specification of test procedures, as well as calculation and test implementation are targeting potential ambiguities in the standard. These guidelines were followed in an effort to develop a PMU calibrator at the Texas Engineering Experiment Station (TEES) at Texas A&M University. The TEES calibration system was evaluated and calibrated by NIST in 2018 and will serve as a reference for the measurements and tests
performed throughout this Thesis. The importance of the impact of Instrument Transformers (IT) on the calibration of synchronized measurement systems was emphasized in [34], which claimed to be a benchmark for the IT+PMU chain characterization. While this part focuses on including ITs into the test loop, the impact of the PMU design on the synchrophasor output would be
16
represented better by bypassing both instrument and auxiliary transformers for calibrating PMU systems through creation of low-level test signals, as mentioned in [19].
3.3. Guidelines for Non-Standardized Tests
Other work focused on providing guidelines and sharing early experiences accumulated by practitioners. The IEEE Guide for Synchronization, Calibration, Testing, and Installation of PMUs for Power System Protection and Control C37.242 [35] gathers helpful information on installing and testing PMUs and provides a practical guide for that purpose. The same topics have also been addressed in earlier published documents such as NASPIs’ A Guide for PMU Installation, Commissioning and Maintenance (2006) [36] and [37], or the PMU System Testing and Calibration Guide (2007) [38]. In an effort to verify interoperability and application
performance of PMUs, PMU-enabled IEDs and PDCs, different groups tested devices from multiple vendors and in collaboration with industry helped improve detected interoperability issues [33], [34].
The work referenced above is based on the assumption that the signals observed by the PMU are sinusoidal. It specifies accuracy thresholds that need to be met under, at least near-sinusoidal conditions. These assumptions may not always be correct under power system transients such as the ones generated during power system fault conditions. NASPI’s document titled A report on Using PMU Data Under Fault Conditions that is currently under a revision, elaborates on the use of PMU data under fault conditions and provides insights into the applicability of the
standardized requirements imposed on the PMUs. According to that report, a large factor in the PMUs ability to characterize the input waveforms under fault conditions is the length of the data window of the sampled data considered by the PMU algorithm. While longer windows, i.e. 2-10 cycles, were less susceptible to noise and performed better for near steady state signals, the
17
expected values deviated more from the estimated values than for smaller window size. In the report, this was demonstrated by comparing analog waveform data captured by a DFR to
waveform signals reconstructed from PMU phasors corresponding to the same input. Decreasing the data window size, however, seemed to result in a lack of meaning for anything other than waveform reconstruction, which makes the accuracy measures imposed by the standard irrelevant for PMU operation under fault conditions. This knowledge can be used for fault detection purposes by leveraging information about the “Goodness of Fit” metric and shows the importance of such evaluations in the field. The general issue of having a trade-off between phasor estimation quality and dynamic is recognized but not fully addressed in the C37.118.1 standard by introducing performance classes, as mentioned at the beginning of this chapter. This discussion provides valuable considerations as to how a system can be tuned to an application, which is especially useful for application tests corresponding to dynamic behavior. The transfer and application of these insights in field-testing has not been addressed so far.
3.4. Tools and Methodologies for Synchrophasor System Performance Assessment A practical approach to PMU testing using a real time simulator for large-scale power system simulation was introduced in [41]. The development of a smart grid test bed, as well as applications in PMU and PDC testing using real time simulators is further discussed in [42]. A more recent publication [43] analyzed and characterized uncertainty contributions in a high-accuracy PMU validation system that used a similar methodology and hardware setup as earlier work [30]-[33]. This identified potential uncertainty contributors to be considered when
establishing laboratory setups for synchrophasor calibration, but also confirmed the effectiveness of the used hardware and setup.
18
The work presented in [44] uses multilevel end-to-end testing to asses synchrophasor measurements during faults. The presented test framework was developed to incorporate type tests, application tests and end-to-end tests. This first step towards comprehensive testing of synchrophasor systems was designed for laboratory environments and validated based on real time simulator data. However, this work is not directly applicable to field applications, which is a critical issue that needs to be addressed.
3.5. Conclusions
To summarize the analysis in this chapter, there are standards available to define PMU design, PDC behavior, and synchrophasor data transfer but these standards only focus on their respective areas of operation. Previous work has mainly focused on type test waveforms that were defined to evaluate PMU design performance. First advances towards more comprehensive testing methods, including end-to-end testing, were limited to controlled laboratory
environments. The analysis has also shown that testing tools for more comprehensive tests are not readily available, nor feasible for field-testing since they rely heavily on simulated
waveforms rather than actual field data. This creates a need for end-to-end testing methods and tools to evaluate the overall system performance of interconnected synchrophasor systems in the field environment. Additionally, new methods and tools for application testing in the field are needed to evaluate the performance of existing systems up to the end-user application level more accurately and realistically.
19
4. PROBLEM STATEMENT 4.1. State of the Art 4.1.1. Performance issues
With synchrophasor systems constituting an integral part of power system monitoring and control, the goal is to provide highly accurate phasor data to system operators. Besides making sure the PMUs meet necessary accuracy requirements, this entails ensuring the highest level of data quality and integrity for all relevant operational data received in the control center.
Based on the nature of phasor estimation techniques it is not possible to capture power system dynamic behavior in full. With the right test methodology, however, it can be determined how well dynamic behavior is represented in a specific setup and what impact it imposes on an application. Unfortunately, the available standards and guides associated with synchrophasor systems are not yet formulated to characterize such impacts, which causes a lack of
commercially available testing tools appropriate for field-testing. 4.1.2. Existing standards
The existing standards and guides are aimed at defining the design performance
requirements for Phasor Measurement Units (PMUs), Phasor Data Concentrators (PDCs), and associated communications [7]-[10]. These standards are introducing design tests also called type test aimed at characterizing components of the synchrophasor system according to the design requirements stated in the standards. For PMUs, this is done by defining a suite of steady state and dynamic test waveforms, as shown in Table 1, and evaluating the PMUs ability to replicate the characteristics of these replayed waveforms.
20
Table 1: Listing of defined type tests. Adapted from [7] Influence
Quantity
Influence Range Reference Condition M-Class P-Class Steady State Tests Frequency Range ±2.0 Hz for 𝐹 < 10 ±𝐹 5 for 10 ≤ 𝐹 < 25 ±5.0 Hz for 𝐹 ≥ 25 ±2.0 Hz 𝐹 Voltage Magnitude
10% to 120% rated 80% to 120% rated 100% rated Current
Magnitude
10% to 200% rated 10% to 200% rated 100% rated
Phase Angle ±𝜋 radians ±𝜋 radians Const.
Harmonic Distortion 10%, each harmonic up to 50th 1%, each harmonic up to 50th <0.2% THD1 Out-of-Band Interference 10% of signal magnitude for 𝐹 ≥ 10, No requirement for 𝐹 < 10 N/A <0.2% of signal magnitude Dynamic Tests Measurement Bandwidth Modulation Frequency 0.1 to min( 𝐹 5 ,5Hz) Modulation Frequency 0.1 to min( 𝐹 10 ,2Hz) 100% rated magnitude Frequency Ramp ±MIN( 𝐹 5 ,5Hz) @ ±1.0 Hz/s ±2.0 Hz @ ±1.0 Hz/s 100% rated magnitude Magnitude Step Change ±10 % All nominal Angle Step Change ± 𝜋 18 All nominal
21
4.1.3. Performance Issues not Covered by Existing Standards
The impact on end-user applications caused by design performance shortcomings is not covered by the standards and no methodology or testing tools exists to asses such impacts. Design test waveforms are not directly associated with any application but rather with an ability of PMUs to calculate phasors accurately under some know waveform imperfections. Introducing application tests consequently increases the ability to assess the application’s performance.
4.2. Hypothesis
Analysis of state-of-the-art developments has shown that tools and methods specifically designed for evaluation of synchrophasor systems in the field are not readily available on the market. To address the restrictions of available equipment, combining the capabilities of a portable test set with improved test methods will revolutionize the aspect of field-testing.
The hypothesis posed in this thesis is that if type (design) and application tests, as well as commissioning, maintenance and troubleshooting tests are performed on synchrophasor systems in the field, then the synchrophasor stream and application output will be more accurate and reliable, which improves system quality and helps ensure continuous power system operation. This can be achieved using improved methodology and a portable test set, and features several different aspects:
Using a portable Field Test Set (FTS), described in this thesis, makes field-testing of synchrophasor systems accessible by addressing the feasibility issues of established laboratory methods. Its use of small signal testing is expected to achieve more accurate results while also making it feasible to deploy in a field environment. The prevailing need for enhanced end-to-end testing methods can be addressed with a
22
Hypothesis that performing nested end-to-end tests enables calibration of individual modules in the field system while evaluating the end-to-end system performance. It is also expected to detect and locate potential anomalies from the timing source to the end-user application, which increases its functionality over existing methods. A network based nested testing approach will further improve the concept of field
testing by enabling parallel evaluation of all nested levels, which will improve the critical aspect of down-time for testing and usability. If proven feasible, this concept may be adopted as a new standardized framework for field testing and monitoring. Including both type and application tests into the field-test sequence allows
evaluation of the entire synchrophasor system more accurately. It can differentiate between impacts on the synchrophasor quality and the application output. Using specific grid models and field measurements helps tune the setup towards individual applications.
4.3. Focus of the Thesis
This thesis provides insights on methodology and tools for field-testing of synchrophasor systems. Existing testing practices and methods are analyzed, tested, and described in regard to field testing. The thesis develops a methodology and testing techniques, as well as tools to address the issues found with existing practice mostly defined for laboratory testing. The focus of this thesis is to provide instructions on how to use these tools and techniques to perform end-to-end evaluations of synchrophasor systems using a portable test set. This will improve the overall performance of synchrophasor systems in the field and help make power system calibration, commissioning, and maintenance more accessible and reliable.
23
4.4.Demonstration Approach
The concepts and methods presented in this thesis are demonstrated using a large-scale test bed at the Texas Engineering Experiment Station (TEES) at Texas A&M. The developed tools are evaluated and verified against a synchrophasor reference calibration laboratory that was developed, tested, and evaluated in collaboration with NIST at Texas A&M. The tools are then implemented in the respective setups described in chapter 5 and used for performing tests following the step-by-step description provided. The results obtained from performing the full test sequences are then analyzed and presented in chapter 6, which is expected to confirm the developed hypothesis.
4.5. Conclusions
In conclusion, enhancing the scope of testing from so-called type tests defined in the standard to include application tests developed for end-to-end assessment helps in assessing application performance more accurately. In order to utilize these tests in non-controlled field environments, not only the methodology, but also testing tools need to focus on constraints imposed by field-testing. Current testing practices and tools do not fully cover these issues, which is addressed in this thesis.
Some of the proposed solutions to address these issues include: implementation of a nested end-to-end testing approach using a portable FTS, using specific grid models and field
measurements to tune the setup towards individual applications, and a proposed network based nested testing approach will further improve the concept of field testing and enable parallel evaluation. The presented tools and methods are expected to improve the overall performance of synchrophasor field systems and make system calibration, commissioning, and maintenance more accessible and reliable, which will be demonstrated using a large-scale testbed.
24
5. END-TO-END SYNCHROPHASOR SYSTEM EVALUATION*
5.1. Background
End-to-end testing is a very common approach for testing power system protection
solutions. Starting in the late 1980’, this method has continuously gained popularity as more and more devices in the protection chain became digital. It transforms the complex functions of individual modules into a black box and uses only the necessary inputs and outputs, as mentioned in [46]. With the recent introduction of synchrophasor modules, it is necessary to adopt the end-to-end testing approach to explicitly evaluate the performance of synchrophasor systems.
For synchrophasor systems, end-to-end testing includes evaluation from the timing source to the end-user application. This chapter addresses requirements imposed on a synchrophasor system and how these can be tested for using type and application tests. A test set with unique functionality specifically developed for testing in field environments is described and its distinguishing features are highlighted. Testing methods such as nested end-to-end testing leveraging the specialized features of the Field Test Set are described for evaluation of
synchrophasor systems in the field. The individual stages of such tests are thoroughly explained and improved techniques such as network-based nested testing are presented.
5.2. Standard Requirements
The standards associated with synchrophasor systems [7]-[10] not only define the various ways a system should be tested, but also imposes requirements on the outcome of the respective
* Parts of this section are reprinted with permission from from C. Seidl and M. Kezunovic, "Tools for End-to-end Analysis, Calibration and Troubleshooting of Synchrophasor Systems", ISGT Europe 2019, Bucharest, Romania, 2019, pp. 1-5. Copyright 2019, IEEE
25
testing procedures. A commonly used metric introduced and specified in the standard [7] is the so-called Total Vector Error (TVE). It is defined as follows:
𝑇𝑉𝐸(𝑛) =
𝑋 (𝑛) − 𝑋 (𝑛) + 𝑋 (𝑛) − 𝑋 (𝑛) 𝑋 (𝑛) + 𝑋 (𝑛)
“where 𝑋 (𝑛) and 𝑋 (𝑛) are the sequence values estimated by the unit under test. 𝑋 (𝑛) and 𝑋 (𝑛) are the theoretical sequence values of the input signal at time (n) assigned by the unit to those values”. PMUs in compliance with the standard [7] and its amendment [8] are therefore known to fall within a certain range of accuracy defined by TVE values when being compared to the expected reference value of the defined input. The respective TVE thresholds requirement for each test is listed in Table 2.
26
Table 2: C37.118.1(a) TVE thresholds. Adapted from [7]. Influence
Quantity
TVE Threshold Reference
Condition M-Class P-Class Steady State Tests Frequency Range 1 1 𝐹 Voltage Magnitude 1 1 100% rated Current Magnitude 1 1 100% rated
Phase Angle 1 1 Const.
Harmonic Distortion 1 1 <0.2% THD2 Out-of-Band Interference 1.3 None <0.2% of signal magnitude Dynamic Tests Measurement Bandwidth 3 3 100% rated magnitude Frequency Ramp 1 1 100% rated magnitude Magnitude Step Change Defined in table as function of reporting rate [7] Defined as response time: 1.7/𝑓 All nominal Angle Step Change Defined in table as function of reporting rate [7] Defined as response time: 1.7/𝑓 All nominal
27 5.3. Type Testing
Type test waveforms were developed to standardize PMU performance, which in return means any PMU complying with the standard will have no more than a pre-defined uncertainty error when measuring these waveforms and computing the corresponding phasor. For the purpose of evaluation, the TVE is used as a threshold metric, see chapter 5.2. Any PMU exceeding those thresholds is therefore expected to indicate a malfunction or intrusion.
Deviations of performance that stay within the specified limits may not always be detected when solely observing the standard’s limits. More precise thresholds for this evaluation can be
determined by performing lab tests for device characterization and calibration tests for field installation evaluation. For calibration, this can be formulated as follows:
“The systems response can be characterized to get a more accurate analysis of the system to be used later on during troubleshooting. If initial testing shows elevated TVE errors for certain type tests after being installed, such errors will not be classified as a malfunction at a later point in time. By detecting and locating such issues early on, the corresponding error threshold can be adjusted not to create alarms during in-service system operation, for such levels of error.”
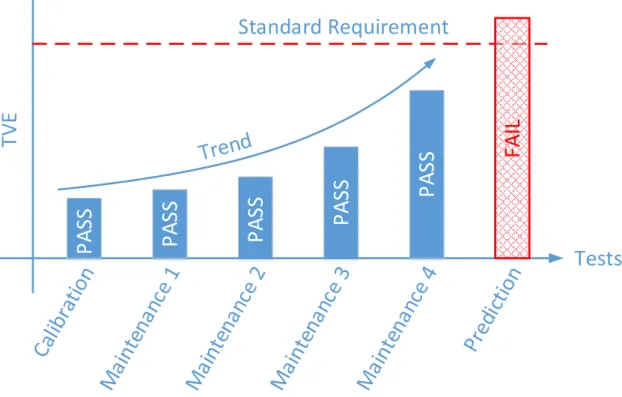
Establishing a calibration threshold is especially useful for detection of gradual performance deterioration, as shown in Figure 5. This graph shows an example of performance results of a system with TVE values increasing over time, i.e. the performance is deteriorating. The TVE values throughout periodic follow-up maintenance measurements are continuously increasing. Following this trend would suggest that the next measurement could be outside of the specified
28
limits. This information can be used to issue work tasks to counteract this trend, such as re-calibration or replacement of a device. Monitoring the status of a system and comparing it to its calibration state can therefore help to take preemptive actions to avoid that a system falls outside of the limits required by the standard.
PA
SS
PA
SS
Tests
TV
E
Standard Requirement
PA
SS
PA
SS
FA
IL
PA
SS
Figure 5: Benefit of Establishing a Calibration Threshold
5.3.1. Type Testing Setup
To observe and enforce a systems conformance with the standardized guidelines, a test setup that can implement the corresponding testing and calibration techniques is needed. The IEEE
29
Test Suite Specification [24] gives recommendations and guidance to achieve a calibration setup capable of classifying and calibrating PMUs and/or synchrophasor systems, as shown in Figure 6. Using proper testing methodology the setup’s capability can be expanded to serve entire synchrophasor systems, which is explained in chapter 5.6.
The most critical part in the calibration is to ensure an accurate timing source to be able to precisely determine systems’ performance. This can be achieved in various ways, but always requires a reference known to be accurate enough to test and calibrate the devices and setup under consideration. While this thesis uses the approach outlined in chapter 5.6.1.1 to ensure the necessary timing integrity, [45] presents a more sophisticated approach including a hardware design specifically developed to detect any anomalies in the timing system. Coincidentally, this timing module was developed, tested and deployed for a DOE project called “TIMER” that combines the timing integrity check with the end-to-end testing methodology presented in chapter 5.6. Test results are be presented in chapter 6.2.
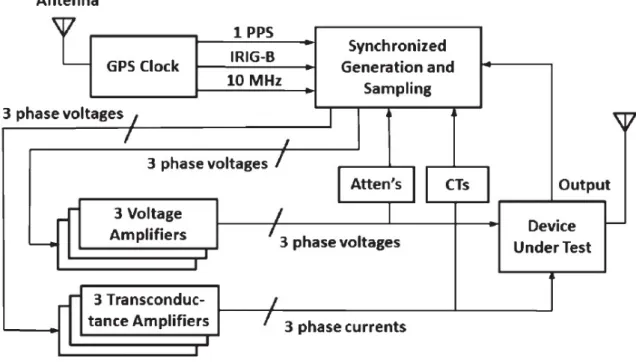
A basic setup to test and calibrate a PMU typically consists of a synchronized signal generator, a PMU under test and a controller comparing the output data stream to the generated waveforms. It may be expanded with additional equipment such as external GPS receivers or PDCs to enhance the scope of the calibration. A commonly used test setup, as introduced in [24], [30], and [31], is shown in Figure 6. The setup shows a GPS clock receiver providing timing signals, i.e. 1PPS, IRIG-B, 10MHz clock signal, to a generation and sampling unit (GSU). The GSU serves two purposes 1) synchronized generation of type test waveforms, 2) sampling of analog signals and synchrophasor stream.
1. Synchronized generation refers to the generation of analog signals under consideration of an absolute time reference. This is a key factor for making
30
synchrophasor experiments (type-tests) reproducible and compare the output of the Device Under Test (DUT), which is typically a PMU, to an expected reference value. 2. The sampling of input signals to the DUT is a suggested measure for compensating
potential amplifier deviation. By measuring the generated output signal and comparing it to the expected output value using calibrated attenuators and
transformers, the GSU can automatically correct magnitude and phase deviations.
Figure 6: Block diagram of a NIST PMU test system. IRIG-B stands for the Inter-Range Instrumentation Group time code B. CT refers to current transformer. Reprinted from [24].
The work presented in [24], [30], and [31] suggests the use of National Instruments PXI and/or compact RIO modules to act as the waveform generator and control unit to evaluate
31
synchrophasor systems, based on their high reliability and accuracy. According to these papers, a PMU calibration setup established at the National Institute of Standards and Technology (NIST) has an estimated uncertainty of 0.01% TVE. This value is roughly two orders of magnitude better than the threshold used in the PMU standard and can therefore considered sufficient to calibrate PMUs and synchrophasor systems. Most commercial GPS clock receivers provide an accurate enough signal to the controller via IRIG-B or other protocols to exceed the timestamp accuracy of the PMU output stream. Some setups as mentioned in [30] may use GPS receivers that are directly integrated into the controller and/or signal generator. In any case, it is important to consider and compensate for any time delays that may arise due to the nature of the setup. This is especially important when amplifiers are in the test loop to achieve nominal values for the PMU’s inputs. The test setup developed and used for the work presented in this thesis is
described in chapter 5.6.
5.3.2. Type Testing Methodology
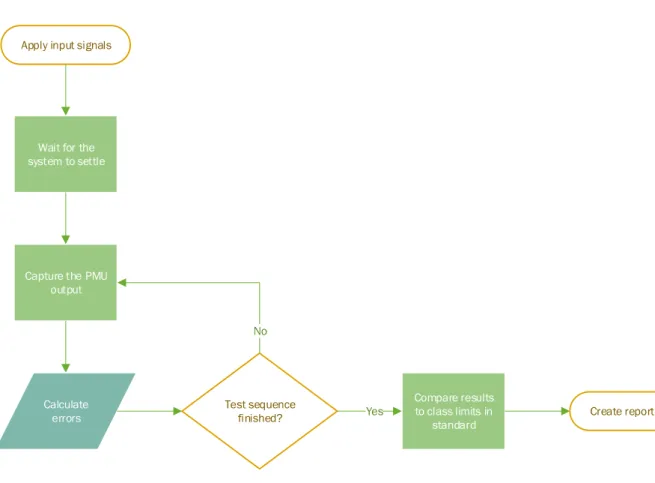
The test plan for each individual type test defined in the standard [7] is clarified in the IEEE Test Suite Specification [33]. The test sequence is illustrated in Figure 7 and always includes the following steps:
1) Applying analog signals to PMU under test, 2) Waiting for system to initialize
3) Capturing PMU output stream for fixed timeframe (typically 5 seconds) 4) Calculating errors relative to respective type test reference
5) Comparing error calculations to class limits in standard 6) Creating report based on test results
32
Apply input signals
Wait for the system to settle
Capture the PMU output Test sequence finished? Yes No Compare results to class limits in standard Create report Calculate errors
Figure 7: Individual Test Sequence Flow Chart
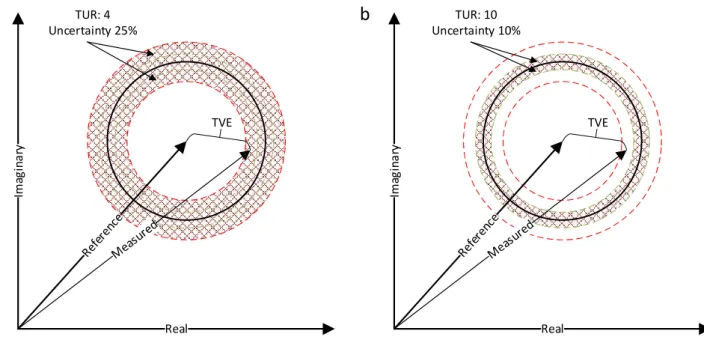
The methodology also entails the definition of evaluation thresholds for setup accuracy and uncertainty. The standard [7] requires a Test Uncertainty Ratio (TUR) for PMU calibration systems of 4 or higher compared to the test requirements. Factoring in the uncertainty of such setups, this limits the area of guaranteed pass or fail decisions to 75% of the actual requirement. For that reason, the TSS [33] requires a TUR of 10. The effect of uncertainty on testing
evaluation is illustrated in Figure 8. Figure 8.a) shows the uncertainty of a phasor with TUR 4. It can be seen that the area of guaranteed evaluation for pass/fail decision is decreased by 25%. Even though a measured phasor would be within the specified limits, indicated by the black circle, the measurement uncertainty does not allow confident judgment. With TUR 10, shown in
33
Figure 8.b), the judgement uncertainty is decreased to 10%, which allows more accurate assessment of a synchrophasor system. The issue is especially apparent towards the end of a PMUs frequency spectrum, where the TVE could be expected to fall within 75%-100% of the limit. In such cases, the setup would not be able to differentiate between a pass and a fail and would need to flag the measurement as indeterminate.
Im ag in ar y TVE Im ag in ar y TVE TUR: 4
Uncertainty 25% Uncertainty 10%TUR: 10
a
b
Figure 8: Effect of uncertainty on testing evaluation with a) TUR 4, b) TUR 10. Adapted with permission from [7].
5.4. Application Testing
This testing procedure is based on replaying waveforms of either recorded or simulated events, where the outcome of the application is known or can be predicted. Applications tests, as opposed to type tests, are mainly used for impact analysis of end-user applications, such as fault
34
location [13], small signal stability [14], voltage stability [15], or model validation [16] to name a few. The test setup is similar to type testing, except that the waveform generator needs a waveform replaying capability that is not commercially available for synchrophasor system evaluation equipment. This feature is implemented in the FTS, which is explained in chapter 5.5.3.
5.4.1. Application Test Methodology
Pre-defined analog waveforms corresponding to a known recorded or simulated event in a power system are replayed to a PMU under test. The output synchrophasor stream is then computed by an end-user application, which then provides the applications output to the user. Using pre-defined waveforms in a calibrated system, the output of the application is expected to have a known response. This can be verified by performing this test in a laboratory environment. In case of any form of perturbation, malfunction, or intrusion in the system, the application will likely deviate from its expected response. The underlying test signals for the application tests are stored as analog waveform samples that are capable of capturing many unfolding time domain details of measured or simulated power system conditions. That can profoundly affect the phasor calculation, including DC offset subharmonic, harmonics and high frequency transients. This unlocks a whole new potential of dynamic testing capable of revealing insufficient ability of PMUs to capture complex waveform changes as phasors on much more realistic signal interaction time-scale than conventional type tests. The waveform replaying for evaluation of synchrophasor systems using a portable test set is explained in chapter 5.5.3.
The goal of application testing is to evaluate the impact of deviation in system behavior from a reference state on the end-user application. One benefit of including application tests into system testing is to acquire knowledge about the impact of a specific system event on an
end-35
user application performance. Another advantage is to get a more in-depth understanding of the dynamic behavior of a synchrophasor system, which allows tuning the system parameters towards an improved application. To illustrate the concept of application testing, this thesis uses a fault location application as an example, as demonstrated in chapter 6.1.
5.4.2. Fault Location Application
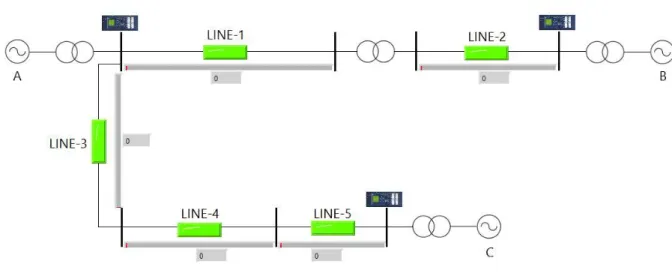
The fault location application used in this thesis [13], [47] is evaluating phasor data provided by three station PMUs corresponding to faults in a 5-bus system, as shown in Figure 9. The model for the 5-bus system is calculated from real system parameters of a larger system provided by a utility company.
Figure 9: 5-bus Fault Location Test System
The fault location algorithm is trained with phasor data from real time simulations in PSSE based on the 5-bus system model. The same simulated phasor data is used to calculate the analog
36
waveforms corresponding to the respective fault scenarios. The analog data is calculated based on the assumption that the nominal frequency 𝑓 stays constant throughout the duration of the fault as follows: 𝑣(𝑡) = √2 ∗ 𝑉(𝑡 ) ∗ cos 2𝜋𝑓 𝑡 + 𝜑 (𝑡 ) 𝑖(𝑡) = √2 ∗ 𝐼(𝑡 ) ∗ cos 2𝜋𝑓 𝑡 + 𝜑 (𝑡 ) where 𝑡 ∈ 𝑐𝑜𝑛𝑠𝑡. ∀: 𝑡 + 𝑛 ∗ ∆𝑡 ≤ 𝑡 < 𝑡 + (𝑛 + 1) ∗ ∆𝑡 𝑉(𝑡 ) = 𝑉(𝑡 ) < 𝜑 (𝑡 ) 𝐼̅(𝑡 ) = 𝐼(𝑡 ) < 𝜑 (𝑡 ) ∆𝑡 = 1 𝑓
An example for this correlation is shown in Figure 10. For a fault in the system shown in Figure 9 on line 2 at 66% of the line from the left, the simulated magnitude and phase are shown in the first and second plot in Figure 10, respectively. The plots show a 3s long simulation, with a fault occurring at 1s and being cleared 2 cycles later. The third plot in Figure 10 shows the corresponding analog data calculated with the formulas above. This data is stored and used for replaying to a synchrophasor system under test, as explained in chapter 5.5.3.2 and evaluated in chapter 6.1.
37
Figure 10: Fault Location - Phasor to Signal Correlation for Line 2 Fault at 66%
5.4.2.1. Application Test - Impact Evaluation
In order to comprehensively reflect the impact of any system event on the application, the evaluation needs to consider two aspects:
Synchrophasor stream comparison: Comparing the synchrophasor stream of the PMU and/or PDC output to the expected phasor values based on time stamp alignment shows how the setup affects the phasor stream and its values.
Application output comparison: Comparing the actual output of the application to the expected result shows how the setup affects the application itself, which typically does not directly correlate to the impacts determined in the phasor comparison.
38
Multiple ways of evaluation are important to establish a full assessment not only how the setup affects the quality of the synchrophasor and application output, but also how well an application responds to deviations from the expected input. While phasor stream or value deviation might be small, the impact on the application result may already be severe due to very sensitive application algorithms, as shown in Figure 11. On the shown correlation between application accuracy and input deviation, it can be observed that time-stamp misalignment causes very strong non-linear deviation of the FL detection accuracy. This confirms the need for application tests to fully capture the impact of system behavior on an end-user application, as small deviations in phasor data may cause severe degradation in application accuracy.
39
Figure 11: Impact Evaluation on Fault Location Application. Reprinted with permission from [19].
5.5. Field Test Set - FTS
The FTS is a portable test set specifically designed for performing type and application tests in synchrophasor systems in the field. The test set uses low power signal testing to eliminate the need for the use of heavy amplifiers in the field by bypassing the PMUs auxiliary transformers and thereby eliminating the impact of amplifier and transformer behavior.
40
5.5.1. FTS – Functional Description
The FTS is based on a National Instruments real time controller, which has proven to be a very high-precision platform and has been recognized as a commonly used tool for similar applications, as demonstrated in [24], [28], [30], [31], and [44]. It is embedded in an enclosure that fits into 5U rack space and can therefore easily be installed in any substation or field environment, as shown in Figure 12. The main capabilities include:
Processing of time synchronization protocols: IRIG-B, GPS Synchronized generation of analog reference waveforms
o Playback of type test waveforms specified in synchrophasor standard [7]
o Playback of stored application test waveforms
o Distribution of small signal waveforms via ribbon cables Evaluation of PMU performance
o Comparison of synchrophasor stream to known reference
o Computation of error metrics
o Report generation based on PMU performance
Support end-to-end calibration of synchrophasor systems: Details provided in chapter 5.6
In-service testing of timing receivers, PMUs, PDCs, end-user applications, and synchrophasor systems end-to-end
Provides a synchronized reference phasor stream corresponding to generated analog waveforms
41 Figure 12: Field Test Set Hardware
The capability to provide reference type-test signals was confirmed using a calibration laboratory at TEES, which was established in 2018 in an effort to obtain the IEEE ICAP certification. In collaboration with NIST, whose staff had developed a calibration device for PMU calibrators using an NI platform, the laboratory setup was thoroughly tested and calibrated. Proper generation of all type test variations was confirmed. This calibration laboratory was used to establish the type testing conformity of the FTS and confirm its status as a reference device.
5.5.2. Use of FTS in Field-Testing
The setup to use the FTS for field-testing is shown in Figure 13. The FTS is connected to the GPS antenna and the timing receiver providing an IRIG-B signal, which enables both evaluation of the timing receiver and generation of synchronized analog waveforms as well as generation of a synchrophasor reference stream (both chapter 5.6.1.1). The FTS provides small signal analog waveforms to the PMU via ribbon cables, bypassing the auxiliary transformers. The
42
synchrophasor stream from the PMU is distributed to the FTS and the PDC that connects to the communication network. From there both the end-user application and the FTS have access to the synchrophasor stream, which closes the loop of testing, as explained in chapter 5.6. With the FTS being connected to all the synchrophasor data feedback loops, the system can be evaluated using the synchrophasor comparison logic, see chapter 5.5.3.
GPS Antenna
Timing Receiver
Field Test Set
G
PS
IRIG-B
3f-V
3f-I
C37.118.2
Communication
Network
C37.118.2
Fault LocationControl Center
33%PMU under
Test
PDC under
Test
Substation
Figure 13: Implementation of Field Test Set for Evaluation of Synchrophasor System. Adapted with permission from [19].
5.5.3. FTS – Signal Replaying The FTS is able to generate a multitude of reference signals:
Synchronized Analog Type Test Waveforms Synchronized Analog Application Test Waveforms
![Figure 1: Synchrophasor System Example Architecture. Adapted with permission from [19]](https://thumb-us.123doks.com/thumbv2/123dok_us/1459011.2695142/18.892.253.665.678.1005/figure-synchrophasor-example-architecture-adapted-permission.webp)
![Figure 2: Synchrophasor Data Flow in the North American Power Grid. Reprinted from [11]](https://thumb-us.123doks.com/thumbv2/123dok_us/1459011.2695142/19.892.258.675.684.1013/figure-synchrophasor-data-flow-north-american-power-reprinted.webp)
![Table 1: Listing of defined type tests. Adapted from [7]](https://thumb-us.123doks.com/thumbv2/123dok_us/1459011.2695142/33.892.112.791.161.889/table-listing-defined-type-tests-adapted.webp)