POTENTIAL OF ENVIRONMENTALLY RESPONSIBLE
MEDIUM SIZED ENTERPRISES IN THE SERBIAN
INDUSTRIAL SECTOR
Sonja
Đ
URI
Č
IN, PhD
*Isidora BERAHA, PhD
•Abstract: The aim of the research is to determine the economic and financial power of medium-sized enterprises registered in the Republic of Serbia (RS) in the sector C: Manufacturing and an assessment of the development potential of environmentally responsible enterprises. The focus of the research is on environmentally responsible enterprises i.e. "green enterprises" for there is a need to search for ways to improve the economic sustainability of green business. The subject of the research refers to values of financial performance of enterprises in the period 2011-2015. Economic and financial power of enterprises was assessed by using the method of financial analysis. Financial analysis was carried out based on the information disclosed in the official financial statements of enterprises which are publicly available on the website of the Business Registers Agency. With the application of financial analysis, the yield, asset and financial position of enterprises was determined. In order to assess the yield position of enterprises, an analysis of the structure and arrangement of total revenues, structure and arrangement of gross financial result and profitability was performed. In order to assess the asset position of enterprises, an analysis of the structure and source of assets and of the efficiency of current asset management was performed, and for the purpose of assessing financial position of enterprises an analysis of liquidity, solvency and indebtedness was conducted. The analysis of the reasons medium-sized industrial enterprises are unprofitable is conducted for the purpose of determining their development potential. In order to examine the reasons of unprofitable operation, firstly enterprises which reported net loss in 2014 were identified. The possibility of determining the development potential is analyzed on the sample of five enterprises which reported above the average net loss in 2014, and which are characterized by conducting environmentally responsible business activities. The focus of the research is on "green enterprises" because there is a need to improve the economic sustainability of green business. The results of the research indicate that economic sustainability of
* Institute of Economic Sciences, Serbia, [email protected] • Institute of Economic Sciences, Serbia, [email protected]
environmentally responsible enterprises can be achieved by improving the real capacity utilization rate at current global price parity or by strengthening the global price parity at current real capacity utilization rate. Keywords: medium-sized enterprises, industry sector, economic and financial power, environmentally responsible business, potential, Serbian economy
1. INTRODUCTION
The development potential of environmentally responsible medium-sized enterprises registered in the RS in sector C: Manufacturing is assessed following the analysis of their economic and financial power in the period 2011-2015. The focus of the research is on medium-sized enterprises, which, in terms of key macroeconomic indicators, are the pillars of the economic growth of the national economy (Erić et al., 2012; Paraušić et al., 2017).
According to the current data of the National Bank of Serbia (NBS), medium-sized enterprises that make up only 2% of the total number of companies in the Republic of Serbia generate 16% of the total net profit realized, i.e. 14% of total net loss of all companies in the country, 17% of income, 16% of expenditures and even 16% of total employment. Medium-sized enterprises, which account for only 0.7% of the total number of SMEs, generate 33% of GVA, 30% of turnover, 40% of imports, 48% of exports and 29% of employment.
According to the data of the Serbian Business Registers Agency (SBRA) for 2015, 1004 medium-sized enterprises operated in the territory of the RS. They account for 37% in the structure of the total number of medium-sized enterprises registered in sector C: Manufacturing.
The results of the research of the Institute of Economic Sciences within the project “National Network of Medium-Sized Enterprises” point to the fact that the largest number of medium-sized enterprises in the manufacturing industry operate in low technology and medium-low technology areas. There are 24.2% of enterprises engaged in the production of food products, while 13% are engaged in the production of all metal products, except machines and devices. On the other hand, 23.9% of medium-sized enterprises operate in medium-high and high technology areas. These data indicate a relatively unfavourable technological structure. Almost half of medium-sized enterprises operate in low-tech areas and produce effects of lower added value, which makes it difficult for market positioning. Nevertheless, medium-sized enterprises registered within the sector C: Manufacturing, generate about 40% of the total employment in middle-sized enterprises in the RS.
Regional analysis indicates roughly the same geographical distribution of medium-sized industrial enterprises. Out of the total number of medium-medium-sized industrial enterprises, 33% are registered in the territory of Vojvodina, 28% in the territory of Šumadija and Western Serbia, 25% in the territory of Belgrade and 14% in the territory of South and East Serbia.
Out of the total number of medium-sized enterprises registered in the sector C: Manufacturing, 74% operated with a net gain in 2015. Enterprises that operate with net gains employ 76% of the total number of employees in medium-sized enterprises in sector C: Manufacturing.
The selection of the subject of the research was influenced by the fact that 74% of companies surveyed, which employ 76% of the total number of employees in sector C: Manufacturing and 30% of the total number of employees in companies of this size, operate with net gains in 2015. The subject of the research refers to the values of financial performance of all medium-sized enterprises registered within the sector C: Manufacturing in the period 2011-2015. Time period of the research provides the possibility to compare data over time and observe the movement of the basic development indicators. The aim of the research is to determine the economic and financial power of medium-sized enterprises registered in the Republic of Serbia in sector C: Manufacturing, and to assess the development potential of environmentally responsible enterprises. The research begins with the hypothesis according to which medium-sized enterprises registered within the sector C: Manufacturing can improve the economic sustainability of their environmentally responsible business operation by performing an adequate financial performance management.
2. MATERIAL AND METHOD
The aim of the research was realized using the standard method of data collection and analysis, methods of quantitative and qualitative financial analysis, methods of description and methods of synthesis. The methodology is performed on the basis of many years of research practice of the authors (Đuričin, S. and Beraha, I., 2017,
p. 147; Đuričin, S and Đukić, M., 2017, p. 95; Đuričin, S., and Beraha, I. 2016, p.
343; Đuričin, S., and Beraha, I., 2016, p. 712; Đuričin, S., and Jovanović, O., 2016,
p. 54; Đuričin, S. and Beraha, I., 2014, p. 693; Lazarević-Moravčević, M.,
Stevanović, S., and Belopavlović, G., 2014, Đuričin, S. and Beraha, I., 2013, p.
124; Đuričin, S. and Bodroža D., 2013, p. 26; Đuričin, S., Beraha, I., and Đulić,
Using the standard data collection and analysis methods, information was generated from the financial statements of medium-sized industrial enterprises publicly available on the website of the Business Registers Agency (BRA). The data disclosed in the individual official financial statements enabled the creation of the consolidated balance sheet and income statement of medium-sized enterprises registered in Sector C: Manufacturing. The subject of the analysis is the financial performance obtained from the consolidated financial statements of medium-sized industrial enterprises.
The analysis of the economic and financial power of enterprises covers the period 2011-2015. The assessment of the economic and financial power of medium-sized industrial enterprises was carried out using the methods of financial analysis. Qualitative methods of financial analysis were used for breakdown, while quantitative methods were used to measure the subject of the analysis for which temporal and spatial comparison were performed. By comparing the subject of the analysis over time, it is possible to compare the obtained results in several successive business years, which determines the moment of creation and the movement tendencies of basic development indicators. Spatial comparison of the subject of the analysis enabled the comparison with the average values of the analysis results. The results obtained by temporal and spatial analysis of financial performances provide the possibility of identifying bottlenecks in the operation, assessing the economic potential of medium-sized industrial enterprises, and imposing different alternative solutions for strengthening their development potential.
Ratio analysis was used for the purposes of financial analysis. For the purposes of research, the ratio analysis was first broken down to balance sheet ratio analysis and income statement ratio analysis. Balance sheet ratio analysis is divided into the ratio analysis of financial and asset position of medium-sized industrial enterprises. Assessing the financial position requires a calculation of the liquidity, solvency and indebtedness ratios, while assessing the asset position requires the evaluation of the structure of assets and liabilities, the economy and position of the company in the sale and purchase market. Ratio analysis of income statement refers to the analysis of the yield position of medium-sized industrial enterprises. For the purpose of assessing the yield position of the company, a calculation of the structure of the gross financial result, Operating Profit Margin (OPM), Return on assets (ROA), Return on Equity (ROE) and Return on Sales (ROS) was performed.
Following the assessment of economic and financial power and the identification of bottlenecks in operation, alternatives have been proposed for improving profitability and strengthening the development potential of environmentally responsible medium-sized industrial enterprises. Alternatives for improving the
profitability and development potential of environmentally responsible medium-sized enterprises are also the result of a financial analysis of the global sales and purchasing parity prices, the degree of utilization of actual capacity and the efficiency of management of working assets.
By applying the synthesis, the results obtained by the analysis are correlated into an interactive relationship. After the description of the established relationships between the obtained research results, conclusions are made on the economic potential of environmentally responsible medium-sized industrial enterprises in the Republic of Serbia.
3. RESULTS AND DISCUSSION
In the period 2011-2015, liquidity of medium-sized enterprises registered within sector C: Manufacturing is assessed as conditionally acceptable. Liquidity is acceptable due to the fact that in all business years, except 2014, enterprises had sufficient working capital required to cover short-term liabilities, and conditionally acceptable due to the fact that in the observed period they did not have a sufficient amount of liquid assets necessary to cover due short-term liabilities. From the aspect of second and third degree liquidity ratios, the payment capacity of medium-sized industrial enterprises decreased in the period 2011-2014, and then increased.
Table 1: Analysis of Liquidity
Indicator 2011 2012 2013 2014 2015
Second degree liquidity 0.77 0.76 0.66 0.62 0.64
Third degree liquidity 1.23 1.22 1.06 0.99 1.03
Source: Authors’ calculation according to SBRA data
Medium-sized industrial enterprises were solvent in the observed period. Enterprises had a sufficient amount of operating assets needed to cover total debts. In the period 2011-2014, the ratio of the operating assets and total debt had a declining, and then a growing trend.
Table 2: Analysis of Solvency
Indicator 2011 2012 2013 2014 2015
Solvency ratio 1.62 1.58 1.55 1.52 1.55
Source: Authors’ calculation according to SBRA data
In the period 2011 – 2015, borrowed capital prevails in total sources of financing. The share of borrowed capital in total sources of financing increased in the period
2011-2014. After 2014, the share of borrowed capital in total sources of financing decreased to 59.81%.
Table 3: Analysis of Indebtedness
- in % - Indicator 2011 2012 2013 2014 2015 Share of liabilities in total sources
of financing
59.42 60.62 61.17 61.58 59.81 Source: Authors’ calculation according to SBRA data
The company’s assets structure comprises approximately the same portions of fixed assets and current assets. After 2012, the share of current assets is reduced to the benefit of fixed assets.
Chart 1: Analysis of Assets Structure
Source: Authors’ calculation according to SBRA data
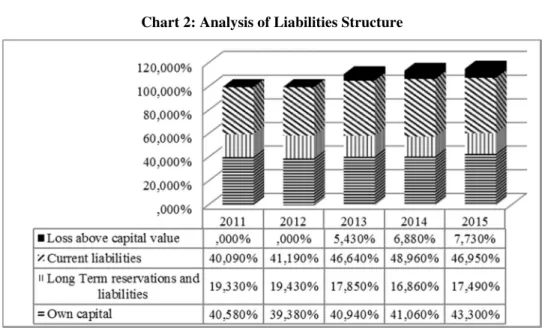
The structure of liabilities from the aspect of ownership changed in favour of borrowed capital. Within the borrowed sources of financing, the dominant share is recorded for short-term liabilities. In the period 2011-2015, short-term liabilities accounted for 44.47% and capital 41.05% on average in the total liabilities. Loss above capital value was characteristic for the period 2013-2015 and recorded an increase.
Chart 2: Analysis of Liabilities Structure
Source: Authors’ calculation according to SBRA data
In the period 2011-2015, the operation of medium-sized industrial enterprises within the overall and operating activities is estimated to be economical. Within the financial activities of the companies, they operated uneconomically throughout the observed period.
Table 4: Analysis of Economy
Indicator 2011 2012 2013 2014 2015 Economy of overall operation 1.03 1.02 1.01 1.00 1.02 Economy of operating activities 1.06 1.07 1.04 1.05 1.05
Economy of financing 0.56 0.45 0.51 0.31 0.51
Source: Authors’ calculation according to SBRA data
Under certain conditions, medium-sized industrial enterprises have a better position in the sales than on the purchasing market. Better position in the sales market was achieved due to the fact that in the period 2011-2015, they collected their receivables on average every 127 days, while they paid their obligations every 185 days. Conditionally better position was achieved because the deadlines for collection of receivables and settlement of liabilities were prolonged and lasted for more than three months. Compared to 2011, the number of days required for collecting receivables reduced from 133 to 121, while the number of days required to settle liabilities increased from 172 to 188 days in 2015.
Table 5: Analysis of company’s position in the sale and purchase market Indicator 2011 2012 2013 2014 2015 Accounts receivable turnover coefficient 2.75 2.84 2.81 2.97 3.02 Duration of one accounts receivable turnover 133 129 130 123 121 Accounts payable turnover coefficient 2.12 2.16 1.86 1.84 1.94 Duration of one accounts payable turnover 172 169 196 198 188 Source: Authors’ calculation according to SBRA data
In the period 2011-2015, the operation of medium-sized industrial enterprises was assessed as successful. In all observed years except in 2014, companies conducted absolutely successful operation. Absolute operating success is the result of a positive result from the regular operation and the total gross financial result. In 2014, the negative gross financial result, with a gain from regular operations, resulted in conditionally successful operations. Enterprises recorded an increase in terms of operating success. In 2015, compared to 2014, the result from regular operation increased from RSD 11,384 thousand to RSD 17,237 thousand, while the total gross financial result increased from RSD 10,792 thousand to RSD 11,963 thousand.
Table 6: Analysis of the total gross financial result structure
- in thousands RSD - Indicator 2011 2012 2013 2014 2015 Operating result – net effect 20,030 26,843 18,752 23,281 25,399 Result from financing -8,647 -17,159 -9,763 -18,603 -8,162 Result from regular operation - net effect 11,384 9,684 8,989 4,679 17,237 Result from income from valuation adjustments
of other assets - net effect 0 0 -6,290 -6,421 -7,290 Result from other income - net effect -592 1,394 669 -529 2,016 Gross financial result - net effect 10,792 11,078 3,369 -2,272 11,963 Source: Authors’ calculation according to SBRA data
In all observed years except in 2014, medium-sized industrial enterprises operated profitably. The negative gross and, consequently, the net financial result in 2014 caused the negative value of ROA, ROE and ROS.
The higher cumulative operating profit in relation to cumulative operating loss resulted in a positive net effect, i.e. a positive rate of operating profit. In the observed period, each dinar of operating income of medium-sized industrial enterprises averaged 5.15% of operating profit.
Table 7: Profitability Analysis
- in % - Indicator 2011 2012 2013 2014 2015 Operating Profit Margin – net effect 5.37 6.22 4.25 4.89 5.00 Return on assets – net effect 2.26 1.85 0.28 -0.89 1.61 Return on Equity – net effect 5.56 4.71 0.68 -2.18 3.71 Return on Sales – net effect 2.65 2.08 0.32 -0.99 1.77 Source: Authors’ calculation according to SBRA data
In the period 2011-2015, medium-sized industrial enterprises earned 1.02% of net profit on average for each dinar invested in total assets, while they earned 2.5% of the net profit on average for each dinar of invested own capital. In the period 2011-2015, medium-sized industrial enterprises accumulated on average 1.17% of operating income in the form of net profit.
For the purposes of determining the development potential of medium-sized industrial enterprises, an analysis of the causes of unprofitable operation was performed. Non-profitable operation at the level of all medium-sized industrial enterprises in the Republic of Serbia was identified only in 2014. In order to examine the cause of unprofitable operation, the companies that operated with net loss in 2014 were first identified. In 2014, 29% of the total number of medium-sized enterprises registered in sector C: Manufacturing operated with net loss. The possibility of determining the development potential was analysed on a sample of five enterprises that operated with an above-average net loss in 2014. These are also the enterprises with the identified non-profitable operation within the regular operating activity. Besides the value of net loss, the main criterion for selecting enterprises in which the developing potential is examined refers to environmentally responsible business operation. Environmentally responsible business means that selected enterprises use renewable energy sources (environmentally sustainable) in their operation and pay attention to the impact of their activities on social aspects (socially responsible). The purpose of focusing this research on "green enterprises" is embodied in the need to improve the economic sustainability of green business. The results of the analysis on operation of the least profitable environmentally responsible medium-sized industrial enterprises in 2014 show that the loss occurs as a result of a reduction in operating revenues, a reduction in the contribution margin and an increase in financial expenses. The decrease in operating income is a consequence of the deterioration of the global sales and purchasing parity prices, while the contribution margin declined due to insufficient use of actual capacity. On the other hand, financial expenditures increased due to inefficient use of working capital.
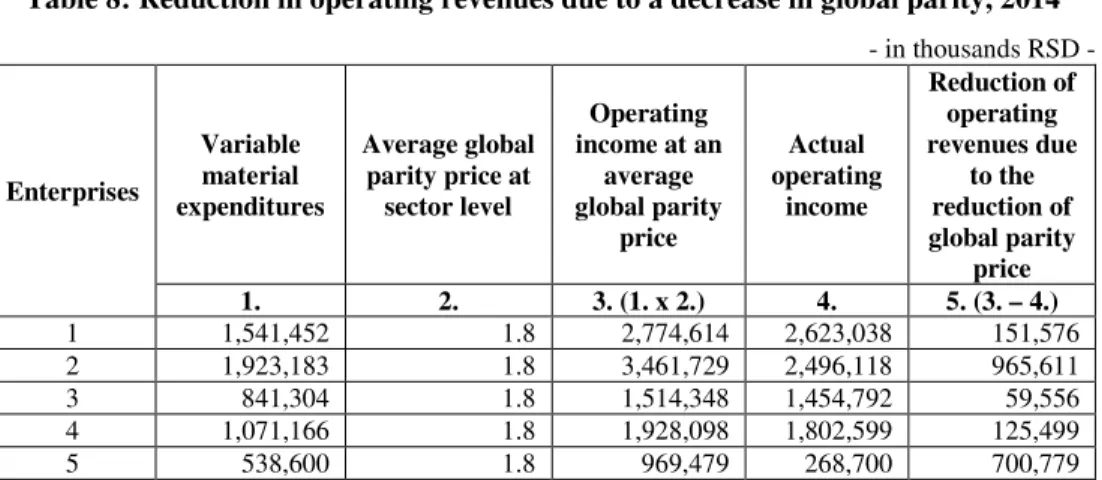
Table 8: Reduction in operating revenues due to a decrease in global parity, 2014 - in thousands RSD - Enterprises Variable material expenditures Average global parity price at sector level Operating income at an average global parity price Actual operating income Reduction of operating revenues due to the reduction of global parity price 1. 2. 3. (1. x 2.) 4. 5. (3. – 4.) 1 1,541,452 1.8 2,774,614 2,623,038 151,576 2 1,923,183 1.8 3,461,729 2,496,118 965,611 3 841,304 1.8 1,514,348 1,454,792 59,556 4 1,071,166 1.8 1,928,098 1,802,599 125,499 5 538,600 1.8 969,479 268,700 700,779
Source: Authors’ calculation according to SBRA data
With all environmentally responsible medium-sized industrial enterprises, which recorded the least profitable operation in 2014, a decrease in operating revenues was identified due to deterioration of the global sales and purchase parity prices. Enterprises recorded a lower global parity price compared to its average value at the level of the sector that in 2014 amounted to 1.8.
The deterioration of the parity price caused operating revenues lower than those that would have been achieved if the parity value remained at the sector’s average. The largest decrease in operating revenues due to the deterioration in the global parity prices, in the amount of RSD 965,611 thousand, was registered with the enterprise number 2, and the lowest with the enterprise number 3, in the amount of RSD 59,556 thousand.
Table 9: Reduction in contribution margin due to the insufficient use of actual capacity, 2014 - in thousands RSD - Enterprise Contribution margin Degree of utilization of actual capacity (%) Contribution margin at 100% utilization of actual capacity Reduction in contribution margin due to insufficient use
of actual capacity 1. 2. 3. (1./2.) x 100 4. (3. – 1.) 1 1,081,586 75 1,442,114 360,529 2 572,935 60 954,892 381,957 3 613,488 65 943,827 330,339 4 731,433 70 1,044,905 313,471 5 -269,900 100 -269,900 0
Only in case of enterprise number 5 there is no reduction in contribution margin due to insufficient use of actual capacity. This is because enterprise no. 5 was unprofitable with 100% of the utilization of actual capacity. In all other medium-sized industrial enterprises, characterized by the least profitable operation in 2014, a reduction in contribution margin was identified due to insufficient use of actual capacity. In case of enterprises number 1 - 4, the degree of utilization of actual capacity ranged from 60 to 75%, which led to contribution margin lower than the one that would be recorded in case of using 100% of actual capacity.
The analysis of data over time revealed small differences in the intensity of the impact of insufficient use of actual capacity on the value of contribution margin. The greatest decrease in contribution margin due to insufficient use of actual capacity, in the amount of RSD 381,957 thousand, was registered with company number 2, and the lowest, in the amount of RSD 313,471 thousand, with company number 4.
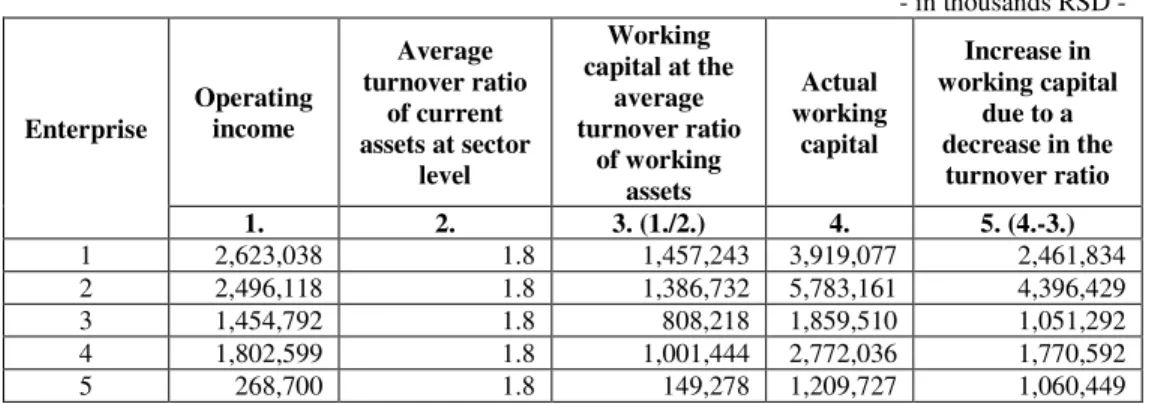
Table 10: Increase in working capital due to inefficient management, 2014 - in thousands RSD -
Enterprise Operating income
Average turnover ratio of current assets at sector level Working capital at the average turnover ratio of working assets Actual working capital Increase in working capital due to a decrease in the turnover ratio 1. 2. 3. (1./2.) 4. 5. (4.-3.) 1 2,623,038 1.8 1,457,243 3,919,077 2,461,834 2 2,496,118 1.8 1,386,732 5,783,161 4,396,429 3 1,454,792 1.8 808,218 1,859,510 1,051,292 4 1,802,599 1.8 1,001,444 2,772,036 1,770,592 5 268,700 1.8 149,278 1,209,727 1,060,449
Source: Authors’ calculation according to SBRA data
The financial analysis found that the loss in the observed companies in 2014 was caused by inefficient management of current assets. For determining the extent to which financial expenditures are growing due to inefficient management of current assets, the average turnover coefficient at the sector level in 2014 was first identified. By establishing the ratio between current assets at the average turnover coefficient and actual working capital, an increase in their value has been identified due to inefficient management (Table 10). By far the highest increase in working capital due to inefficient management, in the amount of RSD 4,396,429 thousand, was registered with the company number 2.
The quantification of the consequences of inefficient management of current assets determined the amount of possible reduction in financial expenses. Although enterprise no. 1 is characterized by more efficient management of current assets in comparison to company no. 2, this enterprise recorded the highest possible decrease in financial expenses of RSD 585,717 thousand.
Table 11: Increase in financial expenses due to inefficient use of working capital, 2014 - in thousands RSD - Enterprise Financial expenses Liabilities based on which interest is paid Average interest rate Possibility of reducing financial expenses 1. 2. 3. (1./2.) x 100 4. (5.* x 3.) / 100 1 725,435 3,049,084 23.79 585,717 2 1,178,258 10,507,847 11.21 492,977 3 526,505 2,916,061 18.06 189,815 4 494,761 3,217,976 15.37 272,227 5 317,329 2,699.125 11.76 124,674
Source: Authors’ calculation according to SBRA data Note: * Column no. 5 from Table 10
In order to systematize all the negative impacts on the financial result, the reduction in operating revenues due to the deterioration in global parity, the reduction in contribution margin due to insufficient use of actual capacity and the increase in financial expenses due to inefficient management of current assets were taken into account. The cause of the loss was adequately identified in all enterprises with a negative impact on the financial result of more than 100%. The results of the analysis show that the loss was not adequately identified only in case of enterprise no. 5. Therefore, enterprise no. 5 was excluded from further analysis.
Table 12: Examination of the negative impact on the financial result, 2014 - in thousands RSD - Enterprise Reduction of operating revenues due to deterioration in global parity price Reduction in contribution margin due to insufficient use of actual capacity Increase in financial expenses due to inefficient use of working capital Total negative impact on financial result Loss of the current year Negative impacts on the financial result in relation to loss (%) 1. 2. 3. 4. (1. + 2. + 3.) 5. 6. (4./5.) x 100 1 151,576 360,529 585,717 1,097,822 669,980 164 2 965,611 381,957 492,977 1,840,545 1,842,292 100
3 59,556 330,339 189,815 579,710 435,166 133 4 125,499 313,471 272,227 711,198 466,905 152
5 700,779 0 124,674 825,453 937,147 88
Source: Authors’ calculation according to SBRA data
Development potential of environmentally responsible medium-sized industrial enterprises is analysed through two alternatives. The first alternative involves an analysis of the possibility of increasing the volume of production and sales at the current global parity price. The second alternative implies an analysis of the possibility of shifting the global parity price in favour of sales prices at the current level of actual capacity utilization. For both alternatives, two aspects of development potential were analysed. The first aspect does not take into consideration the expenditure side correction, while the second aspect includes the correction of expenditure side for the established possible amount of reduction in financial expenses due to inefficient management of current assets. The analysis on the potential of environmentally responsible medium-sized industrial enterprises through these two alternatives, two aspects, requires the acceptance of the following assumptions:
• an increase in revenues, which could occur if there was no deterioration in
global parity prices, is not taken into account because the analysis aims to determine the global parity price needed for the development of medium-sized industrial enterprises, and
• contribution margin is not adjusted to higher values, by the amount of the
determined reduction due to insufficient use of actual capacity, because the analysis aims to determine the extent to which the use of actual capacity is necessary for the development of medium-sized industrial enterprises.
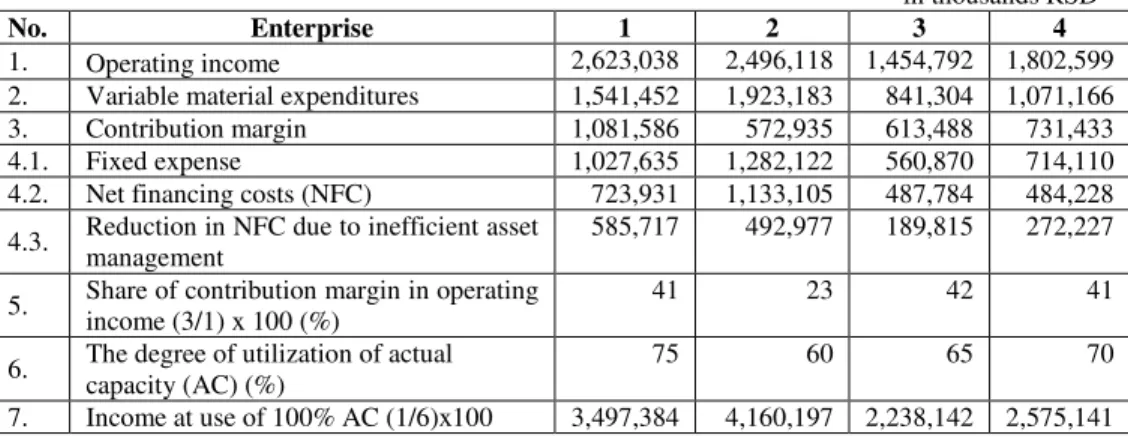
Table 13: Examination of the potential of environmentally responsible medium-sized industrial enterprises, 2014
- in thousands RSD -
No. Enterprise 1 2 3 4
1. Operating income 2,623,038 2,496,118 1,454,792 1,802,599 2. Variable material expenditures 1,541,452 1,923,183 841,304 1,071,166 3. Contribution margin 1,081,586 572,935 613,488 731,433 4.1. Fixed expense 1,027,635 1,282,122 560,870 714,110 4.2. Net financing costs (NFC) 723,931 1,133,105 487,784 484,228 4.3. Reduction in NFC due to inefficient asset management 585,717 492,977 189,815 272,227 5. Share of contribution margin in operating income (3/1) x 100 (%) 41 23 42 41 6. The degree of utilization of actual capacity (AC) (%) 75 60 65 70 7. Income at use of 100% AC (1/6)x100 3,497,384 4,160,197 2,238,142 2,575,141
No. Enterprise 1 2 3 4
8.
Production and sales volume for achieving neutral result (NR) *WC ((4.1.+4.2.)/5)x100
4,247,859 10,522,470 2,486,722 2,953,274
8a. Production and sales volume for achieving NR **WIC ((4.1.+(4.2.-4.3.))/5.)x100
2,827,391 8,374,707 2,036,606 2,282,378
9. % of AC use for achieving NR with the current global parity price (GPP) WC (8/7)x100
121 253 111 115
9a. % of AC use for achieving NR with the current GPP WIC (8a/7)x100 81 201 91 89 10.
% increase in the production and sales volume for achieving NR with the current GPP WC ((8-1)/1)x100
62 322 71 64
10a.
% increase in the production and sales volume for achieving NR with the current GPP WIC ((8a-1)/1)x100
8 236 40 27
11. % change of GP for achieving NR with the current AC WC (((4.1.+4.2.)-3.)/1.)x100
26 74 30 26
11a. % change of GP for achieving NR with the current AC WIC ((4.1.-(4.2.-4.3.)) -3.)/1.)x100
-7 3 -24 -13
Source: Authors’ calculation according to SBRA data Note: *WC- without correction; **WIC - with correction
The alternatives for improving the development potential of each environmentally responsible medium-sized industrial enterprise are as follows
• Enterprise 1 – it can achieve a neutral financial result with the current
global sales and purchasing parity prices by increasing the production and sales volume, which means using 121% of actual capacity if the expenditure side is not corrected, i.e. 81% if the expenditure side is corrected. In relation to the realized physical volume of production and sales, this alternative implies its 62% increase if the expenditure side is not corrected and 8% if the expenditure side is corrected. Neutral financial result for enterprise 1 can be achieved with the existing production and sales volume, provided that the global sales and purchase parity price, if the expenditure side is not corrected, is changed in favour of sales prices by 26%, i.e. if the expenditure side is corrected, changed in favour of purchasing prices by 7%.
• Enterprise 2 – it can achieve a neutral financial result with the current
global sales and purchasing parity prices by increasing the production and sales volume, which means using 253% of actual capacity if the expenditure side is not corrected, i.e. 201% if the expenditure side is
corrected. In relation to the realized physical volume of production and sales, this alternative implies its 322% increase if the expenditure side is not corrected and 236% if the expenditure side is corrected. Neutral financial result for enterprise 2 can be achieved with the existing production and sales volume, provided that the global sales and purchase parity price, if the expenditure side is not corrected, is changed in favour of purchasing prices by 74%, i.e. if the expenditure side is corrected, changed in favour of sales prices by 3%.
• Enterprise 3 – it can achieve a neutral financial result with the current
global sales and purchasing parity prices by increasing the production and sales volume, which means using 111% of actual capacity if the expenditure side is not corrected, i.e. 91% if the expenditure side is corrected. In relation to the realized physical volume of production and sales, this alternative implies its 71% increase if the expenditure side is not corrected and 40% if the expenditure side is corrected. Neutral financial result for enterprise 3 can be achieved with the existing production and sales volume, provided that the global sales and purchase parity price, if the expenditure side is not corrected, is changed in favour of sales prices by 30%, i.e. if the expenditure side is corrected, changed in favour of purchasing prices by 24%.
• Enterprise 4 – it can achieve a neutral financial result with the current
global sales and purchasing parity prices by increasing the production and sales volume, which means using 115% of actual capacity if the expenditure side is not corrected, i.e. 89% if the expenditure side is corrected. In relation to the realized physical volume of production and sales, this alternative implies its 64% increase if the expenditure side is not corrected and 27% if the expenditure side is corrected. Neutral financial result for enterprise 4 can be achieved with the existing production and sales volume, provided that the global sales and purchase parity price, if the expenditure side is not corrected, is changed in favour of sales prices by 26%, i.e. if the expenditure side is corrected, changed in favour of purchasing prices by 13%.
An alternative that involves the use of actual capacity higher than 100% implies the realization of operating activities through the introduction of multiple work shifts. In order to improve profitability and strengthen their development potential, enterprises will decide on the alternative that can be realized at the moment or will choose the combination of individual elements of both alternatives. When it comes to determining the level of global parity price in case of using 100% of actual capacity, the elements of both alternatives are to be combined.
Table 14: Change in global parity price at 100% use of actual capacity, 2014 - in thousands RSD - No . Enterprise 1 2 3 4 1. Operating income 2,623,038 2,496,118 1,454,792 1,802,599 2. Variable expense 1,541,452 1,923,183 841,304 1,071,166 3. Use of AC (%) 75 60 65 70 4. Operating income at 100% AC (1. / 3.) x 100 3,497,384 4,160,197 2,238,142 2,575,141 5. Variable expense at 100% AC (2./3.)x100 2,055,270 3,205,305 1,294,314 1,530,237 6. Contribution margin at 100% AC (4.-5.) 1,442,114 954,892 943,827 1,044,905 7. Fixed expense and net financing expenses without correction 1,751,566 2,415,227 1,048,654 1,198,338 7.
1. Fixed expense and net financing expenses with correction 1,165,849 1,922,250 858,839 926,111 8.
% change of GPP in favour of sales prices at 100%
use of AC WC ((7.-6.)/4.)x100 8.85 35.10 4.68 5.96 8.
1.
% change of GPP in favour of sales prices at 100%
use of AC WIC ((7.1.-6.)/4.)x100
-7.90 23.25 -3.80 -4.61 Source: Authors’ calculation according to SBRA data
In 2014, in order to leave the zone of loss, improve profitability and strengthen the development potential of environmentally responsible medium-sized industrial enterprises with the use of 100% actual capacity:
• Enterprise 1 – should increase the sales price by 8.85%, if the expenditure
side is not corrected, i.e. it can reduce the sales price by 7.90% if the expenditure side is corrected;
• Enterprise 2 – should increase the sales price by 35.10%, if the expenditure
side is not corrected, i.e. it should increase the sales price by 23.25% if the expenditure side is corrected;
• Enterprise 3 – should increase the sales price by 4.68%, if the expenditure
side is not corrected, i.e. it can reduce the sales price by 3.80% if the expenditure side is corrected;
• Enterprise 4 – should increase the sales price by 5.96%, if the expenditure
side is not corrected, i.e. it can reduce the sales price by 4.61% if the expenditure side is corrected.
4. CONCLUSION
The research realized the goal of determining the economic and financial power and assessing the development potential of environmentally responsible
medium-sized enterprises registered in the Republic of Serbia in sector C: Manufacturing. The results of the analysis show that medium-sized industrial enterprises in the period 2011-2015 were characterised by solvent operation and growth in payment capacity. In total capital, the share of borrowed sources of financing with a short-term maturity is dominant, while the operation activities of enterprises in all business years except in 2014 were estimated as profitable.
Uneconomic operation within the financial activity, conditionally acceptable position on the sale and purchase market and the occurrence of loss above capital necessitated the need to analyse the possibility of improving profitability and strengthening the development potential of medium-sized industrial enterprises. Analysis of the possibilities for improving profitability and strengthening of development potential was carried out using data disclosed in individual financial statements of the least profitable environmentally responsible enterprises in 2014. The results of the analysis show that the unprofitable operation of environmentally responsible medium-sized industrial enterprises in 2014 is a consequence of the decrease in operating income due to the deterioration of the global sales and purchase parity prices. Furthermore, unprofitable operation appears as a consequence of insufficient use of actual capacity, which led to a reduction in contribution margin and inefficient management of current assets that caused the growth in financial expenses.
In order to improve profitability and strengthen the development potential of environmentally responsible medium-sized industrial enterprises in the Republic of Serbia, two alternatives were proposed. The first alternative relates to the analysis of the possibility of increasing the use of actual capacity at the existing global parity price, while the second alternative implies an analysis of the possibility of changing the global parity price to the benefit of the sales prices at the current rate of the actual capacity use. In addition, a possible solution for improving profitability and strengthening development potential is a combination of the elements of both alternatives, i.e. it was established how much the global parity price should be in case of using 100% of actual capacity.
The research results confirm the hypothesis according to which medium-sized enterprises registered in the sector C: Manufacturing can improve the economic sustainability of their environmentally responsible business operation by performing an adequate financial performance management. Furthermore, the results obtained by analysing the economic and financial power and development potential of medium-sized industrial enterprises open up the possibility of further
research that could address the assessment of effects of increasing their participation in key macroeconomic indicators.
ACKNOWLEDGMENT
This paper is a part of research projects: European integrations and social and economic changes in Serbian economy on the way to the EU (No. 47009), Challenges and prospects of structural changes in Serbia: Strategic directions for economic development and harmonization with EU requirements (No. 179015) and Modern biotechnological approach to solving problem of drought in agriculture of Serbia (No. 31005) financed by the Ministry of Education, Science and Technological Development of the Republic of Serbia.
REFERENCES
1. Đuričin, S, and Beraha I. (2012), Promoting availability of financing to SMEs in Serbia on the road to EU integration, European integration process in Western Balkan countries (ISBN: 978-972-9344-05-3), Faculty of Economics of the University of Coimbra, pp, 493-511, Coimbra, Portugal,
2. Đuričin, S, and Beraha, I. (2013), Evaluation of Business Performances of Agricultural
Enterprises in the Mixed Farming Sub-sector and their Impact on Economic Growth of the Republic of Serbia, Agriculture in Serbia and Portugal: recent developments and economic policy implications, Faculty of Economics of the University of Coimbra, 2013, pp, 122-138, Coimbra, Portugal,
3. Đuričin, S, and Beraha, I. (2016) Financial effects of new technology implementation
in solving drought problems, Ecologica, Vol, 23, No, 84, pp, 712-716,
4. Đuričin, S, and Beraha, I. (2016) Uticaj zaduženosti na profitabilnost i održavanje realne vrednosti kapitala srednjih preduzeća, Pravci strukturnih promena u procesu pristupanja Evropskoj uniji, Institut ekonomskih nauka, Beograd, pp, 343-358
5. Đuričin, S, and Beraha, I. (2017) The impact of drought on the global parity price of
agricultural products in the Republic of Serbia, Ecologica, Book of Abstracts, Belgrade, 20 - 22, April 2017, Naučno-stručno društvo za zaštitu životne sredine Srbije Ecologica, p, 147,
6. Đuričin, S, and Bodroža D. (2013), The impact of drought on yield position of the group of enterprises from agriculture sector, Economics of agriculture, The Balkan Scientific Association of Agrarian Economists, Institute of Agricultural Economics, Belgrade and Academy of Economic Studies, 2013 (Vol, LX, No,1), pp, 25-39, Bucharest, Romania,
7. Đuričin, S, and Đukić, M. (2017) Ocena ekonomsko finansijske moći javnih preduzeća
u Republici Srbiji, Opportunities for inclusive and Resilient Growth, Institut ekonomskih nauka, Beograd, Republika Srbija, pp, 89-104
8. Đuričin, S, and Jovanović, O. (2016) Analysis of financial solvency of medium-sized
enterprises in the Republic of Serbia, Erenet Profile, Vol, X, No 4, pp, 49-58,
9. Đuričin, S, Beraha, I, and Đukić, M. (2013) The impact of climate extremes on agricultural output in the Republic of Serbia, Ecologica, Vol, 20, No, 72, pp, 587-592
10. Đuričin, S, i Beraha I. (2014) Unapređenje finansijskih performansi agroindustrijskog sektora po osnovu podsticajnih mera razvoja (ISBN; 978-86-89465-12-9), Deindustrijalizacija u Srbiji, Institut ekonomskih nauka, Beogradska bankarska akademija, Fakultet za bankarstvo, osiguranje i finansije, pp, 690-703, Beograd, 11. Đuričin, S. (2012), Analiza poslovanja i mogućnosti izlaska preduzeća iz zone gubitka
(ISBN: 978-86-80315-92-8), Institut ekonomskih nauka, Beograd.
12. Đuričin, S., Stevanović, S., and Ljumović, I. (2017) Nacionalna mreža srednjih preduzeća u Republici Srbiji, Institut ekonomskih nauka, Beograd
13. Đuričin, S., Stevanović, S., Ljumović, I., and Simović, V. (2017), Nacionalna mreža srednjih preduzeća u Republici Srbiji, Vol. 2., Institut ekonomskih nauka, Beograd 14. Đuričin, S., Stevanović, S., Ljumović, I., and Simović, V. (2017), Nacionalna mreža
srednjih preduzeća u Republici Srbiji, Vol. 1., Institut ekonomskih nauka, Beograd 15. Erić, D, Beraha, I, Đuričin, S, Kecman, N, and Jakišić, B. (2012) Finansiranje malih i
srednjih preduzeća u Srbiji, (ISBN: 978-86-80315-94-2), Privredna komora Srbije, Institut ekonomskih nauka, Beograd,
16. Financial Statements, available at:
http://pretraga2.apr.gov.rs/ObjedinjenePretrage/Search/Search (date: 05/06/2017.) 17. Lazarević-Moravčević, M, Stevanović, S, and Belopavlović, G, (2014) Specifics of
Management in Small and Medium-Size Enterprises in Serbia, Economic analysis, 47 (3-4), pp, 104-117
18. National Bank of Serbia, Basic macroeconomic indicators, available at: https://www.nbs.rs/internet/cirilica/80/index.html (date: 05/01/2018.)
19. Paraušić V, Domazet I, Simeunović I. (2017), Analysis of the Relationship Between the Stage of Economic Development and the State of Cluster Development, Argumenta Oeconomica, Vol. 39, No 2(2017), str. 279-305.