ANALYSIS OF FOUR ALTERNATIVE ENERGY MUTUAL FUNDS
A Thesis Presented to The Academic Faculty
by
Michael Selik
In Partial Fulfillment
of the Requirements for the Degree Master of Science in the
School of Economics
Georgia Institute of Technology December 2010
ANALYSIS OF FOUR ALTERNATIVE ENERGY MUTUAL FUNDS
Approved by:
Dr. Chun-Yu Ho, Advisor School of Economics
Georgia Institute of Technology Dr. Byung-Cheol Kim
School of Economics
Georgia Institute of Technology Dr. Derek Tittle
School of Economics
Georgia Institute of Technology
To my pet cat.
iv
ACKNOWLEDGEMENTS
I wish to thank everyone who told me, “Just get it done,” especially my advisor, Professor Ho. I wrote this thesis in first person plural to acknowledge the help I received.
v
TABLE OF CONTENTS
Page
ACKNOWLEDGEMENTS iv
LIST OF TABLES vii
LIST OF FIGURES viii
LIST OF SYMBOLS AND ABBREVIATIONS ix
SUMMARY x
CHAPTER
1 Introduction 1
Portfolio Selection 1
Capital Asset Pricing Model 2
2 Data 4
Alternative Energy 4
The Market 4
Oil 5
Foreign Exchange Rates 5
Risk-Free Asset 6 3 Methods 7 Excess Returns 7 Econometric Model 8 4 Results 9 Alternative Energy 9 Solar 9 Wind 10
vi
Nuclear 10
5 Conclusion 12
vii
LIST OF TABLES
Page
Table 1: Summary Statistics of Excess Returns 6
viii
LIST OF FIGURES
Page
ix
LIST OF SYMBOLS AND ABBREVIATIONS
CAPM Capital asset pricing model
FAN First Trust Global Wind Energy ETF
Future Contract 1 First-Month Future Contract
GARCH Generalized autoregressive conditional heteroskedasticity
NBDI PowerShares WilderHill Clean Energy Portfolio
NMCDI Nominal Major Currency Dollar Index
NUCL iShares S&P Global Nuclear Index ETF
PBW PowerShares WilderHill Clean Energy Portfolio
TAN MAC Solar Index
USO United States Oil Fund
x
SUMMARY
We analyze four alternative energy mutual funds using a multi-factor capital asset pricing model with generalized autoregressive conditionally heteroskedastic errors (CAPM-GARCH). Our findings will help portfolio managers and others who seek to predict the return on investment in alternative energy firms. We find that alternative energy firms tend to be riskier than the general US stock market, have a low, but
significant and positive response to oil prices, and have a significantly high and negative response to the value of the dollar relative to other currencies. Our results also suggest that alternative energy firms should hedge against currency exchange rate fluctuation.
1
1. INTRODUCTION
“The process of selecting a portfolio may be divided into two stages. The first stage starts with observation and experience and ends with beliefs about the future performances of available securities. The second stage starts with the relevant beliefs about future performances and ends with the choice of portfolio” (Markowitz, 1952).
This paper is concerned with the first stage of portfolio selection.
Recent growth in environmental consciousness has spurred the creation of alternative energy firms and investment vehicles. Alternative energy mutual funds are relatively new to the stock market and have not been studied extensively. This paper examines four mutual funds that invest exclusively in the alternative energy industry. We use a multi-factor capital asset pricing model with generalized heteroskedastic errors (CAPM-GARCH). In common with recent studies, we find that the excess returns of alternative energy stocks have low correlation with oil prices and that different sectors--solar, wind, and nuclear--have different levels of correlation with the broad market. Our contribution beyond examining new data is to add foreign exchange rates into the model. All four mutual funds in our sample have strong negative correlation with the Nominal Broad Dollar Index, indicating that alternative energy firms do not generally practice hedging against currency fluctuation.
Portfiolio Selection
The purpose of this paper is to inform the second stage of portfolio selection, as described by Markowitz. Investors do not simply pursue maximal expected returns, but also seek minimal risk--variance of returns. By choosing a group of assets each with a
2
particular expected return and risk, an investor creates a portfolio with the same expected return but lower risk than any of its component assets. The portfolio reduces risk to the degree that the returns on investment of its components are not correlated with each other. Portfolio selection based on diversification assumes the investor has knowledge of assets’ expected return and their correlation with each other. Our estimation of alternative energy funds’ correlation with the market and other factors provides some of that
essential information.
An efficient portfolio of assets is one constructed such that no other portfolio can have a greater expected return with equal or less risk. In other words, an efficient
portfolio cannot benefit from more diversification. The minimum expected return of an efficient portfolio is that of one completely invested in an asset without risk.
Capital Asset Pricing Model
Sharpe (1964) provides a method of predicting an asset's risk and return. At equilibrium, the set of all efficient portfolios forms a ray originating from this point of zero risk and minimum expected return. Sharpe calls this the capital market line. Every possible asset is a part of at least one efficient portfolio. Therefore the returns of every asset will be at least partly correlated with the returns of an efficient portfolio. This is the systematic risk, or Beta, and this variance cannot be eliminated through diversification. The returns of the stock market do not have constant variance. Instead, a large movement appears to be followed by a temporary increase in variance. To account for this we use CAPM-GARCH as described by Bollerslev (1988). Najand (2007) summarizes some of the evidence supporting CAPM-GARCH as better predictor of stock returns than the traditional CAPM.
3
Following Bollerslev (1988) we are only concerned with the excess returns of assets--the returns above or below that of a risk-free asset. This starts our capital market line at zero risk and zero excess return and eliminates the movement of the returns of a risk-free asset from the variance detected in the returns of other assets.
Bollerslev (1988) uses New York Stock Exchange value-weighted equity returns as a proxy for an efficient portfolio, but adds that "wider definitions of the market would allow the model to do better." Henriques (2008) models the returns of alternative energy firms with oil prices as a factor. Sadorsky (2001) models the returns of Canadian oil and gas companies with US-Canadian dollar exchange rates as a factor. We also use a multi-factor approach to our analysis, including a stock market index, spot oil prices, and an index of US foreign exchange rates as the systemic risk factors for alternative energy stocks.
4
2. DATA
We downloaded historical stock, mutual fund, and exchange traded fund prices from Yahoo! Finance, oil spot prices and futures contract prices from the US Energy Administration, and US Treasury bill rates from the US Federal Reserve. All data are daily closing price for one share or one barrel or percent return on U.S. Treasury bill.
Alternative Energy
To represent alternative energy stocks, Henriques (2008) used the exchange-traded PowerShares WilderHill Clean Energy Portfolio (PBW), which is based on the WilderHill Clean Energy Index. The index selects “companies that focus on greener and generally renewable sources of energy and technologies that facilitate cleaner energy” (Invesco PowerShares, 2010).
The PowerShares WilderHill Clean Energy Portfolio has the advantages of being exclusively alternative energy focused, containing only US exchange traded stocks, and having a longer history than many other funds. Other funds are newer, include non-US traded stocks, or include non-energy sector stocks. We expand on Schmidtz (2009) by examining not only the same MAC Solar Index (TAN), but also the iShares S&P Global Nuclear Index ETF (NUCL) and the First Trust Global Wind Energy ETF (FAN).
The Market
Henriques (2008) used the Arca Tech 100 Index (PSE) in their model. Contrary to their findings, our estimation using GARCH on daily returns from Jan 2005 to April 2010 determined that the PowerShares WilderHill Clean Energy Portfolio is more highly correlated with the S&P 500 than with the Arca Tech 100 Index. To represent the S&P
5
500, we use the Vanguard 500 Index Fund (VFINX), the oldest mutual fund to track the S&P 500 Index. Though the S&P 500 Index only covers approximately 75% of the stock market, results were not qualitatively different when using the S&P 1500 Index, which covers 90% of the market (Standard & Poor’s, 2010).
Oil
We compared the United States Oil Fund (USO) with spot prices and First Month Future Contracts (Future Contract 1) on barrels of West Texas Intermediate in Cushing, OK. Weekly returns on the United States Oil Fund have an approximately 0.25
correlation coefficient with weekly returns on spot price, despite the fund’s prospectus. There is no statistically significant correlation between their daily returns. Future
Contract 1 and spot price have a correlation coefficient of approximately 1 for both daily and weekly returns. Because spot price appears to have a handful of large outliers, we use Future Contract 1 to represent the price of oil in our model.
Foreign Exchange Rates
Because many firms traded on the New York Stock Exchange may cater to the global market, rather than solely to the US market, one expects their growth to be correlated with the movements of foreign exchange rates. If the dollar is stronger, the firms will have a harder time exporting and their share prices should decrease. All countries demand energy, not only major trade partners. Therefore, we use the Nominal Broad Dollar Index (NBDI) to check for a negative relationship between the dollar’s exchange rates and alternative energy stocks. The Nominal Broad Dollar Index was more significantly correlated with our alternative energy funds than was the Nominal Major Currency Dollar Index (NMCDI), which is a subset of the Nominal Broad Dollar Index.
6
Risk-Free Asset
To represent the risk-free asset, we follow Najand (2007) in the use of 3-month US Treasury bills, gathering data from the Federal Reserve Bank of Saint Louis.
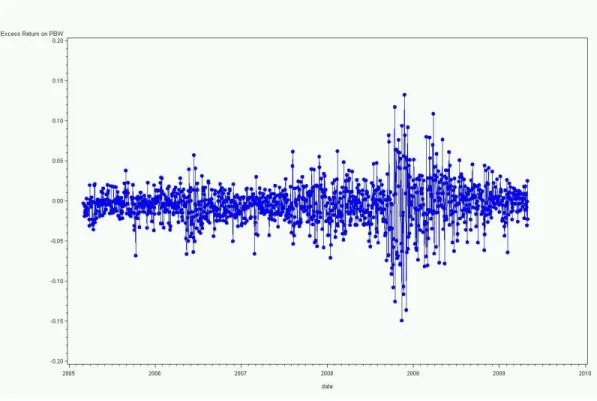
Table 1. Summary Statistics of Excess Returns
Statistic PBW TAN FAN NUCL VFINX OIL NBDI
Mean -0.0044 -0.0042 -0.0038 -0.0041 -0.0043 -0.0036 -0.0044 Min. -0.1491 -0.2328 -0.1714 -0.1827 -0.0933 -0.1228 -0.0298 Max. 0.1327 0.2175 0.1932 0.1781 0.1066 0.1782 0.0143 Var. 0.0007 0.0036 0.0018 0.0026 0.0002 0.0008 0.0000 Skew. -0.1772 -0.0283 0.0911 0.0395 0.2688 0.5134 -0.3973 Kurt. 4.3584 1.8788 3.3848 2.6131 8.4623 4.9006 1.4514
7
3. METHODS
We experimented with sampling our time-series at several different intervals and concur with Najand (2008) that weekly data provides "a good compromise on the use of noisy daily data and a relatively short span of monthly data." However, some of our time-series are not long enough to use even weekly data. Instead of using Wednesday closing prices, we picked an arbitrary starting date and iterated through the time series keeping the next date that was at least a set number of days after the previous kept date. This allowed us to easily experiment with different time intervals to balance noise-reduction with sample size. We used weekly intervals when possible and slightly shorter when necessary. Each estimation used the maximum duration available for the explained alternative energy mutual fund--5 years for the generic alternative energy fund and approximately 2 and a half years for the solar-, wind-, and nuclear-specific funds.
Excess Returns
We transformed the closing prices of our time-series into excess returns. We calculate the return of our risk-free asset, 3-month U.S. Treasury bills, over a short interval:
(1)
is the return of a 3-month U.S. Treasury bill at time t.
is the annualized interest rate of a 3-month U.S. Treasury bill at time t.
8
We use the excess returns time-series as the data sets for our econometric model.
Econometric Model
We extend Najand (2007) and Henriques (2008) in using a multi-factor CAPM-GARCH(1,1) model to estimate conditional volatility in alternative energy mutual fund excess returns.
(2)
(3)
(4)
9
4. RESULTS
In all four of our explained time-series—the PowerShares WilderHill Clean Energy Portfolio, the MAC Solar Index, the First Trust Global Wind Energy ETF, and the iShares S&P Global Nuclear Index ETF—all three factors—the U.S. stock market, oil prices, and U.S. foreign exchange rates--were found to be statistically significant and the null hypothesis of no ARCH(1) effects was rejected, indicating the appropriateness of the GARCH(1, 1) method.
Alternative Energy
The PowerShares WilderHill Clean Energy Portfolio, representing alternative energy firms in general, is highly responsive to the broad stock market. A 1% movement in the Vanguard 500 Index Fund will correspond to a 1.4% movement in the
PowerShares WilderHill Clean Energy Portfolio. As found in Najand (2008), alternative energy is not highly responsive to oil prices, although the relationship is significant. For a 1% movement in the price of oil, the PowerShares WilderHill Clean Energy Portfolio only moves 0.11%. Interestingly, the PowerShares WilderHill Clean Energy Portfolio is significantly negatively correlated with movements of the Nominal Broad Dollar Index. If the Nominal Broad Dollar Index increases 1%, then the PowerShares WilderHill Clean Energy Portfolio will decrease 0.7%. In comparison, large modern firms heavily engaged in export, such as The Coca-Cola Company (KO), have very small response to the Nominal Broad Dollar Index.
10
At the time of this writing, the major holdings of the PowerShares WilderHill Clean Energy Portfolio are primarily firms engaged in solar energy. As might be expected, MAC Solar Index is largely similar to the PowerShares WilderHill Clean Energy Portfolio. Solar energy firms have a 1.44 correlation coefficient with the broad stock market and a 0.09 correlation coefficient with oil. However, solar energy firms appear to respond even more highly to fluctuations in foreign exchange rates, having a -1.56 correlation coefficient with the Nominal Broad Dollar Index.
Wind
Wind energy firms appear to be on par with the broad market systemic risk, having a 0.98 covariance with the Vanguard 500 Index Fund. The First Trust Global Wind Energy ETF responds more than the PowerShares WilderHill Clean Energy
Portfolio to foreign exchange rates, having a covariance of -1.06 with the Nominal Broad Dollar Index, and less response than the PowerShares WilderHill Clean Energy Portfolio to oil prices, having a covariance with oil futures contract 1 of 0.06.
Nuclear
Similar to wind energy, nuclear energy firms are nearly one-to-one correlated with the broad stock market's systemic risk. The iShares S&P Global Nuclear Index ETF has a 1.02 covariance with the Vanguard 500 Index Fund. The iShares S&P Global Nuclear Index ETF has a -0.73 covariance with the Nominal Broad Dollar Index and a 0.13 covariance with oil Future Contract 1.
11
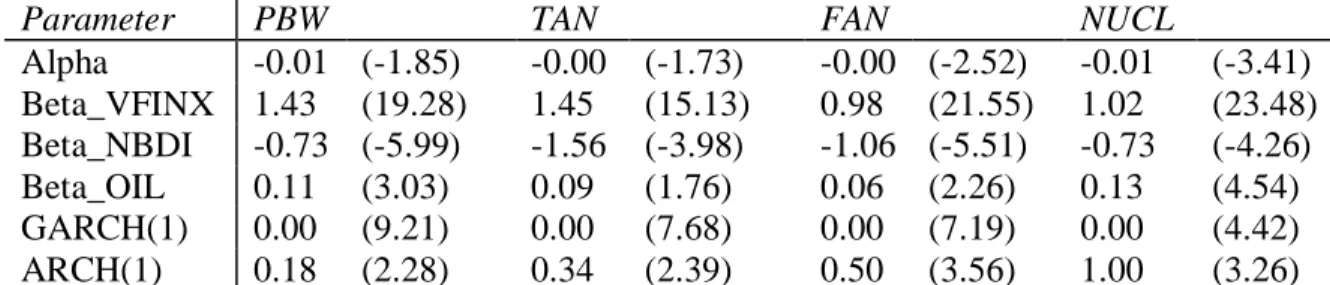
Table 2. Market Risk Comparisons
Parameter PBW TAN FAN NUCL
Alpha -0.01 (-1.85) -0.00 (-1.73) -0.00 (-2.52) -0.01 (-3.41) Beta_VFINX 1.43 (19.28) 1.45 (15.13) 0.98 (21.55) 1.02 (23.48) Beta_NBDI -0.73 (-5.99) -1.56 (-3.98) -1.06 (-5.51) -0.73 (-4.26) Beta_OIL 0.11 (3.03) 0.09 (1.76) 0.06 (2.26) 0.13 (4.54) GARCH(1) 0.00 (9.21) 0.00 (7.68) 0.00 (7.19) 0.00 (4.42) ARCH(1) 0.18 (2.28) 0.34 (2.39) 0.50 (3.56) 1.00 (3.26) Each parameter estimate is displayed with its t-statistic in parentheses to the right.
12
5. CONCLUSION
The results of these estimations reinforce the findings of past studies such as Henriques (2008) and Schmidtz (2009) that including alternative energy firms in a portfolio is a good way to increase a portfolio's risk and therefore its expected return. We also find that alternative energy is good hedge against the weekly fluctuations of oil prices, having a low correlation with oil prices. Henriques (2008) suggests that investors view alternative energy companies more as generic technology companies than as having a strong relationship with oil. Though the price of oil affects all stocks, due to its use as an input in production and an indicator of inflation, oil cannot be shown to influence alternative energy companies much more than the stock market as a whole. Further work could search for a relationship between alternative energy firms and critical levels of oil prices or sustained increases in oil prices, rather than a relationship between weekly excess returns.
One of our contributions is the separate analysis of solar, wind, and nuclear energy. We find that the bulk of alternative energy's greater response to systemic risk resides in solar energy firms. However, we caution that these type-specific alternative energy mutual funds are still young and that behavior may change as the industry matures.
Another contribution is the addition of foreign exchange rates to the model. The highly negative correlation of alternative energy firms to the Nominal Broad Dollar Index suggests that these young firms are too small to have well-developed currency hedging activities. Large modern firms have low response to currency fluctuations, even
export-13
dependent firms such as The Coca-Cola Company. However, these large firms also have treasury departments that actively engage in currency markets. Currently, alternative energy firms provide a good hedge against a rising dollar for interested investors. However, as the industry matures and the firms grow to a size that they can engage in non-core activites, we expect this negative correlation to reduce. Small firms do have the ability to outsource their treasury operations to a broker or other agency, such as Oanda Forex Consulting, but the evidence shows that few of these firms have done so. Indeed, the firms that survive the years are likely to be ones that have the foresight to manage currency fluctuation.
14
REFERENCES
Bollerslev, Tim, Robert F. Engle, and Jeffrey M. Wooldridge (1988). "A Capital Asset Pricing Model with Time-varying Covariances". Journal of Political Economy, Vol. 96, No. 1, pp. 116-131.
Henriques, Irene and Perry Sadorsky (2008). "Oil Prices and the Stock Prices of Alternative Energy Companies". Energy Economics, Vol. 30, pp. 998-1010.
Invesco PowerShares. (2010) “WilderHill Clean Energy Portfolio.”
http://www.invescopowershares.com/products/overview.aspx?ticker=pbw (Accessed September 20, 2010).
Markowitz, Harry (1952). "Portfolio Selection". The Journal of Finance, Vol. 7, No. 1, pp. 77-91.
Najand, Mohammed, John Griffith, and David C. Marlett (2007). "Do life insurance stocks provide superior returns?". Journal of Asset Management, Vol. 8, No. 1, pp. 52-57.
Sadorsky, Perry (2001). "Risk factors in stock returns of Canadian oil and gas companies". Energy Economics, Vol. 23, pp. 17-28.
Sharpe, William F. (1964) “Capital Asset Prices: A Theory of Market Equilibrium under Conditions of Risk”. The Journal of Finance, Vol. 19, No. 3, pp. 425-442.
Shmidtz, Anthony (2009). “Effect of Oil Prices on Alternative Energy Investment Returns”. Georgia Institute of Technology, masters’ thesis.
Standard & Poor’s (2010). “Standard & Poor’s”. http://www.standardandpoors.com (Accessed October 30, 2010).