THE EFFECT OF CEO OPTION COMPENSATION ON THE CAPITAL STRUCTURE: A NATURAL EXPERIMENT
ONUR KEMAL TOSUN
Abstract
CEO option compensation and the capital structure decision are simultaneously made choices. Using the Internal Revenue Code 162(m) tax law as an exogenous shock to compensation structure in a natural experiment setting, I can identify firm leverage changes as a result of CEO option compensation changes. The evidence provides strong support for debt agency theory. The results indicate firms decrease leverage when CEOs are paid with more options, and when CEO options become a higher percentage of future cash flows. The findings remain robust after controlling for corporate governance and convertible debt.
JEL Classification: G32, J33, C23, C33
Keywords: CEO compensation, Capital Structure, Governance, Natural Experiment, Identification.
Onur Kemal Tosun is an Assistant Professor of Finance in Warwick Business School at
University of Warwick, United Kingdom.
I appreciate the valuable comments from Raghu Rau (Editor) and an anonymous referee. I gratefully acknowledge the contribution of Michael Faulkender, Gordon Phillips, Lemma Senbet, Gerard Hoberg and seminar participants at the University of Maryland, University of Kentucky, University of Warwick, University of Cambridge, Norwegian School of Economics, Norwegian Business School, Ozyegin University. All errors are my own.
1. Introduction and Related Theories
Numerous studies have examined the relationship between CEO option pay and the capital structure choice. Some papers define leverage as the dependent variable and examine its relationship with CEO option pay, explicitly assuming that pay structure variation causes differences in observed firm leverage. Others describe the option compensation as the dependent variable and investigate how it varies with the leverage decision. The empirical challenge is that these are both choices of the firm that are arguably made simultaneously. Therefore, it is difficult to identify the cause of this relationship from the existing literature. In this paper, I use an exogenous shock that only influences CEO option compensation. Then, I examine how changes in the option pay resulting from that shock affect the capital structure. This allows me to identify whether changes in compensation structure cause changes in leverage ratios.
The specific exogenous shock used in the natural experiment is Section 162(m) of the Internal Revenue Code (IRC 162(m)). The Revenue Reconciliation Act of 1993 added Section 162(m) to restrict the corporate tax deduction for executive compensation to $1 million but with an exception for the performance based compensation:
“…In the case of any publicly held corporation, no deduction shall be allowed under this chapter for applicable employee remuneration with respect to any covered employee to the extent that the amount of such remuneration for the taxable year with respect to such employee exceeds $ 1,000,000…”
Consequently, beginning on January 1, 1994, companies have largely adjusted their compensation packages so that the pay over $1 million qualifies under the performance based exception. That change primarily occurs in the form of increased option compensation. Importantly, IRC 162(m) should have no direct influence on the capital structure. This tax deduction limitation and the link to performance based compensation should not alter the tax benefits, financial distress costs, information asymmetry, or market timing motivations of a firm when determining its optimal capital structure. As a result of that, I can use IRC 162(m) as a valid instrument for the exogenous shock in the natural experiment. Moreover, IRC 162(m) is not a binding constraint for all companies. Only firms paying the CEO a cash salary of $1 million or more are affected. This binding constraint enables me to compare these treatment firms (those paying at least $1 million in salary) to the control companies before and after the exogenous shock.
The main research question is “How does CEO option compensation influence the capital structure decision?” With respect to the studies that investigate the link between the option pay and leverage, there is a substantial disagreement over the nature of this relationship. Bryan, Hwang and Lilien (2000), Hassan and Hosino (2008), Andrikopoulos (2009) and Sepe (2010) claim there is a negative relationship between the option pay and the leverage decision. These studies report a decreasing impact of
CEO option compensation on leverage relying on debt agency theory. 1 Jensen and Meckling (1976) suggest that stock options tie the wealth of the CEO and equityholders together and mitigate agency problems between them (e.g. free cash flow theory). According to the debt agency view; when debtholders are informed of this CEO compensation structure, they become reluctant to grant funds and ask for higher returns. It is because they know the option payments have no downside for the CEO due to the convex payoff structure. The CEO with a high option pay wants to increase stock price volatility by investing in more risky projects, which will increase the risk of default. In that case, debtholders bear the risk of those investments while the CEO and shareholders get the majority of the return. So, the wealth is shifted away from debtholders to shareholders. Consequently, debtholders demand higher returns; which potentially creates the agency cost of debt. To keep the cost of debt at minimum, the firm with large option based compensation optimally decides on less debt which decreases the leverage.
On the other hand, Lewellen, Loderer and Martin (1987), Berger, Ofek and Yermack (1997), MacMinn and Page Jr. (2006), Coles, Daniel and Naveen (2006) and Tchistyi, Yermack and Yun (2011) argue that the relationship between CEO option pay and leverage should be positive, which is supported by managerial agency theory. In case of information asymmetry, if creditors are not well informed and the shares are underpriced, the CEO avoids equity funding and turns to debtholders. Agrawal and Mandelker (1987) and DeFusco, Johnson and Zorn (1990) state that executives compensated highly with options are willing to increase volatility and engage in risk taking decisions. If debtholders are not fully aware of this option pay and its wealth shifting implications, according to the managerial agency view, the CEO with large option pay can borrow more from debtholders. By doing so, the CEO may boost stock price volatility and extract more wealth from the option compensation as the shares become riskier. This may destroy the firm value and harm the shareholders. Consequently, as the CEO receives more options, excessive amount of debt is raised that increases the leverage ratio.2
Apart from the studies with two competing agency views, there are other papers claiming no relationship between CEO option pay and leverage. Yermack (1995) analyzes stock options by using the Black-Scholes valuation approach, while Mehran (1995) examines the executive pay structure of randomly selected manufacturing firms only. Those studies don’t find evidence for a significant relationship between the equity based pay and leverage. Hayes, Lemmon and Qui (2012) research the link between the option pay and risk taking behavior by using FAS 123R and the change in accounting
1A negative relationship with a reverse causality is suggested by John and John (1993). They predict that increases in leverage should lead to a lower pay-performance sensitivity of CEO pay.
2 Further, Ortiz-Molina (2007) analyzes the effect of the capital structure on executive pay policies. The paper reports pay-performance sensitivity declines in straight debt, but increases in convertible debt.
treatment of options. They don’t find a strong relationship between the decline in the option pay and less risky investments.
The literature can’t come to an agreement on the cause and the nature of the relationship between the managerial option compensation and the capital structure. I try to overcome this identification challenge by conducting a natural experiment via the 162(m) tax law as an exogenous shock to CEO compensation structure. CEO option pay changes are exogenous in the analysis because the tax policy change itself is exogenous. I use a Triple Difference-in-Difference analysis. I compare the treatment firms, affected by the IRC 162(m) law, to the control firms in terms of the change in CEO option pay and its impact on leverage. In the analysis, I also compare firms in the pre-period to the firms in the post-period. I construct the main variables of interest as the value and the number of options. The option value normalized by the total CEO compensation captures the wealth impact. The number of options normalized by the shares outstanding provides insight into what percentage of the future cash flows is granted to the CEO as opposed to shareholders. Option grants represent the number of potential shares to the CEO promised in the future; thus, it makes sense to scale option grants by the total outstanding shares. Interacting these right hand-side option measures with post and treatment dummies, I try to define how the capital structure of treatment firms after the tax policy is affected by the degree of increase (decrease) in CEO option pay.
The main finding of this study is that the increase in CEO option compensation has a mitigating effect on the general trend of increasing leverage across firms. In particular, the results indicate that firms decrease leverage as the CEO is compensated more through options and as those options become a higher percentage of the firm’s future cash flows. Moreover, firms decide on less debt financing as the CEO receives more valuable options. The findings are consistent with the debt agency theory3 (i.e., the conflict between the CEO and debtholders), stating a negative relationship between CEO option pay and leverage.
Before proceeding further, I address possible concerns about the natural experiment and alternative explanations to the findings. Although the 162(m) tax law is an exogenous event for firms, it can be argued that companies might have anticipated its occurrence and behaved accordingly: firms might have increased the option pay and due to the convex payoff, they have issued more debt. I investigate this 3 When the CEO is paid with more options, the CEO may want to take on more risk to increase the benefit gained from the option pay via high stock price volatility. This is due to the convex payoff structure of options. But the firm may not increase leverage because the informed debtholders are aware of the wealth- and risk-shifting behavior of the CEO. Thus, they demand higher returns from the firm which increases the agency cost of debt. In equilibrium, this leaves the firm no choice but to decide on lower leverage to economize on this cost.
possibility and show that it is not the case because the treatment (firms with a CEO salary at least $1 million) and control firms show no rapid increase in the option pay before the law. (See Figure 4, Appendix). In addition to that, leverage appears to increase not only for treatment firms but also for control firms before the shock. (See Figure 3, Appendix). Moreover, I conduct placebo tests for the period before the exogenous event which should capture any significant anticipation by firms.
Another issue might be the omitted factors throughout the experiment or even in 1994 which may cause the change in leverage. The results do not appear to be driven by the omitted factors because I control for them with the cross sectional variation in the model (via treatment vs. control groups), along with the time series variation (via before vs. after shock period). In addition to these dummy variables, I include firm fixed effects absorbing any potential influence by other characteristics of treatment firms, such as size, R&D, tax, dividend policies, and non-debt tax shield benefits that are firm specific and time invariant. Any possible impact on treatment firms which are different across years would be absorbed by the year controls.
Another concern about treatment and control groups might be the case that these groups may not be similar on observables. Also, there are other factors that could have differently affected those firms during this period, such as tech-bubble and low (perceived) cost of issuing equity during the stock market boom. This is because treatment and control groups may not have similar characteristics. That is not an issue in this paper. In untabulated analyses, I construct the groups using propensity score matching for random assignment of firm. Moreover, in a regression discontinuity design framework, I test the groups and the results for the allocation of control and treatment groups, as well as, for a discontinuous jump in leverage around $1 million salary cut-off. Furthermore, I examine treatment and control groups in terms of investment opportunities, profitability, liquidity, growth, size, and CEO tenure. I find both groups are similar for these factors, while treatment firms are slightly larger. Thus, I control for the size in the model and also conduct separate robustness checks for the firm size.
The change in the tax law may affect other pay components rather than just the option compensation, and this may encourage firms to substitute towards other non-salary compensation or even to reduce the total compensation. This is not the correct explanation for the findings in this paper. After examining parts of the total CEO compensation and CEO share ownership, I find that only the option pay seems to increase significantly after the policy change while the changes in CEO ownership, bonus, restricted stock grants and other types of compensation are not statistically significant. Also, the total CEO pay seems to increase after the tax law. Therefore, it is clear that the change in the tax reform affects only the option compensation significantly. Other non-salary compensation including stock grants and bonuses may not have influenced the leverage policy. Furthermore, stock options have convex payoffs whereas stock grants are more similar to a zero strike price option with zero convexity. Hence, unlike the
stock grants, option payments have no downside for the CEO once option is out of the money; and they create incentives for the CEO to take on risky projects. This may explain the motivation behind the preference of options over stock grants. Considering the stock grants in particular, Table 11 shows that option grants and the option ratio increase disproportionately more than stock grants and the stock grant ratio for treatment firms. The empirical evidence supports that the increase in the option ratio is statistically significant while the increase in the stock grant ratio is insignificant. Furthermore, other untabulated analyses show that cash bonuses along with stock grants don’t change significantly throughout the experiment. As discussed further in this paper, in the early 1990s the SEC required disclosure of only the number of options granted and not their value, while companies needed to report the value of bonuses and stock grants. This could make the option pay a more attractive choice.
An alternative explanation to the findings might be coming from the non-debt tax shield. DeAngelo and Masulis (1980) suggest that non-debt tax shield, such as stock option deductions, can reduce optimal leverage. The idea is that options generate large tax benefits which act as a substitute for the debt tax shield. In line with this theory, firms might reduce debt when the stock option pay increases, and the tax benefit of debt gets smaller. This seems a plausible theory to describe the results; however, the important point is that tax benefits don’t arise immediately when options are granted, but rather when those options are exercised. So, this can’t explain the direct link between the CEO option compensation increase and the leverage decrease right after the tax law. Therefore, the debt agency theory is more consistent with the findings. Furthermore, I investigate the cost of debt and also examine corporate bond ratings for treatment firms. I find that after the tax reform debt financing becomes more costly for treatment firms. This result helps to explain why debt agency theory is more coherent with the findings.
This paper is closely related to Gormley, Matsa, and Milbourn (2013), Chava and Purnanandam (2010) and Hayes, Lemmon and Qiu (2012). Gormley, Matsa, and Milbourn (2013) examine a two-way relationship between risk taking and managerial compensation. The article makes use of exogenous changes in left tale risk to identify causal changes in managerial compensation including option grants and vega. Chavna and Purnanandam (2010) and Hayes, Lemmon and Qiu (2012) focus on the link between managerial risk taking incentives, compensation structure and corporate financial polices by using FAS 123R and the changes in accounting rules.
This paper differs from the previous literature by trying to explain the relationship between CEO option compensation and leverage via a clearer identification in a stronger natural experiment setting. The power of the experiment comes from both cross sectional (treatment vs. control firms) and time series (pre- vs. post-period) variation. Different from the literature, I examine new debt issuance and how it is affected by the option pay. In addition to that, I introduce vested CEO options in the analyses. I try to identify the motivating effect of this type of option pay on the CEO’s decisions as they become
exercisable to buy the firm’s shares. I also control for CEO ownership because it may have a similar impact on leverage. Further, I examine CEO salaries of $900,000 and $800,000 as alternative cut-off points different from $1 million. By doing so, I test the validity of IRC 162(m) as an exogenous shock and observe how the original findings are affected. Placebo tests are also conducted in which I run the same models but with data in a shifted time range. I observe whether there are any other factors affecting either the option pay or leverage different from the exogenous shock. Additionally, I examine the unlevered firm risk before and after the shock. I try to detect if the law causes an increase in “real” risk taking by the CEO with a large option pay4. In order to further confirm the explanation by debt agency, I look at the specific subsamples where debtholders are more worried about debt agency problems, such as firms with dispersed lenders (banks), firms with high leverage and firms with high firm volatility. I analyze the results separately over these subsamples. Moreover, I conduct additional tests for the firm size. I redefine the treatment variable as the firm size in order to further examine the potential effect of size on leverage. Furthermore, I repeat the main analysis for only the firms that are close to $1 million threshold because firms that are very small or large are likely to be impacted differently by the exogenous shock. Additionally, I test the link between CEO option compensation and leverage via different variables of the option pay. I replicate the original analysis with the unscaled version of main independent variables. I also use other independent variables where the option pay is scaled by different CEO pay components. A strong corporate governance mechanism disciplines the CEO by reducing the discretion the CEO has over the compensation, and thus, alleviates the concerns by creditors. Also, implementing a convertible debt issuance system mitigates debtholders’ concerns about bearing too much risk and receiving low returns. Because of their potential mitigating effects, I control for corporate governance and convertible debt issuance in the analysis. After executing these tests with controls, I observe the original results for the relationship between CEO option compensation and leverage remain robust.
As part of follow-up robustness tests, I control for the corporate income tax in the regression models because it may have an impact on the capital structure. Furthermore, I introduce CEO fixed effects in the model to address the problem that the CEO may be replaced during the time period in the analysis. Finally, I examine any dividend cuts or retained earnings increase for treatment firms before and after the tax reform; and I compare that to the control firms. Many studies have shown that CEOs with high option compensation reduce dividends. A substitution away from cash pay towards equity would 4 I investigate the potential impact of the increase in the option pay on the firm investment policy. After examining the dividend, cash holding, capital expenditures and R&D policies in relation to the option pay changes, I find that only the R&D policy is affected. The impact is significantly positive as suggested by Bryan, Hwang and Lilien (2000).
have mechanically increased retained earnings (due to the non-deductibility of equity pay). This is not the case in this paper. On the contrary, I find that average dividend payments increase for treatment firms after the tax law while they stay at the same level for control firms. Average retained earnings seem to fluctuate around the same level for both treatment and control firms after the tax reform.
In this paper, I contribute to the literature by suggesting a solution to long debated identification and causality problems in linking executive compensation to the capital structure. Through this paper, I can provide a clear causality; and as the direction of impact is now determined, I can show the effect of the option pay on leverage. By using the natural experiment, I argue that high option compensation mitigates the trend in firm leverage increase and may result in less use of debt, all else is equal. Due to the clear identification in the natural experiment, the findings can suggest CEO option pay as one of the determinants of leverage. This study can help the CEO compensation committee and the board to make informed and efficient decisions about CEO pay regarding its impact on firm leverage. Additionally, policy makers may now rely on these findings while considering future regulations on executive compensation and its possible impact on the firm policy and the financial structure.
This paper can be extended in several ways. Unlike the similar previous studies, this study has a shorter time period of six years due to the unavailability of data. The sample size is not extensive due to the same reason. Further studies can expand this work using larger samples and a longer time span. While I focus only on the capital structure in this study, other firm policies, such as cash holdings, debt maturity and accrual management can also be examined as suggested in the literature. Moreover, the settings in this research comprise only CEO option pay but not the compensation to the CFO or any other top executives. While investigating the link between the option pay and risk taking behavior, similar papers consider firm specific events, such as M&As, or specific industries, such as manufacturing and chemicals. The external validity of the findings in this study can be tested under these different settings.
The remainder of the paper proceeds as follows. Section 2 describes the data selection and the variables. Section 3 discusses the implications of the IRC 162(m) law and the initial findings. Section 4 explains the empirical method used to examine the relationship and provides the main results along with the robustness tests. In Section 5, I present the conclusion.
2. Data Selection and Variable Construction
The data sample comes from Compustat and Execucomp databases from 1992 to 1997. I exclude financial firms and utilities, and I winsorize the variables with extreme values at 1% and 99% in order to mitigate the effect of outliers. While the data related to the capital structure and controls come from Compustat, the data necessary for the option compensation and explanatory variables come from the Execucomp database. The missing values crucial for the calculation of option pay measures are hand collected from
the EDGAR system through the SEC-Def 14a filings, where available. The sample consists of 1,329 observations with 410 firms.5
In the analyses, CEO option pay is represented in two different ways. I define “Option Ratio” as the Black-Scholes value of CEO option grants in a certain year divided by the CEO’s total compensation for that year. This measure shows the option pay as the percentage of CEO total compensation. The second main variable of interest is “Option Grant Ratio”. It is the number of options granted to the CEO in thousands divided by the number of firm’s shares outstanding in millions. This variable explains what percentage of the future cash flows have been granted to the CEO as opposed to shareholders. Moreover, option grants represent the number of potential shares to the CEO promised in the future. Thus, it makes sense to scale them by the total outstanding shares. By using multiple option pay measures based on the quantity and the value, I seek to identify different features of the option compensation.
I evaluate the capital structure with two different measures. “Leverage” is the book leverage that is calculated by dividing the sum of the debt in current liabilities and the long-term debt by the book value of total assets. This measure allows me to focus on only the debt itself. The other proxy for the capital structure is “Net Leverage”, which is calculated by subtracting cash holdings from the total debt and dividing that by the book value of total assets.6 This measure includes the cash component as “negative debt.” Firms can keep the same amount of debt but increase cash to reduce the equity volatility. That is the cash effect in the measure. It captures this different aspect of firm leverage and serves as a robustness check.
Considering the previous studies on the capital structure decisions by Titman and Wessels (1988), Opler, Pinkowitz, Stulz, and Williamson (1999), Guay and Harford (2000), Mackay and Phillips (2005), Leary and Roberts (2005), Billett, King and Mauer (2007), Rauh and Sufi (2010), Ma, Brockman and Martin (2012), Rampini and Viswanathan (2013), there are several frequently used determinants of leverage. The findings of these studies suggest that high leverage companies are relatively larger, have higher tangibility, lower growth, and less volatile earnings. Further, the results indicate that firms managed by CEOs with long tenure and firms with low operating profitability have higher leverage. Moreover, close examination of the relationship between leverage and industry characteristics shows that companies prefer higher leverage if they operate in more concentrated industries and in industries with higher debt average. Following the capital structure and executive compensation literature, I use several 5 Data back to 1992 cover only S&P 500 firms. Out of 500 companies, there are around 30 financial and utility firms. From the remaining 470 companies, I lose about 60 firms due to the missing values in tenure, growth and CEO compensation data.
control variables in this study. Operating profitability is the net cash flow from operating activities over total assets. Growth opportunity is constructed as capital expenditures over total assets. Size is the natural logarithm of sales. Tangibility is controlled by two variables. One of them is defined as the total of property, plant, and equipment over total assets. The other variable represents leasing. Leasing is formulated as the sum of property, plant, equipment, and ten times the rental expenses over the sum of total assets and ten times the rental expenses. Cash flow volatility is the quarterly standard deviation of the percentage change in operating income for the last three years. It is an important measure of volatility because the debt level does not directly affect it. Stock Grant Ratio is calculated as the ratio of CEO stock grants over the CEO’s total compensation for that year. Due to the concerns of possible increase in stock grants and their impact on the capital structure, I need to control for this variable in the main analysis. Tenure, the natural logarithm of the years served as CEO, is also controlled because it is a strong representative of the CEO characteristics. The last control variable focuses on the industry. Specifically, this variable is the natural logarithm of industry debt average. Fama-French 12 industries are used for the industry classification. The description of all variables is provided in Table 13, Appendix.
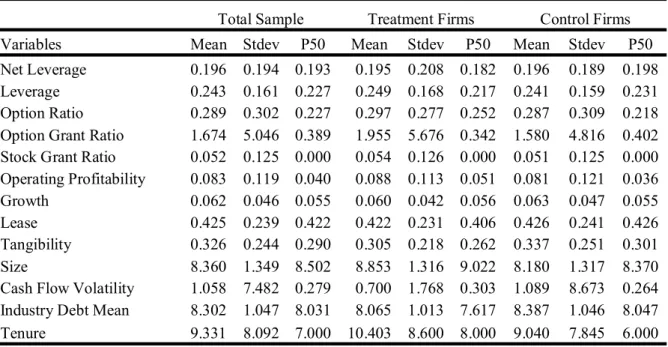
Table 1 presents the summary statistics for all variables. Considering the statistics for the entire sample, Leverage and Net Leverage show similar patterns in their distributions. Net Leverage is slightly more volatile compared to Leverage. On the other hand, the statistics for the option compensation proxies are quite interesting. Option Ratio and especially Option Grant Ratio are extremely skewed to the right. Along with high variance, this positive skewness shows that between 1992 and 1997, there are some firms compensating their CEOs with very high option pay while the majority of firms do not. Stock Grant Ratio has a mean of 5% and it is slightly skewed to the right. The statistics for firm characteristics are similar to the ones documented in previous studies, except the volatility. Cash flow volatility has a right skewed distribution with a high standard deviation which implies the sample consists of a large spectrum of firms with varying volatilities. The statistics for industry debt average is consistent with the literature. The statistics for CEO characteristics measure show that average CEO tenure is 9 years while the median value is 7 years. Comparing treatment firms to control firms in terms of the descriptive statistics, both groups have similar mean values for firm and CEO characteristics. The only small difference is for the firm size which seems to be slightly greater for treatment firms on average. Therefore, I control for size and also conduct separate robustness checks for the firm size which I discuss further in Robustness section.
I provide a broader view of the relationship between CEO option compensation and the capital structure before I discuss the main model. Figure 1 shows the annual mean values of independent and dependent variables in the analyses. Before the shock, Option Ratio has steady values around 0.26 while the values for Option Grant Ratio show a slight increase. In the pre-period, Net Leverage and Leverage
follow an incremental pattern, from 0.20 to 0.22 and from 0.25 to 0.27, respectively. In the years following the tax reform, Option Ratio increases from 0.21 to about 0.37. Likewise, Option Grant Ratio increases drastically in the post-period from 0.10 to 0.27. The annual mean values of Net Leverage start to drop from approximately 0.22 to 0.17 after the shock. Similarly, Leverage decreases gradually to 0.24 in the post-period. This figure shows a negative relationship between option and leverage measures after the shock7.
3. The IRC 162(m) Law and Initial Findings 3.1. IRC 162(M)
In this study, I employ the IRC 162(m) law as the exogenous shock to CEO compensation in a natural experiment setting. The Revenue Reconciliation Act with the Section 162(m) was enacted in 1993; and it limits the corporate tax deduction for executive compensation to $1 million with an exception for performance based compensation. Therefore, for the taxable years beginning on or after January 1, 1994, some firms have altered the structure of their compensation packages so that any excess over $1 million qualifies under the performance based exception. Stock option plans were preferred more as opposed to other compensation forms for compliance as performance based (by Perry and Zenner, 2001). As an exogenous shock, IRC 162(m) seems to provide suitable conditions for the identification of changes in CEO option pay, because the tax reform influences only the option compensation but not the capital structure. Due to the altered pay structure, the option pay should cause changes (if any) in leverage.
After the tax law, the CEO compensation structure changed drastically. Rose and Wolfram (2002) investigate the changes in CEO total compensation and cash salary caused by IRC 162(m). They find that the affected firms choose to pay cash salary around $ 1 million. Reintenga, Buchheit, Yen and Baker (2002) examine the impact of IRC 162(m) on performance based pay and earnings management. They conclude the law affects performance based pay drastically which incentivizes the CEO to smooth reported earnings. As documented by Perry and Zenner (2001), CEOs are compensated with more performance based pay after the tax reform. They state that companies prefer the option pay significantly more over other types of performance based payments, such as bonuses, because bonus plans may destroy firm value by providing incentives to manipulate earnings ineffectively. Murphy and Jensen (2011) suggest that CEOs may withhold effort, shift the earnings and cash flow unproductively from one period to another to justify the bonus payments. Relying on the regulations of the Securities and Exchange Commission (SEC), Murphy (2012) justifies the choice of options over bonuses. In the early 1990s, the
7 Examining debt and equity levels, I find treatment firms increase equity and decrease debt after the tax reform. Control firms increase debt substantially keeping equity around the same level.
SEC decided that shares acquired by exercising options could be sold right after they are exercised. This change eliminated the six-month holding requirement. The SEC also required the disclosure of only the number of options granted and not their value. On the other hand, companies needed to report the value of CEO bonus pay. These new regulations made the option compensation more attractive for firms compared to bonus payments. Consequently, CEOs were paid with more and valuable options after the IRC 162(m) law under performance based compensation.
3.2. UNIVARIATE ANALYSES
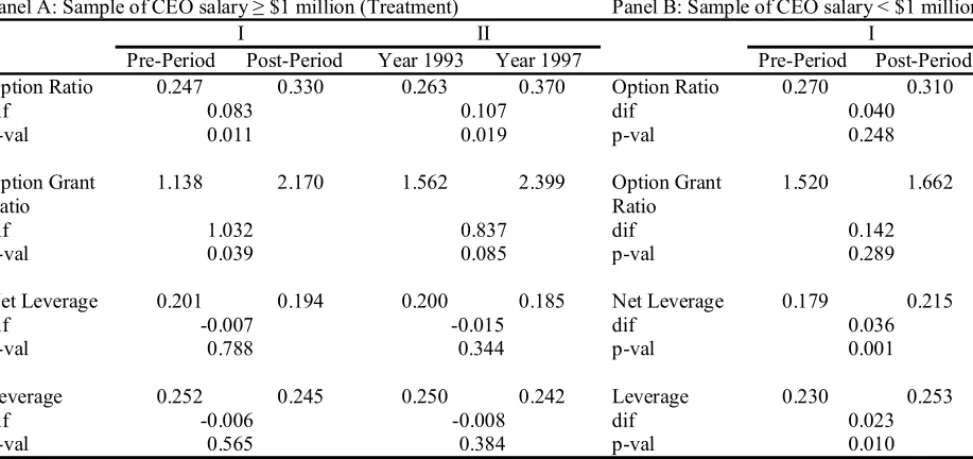
The time interval for univariate analyses is between 1992 and 1997. The interval covers the two-year pre-period (1992-1993) before the IRC 162(m) tax reform, and the four-year post-pre-period (1994–1997). I conduct two univariate analyses. In the first test, I compare the pre-period measures to the post-period measures for leverage and options to observe any significant differences in their values. Further, I repeat the analysis only for 1993 and 1997 to discern any differences on a larger scale. Then, I replicate the tests using two sample groups: firms with CEO salary at least $1 million (treatment) and the salary less than $1 million (control).
Table 2 provides the results for the first univariate analysis. Focusing on the comparison between pre- and post-periods in Panel A, I find a statistically significant increase for Option Ratio and Option Grant Ratio values in treatment firms. Considering control firms in Panel B, the increase is insignificant for option measures. Overall, it shows the influence of IRC 162(m) as exogenous shock on CEO option compensation. In Panel B, Leverage and Net Leverage values for control firms increase while both measures for treatment firms either remain unchanged or decrease after the shock. Contrary to the expectation of a greater decline, the drop for these measures is small. There is a delay in decrease which starts after 1994. Also, the mean values of the entire pre- and post-periods are considered in this test. Hence, the change is perceived as small. For control firms in Panel B, both leverage measures increase significantly. This indicates an ongoing trend in leverage increase throughout the years in the sample which would have affected treatment firms similarly. But there is a decline in leverage measures for treatment firms. Even though it is small, it shows what would have happened to control firms if they were subjected to the exogenous shock: a mitigating effect on the significant rise in leverage. So, the results for treatment firms imply that the main trend of leverage increase is stopped and even reversed for those firms in the post-period.
Column II displays the findings of the same tests for 1993 and 1997 only. The mean value increase in Option Ratio and Option Grant Ratio for treatment firms is statistically significant. That is an important evidence for the impact of the tax reform on CEO option pay, also documented by Perry and Zenner (2001). Focusing on the firms with CEO salary less than $1 million in Panel B, the increase in
Option Ratio and Option Grant Ratio is insignificant. Overall, these results imply that the IRC 162(m) law influences the option compensation only for the firms with the binding condition. Interestingly, there is a greater decrease in Net Leverage and Leverage for treatment firms. On the other hand, the large increase in both leverage measures for control firms in Panel B suggests firms that are not subjected to IRC 162(m) raise leverage in the post-period. These results explain how the tax law changes the option compensation which affects the leverage decision.
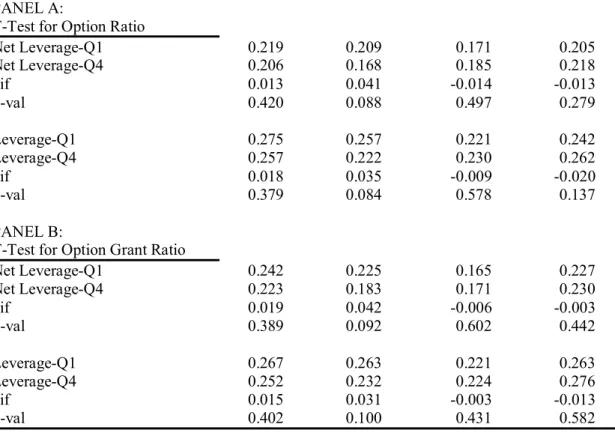
For the second analysis, I contrast the highest quartile to the lowest quartile of Option Ratio and Option Grant Ratio. For this comparison, I refer to the associated Leverage and Net Leverage quartile averages for the pre-period. I replicate the analysis for the post-period and examine whether there is a significant difference between pre- and post-periods’ quartile differences. If the option pay influences the capital structure, then the effect should be mainly reflected in quartile differences of the post-period. I repeat these tests for the data sets with CEO salary at least $1 million and the salary less than $1 million, so that I can compare treatment firms to control firms.
Table 3 shows the findings of the second univariate analysis. Considering the quartile averages of Leverage and Net Leverage for Option Ratio in the pre-period, there is a difference between the mean values even though the difference is not statistically significant. Specifically, in Panel A for treatment firms, the mean leverage measures are higher for the lowest Option Ratio quartile (Q1) and lower for the highest quartile (Q4). That indicates a reverse and weak relationship between CEO option compensation and the capital structure. On the other hand, the mean leverage difference is larger and statistically significant for the post-period which shows a stronger negative relationship between the option pay and leverage in the post-period. Furthermore, for control firms, the relationship is exactly the opposite, but not significant. Particularly, the mean leverage values are lower for the lowest Option Ratio quartile and higher for the highest quartile in pre- and post-periods. Considering these results, leverage drops significantly for the high option pay and only for treatment firms after the policy change. This suggests an influence of CEO option compensation on leverage for those firms after the IRC 162(m) law. Also, the mean leverage changes of the same quartiles before and after the shock are interesting to examine further. For treatment firms in the post-period, the value for the lowest quartile drops from 0.219 to 0.209 for Net Leverage and from 0.275 to 0.257 for Leverage. The value change for the highest quartile is even greater. This finding implies that both leverage values decrease after the shock for treatment firms, and the change is greater for high Option Ratio values.
Panel B reports the results of the same analysis using Option Grant Ratio. The findings for Option Grant Ratio are similar to the ones for Option Ratio regarding the treatment and control firms. The quartile differences of mean leverage measures are greater and statistically significant in the post-period
for treatment firms. Also, mean leverage values seem to decline in the post-period compared to the pre-period due to the possible influence of the increased option compensation.
4. The Empirical Method and Main Results 4.1. THE MODEL
The time period for the natural experiment is from 1992 to 1997. The model covers the two-year period before the announcement of IRC 162(m) (1992–1993) and compares it to the four-year period after the shock (1994–1997). The pre-period has only two years due to the data availability. I restrict the experiment with four years in the post-period because the power of the experiment deteriorates over time after the shock due to other potential factors that affect the relationship between the option pay and leverage.
The natural experiment is done via a Triple Difference-in-Difference analysis. In the analysis, I use dummy variables for the post-period and treatment firms along with the interactions of these variables with the option measure. Thus, I can examine all possible effects from option measure variations on the capital structure. In this paper, I try to show it is through the option compensation channel that the leverage changes arise. I try to identify how much the capital structure is affected by the degree of increase (decrease) in CEO option pay for treatment firms after the tax policy. I examine whether in the post-period, option grants have a greater effect on leverage for treatment firms than an identical option grant for a control firm. The interaction of options with Post and Treated dummies captures this idea. The treated firms are IRC 162(m) binding firms that compensate their CEOs with a salary equal to or greater than $1 million. The post-period data cover all observations after 1994 and beyond. Approximately 25% of the firms in the sample are treatment firms while the rest belongs to the control group. Option Ratio*post, Option Ratio*treated, Option Ratio*post*treated, Option Grant Ratio*post, Option Grant Ratio*treated, Option Grant Ratio*post*treated, and post*treated are the interaction variables of Option Ratio, Option Grant Ratio, Treated, and Post. Year and firm fixed effects along with controls, such as tenure, operating profitability, growth, leasing, tangibility, firm size, cash flow volatility, stock grant ratio and average industry debt are added in the model. Standard errors are clustered by firms. This analysis also eliminates any potential effects specific to each industry due to the calculation of “differences” in the model. Further, the time interval is six years which is a short time period for industries to change and cause an effect on variables in the analysis. The model is specified as follows:
(1) t i l l t i l t i t i t i t i t i t i t i t i t i t i t i t i t i
Controls
X
treated
post
X
treated
X
post
X
treated
post
treated
post
Y
, 8 1 , , , , , , , , , , , , , , ,*
where Y is the leverage measure; X is the option measure; the firm observation is i = 1, … , N; the entire
period is t = 1992, … , 1997; the number of control variables is l = 1, … , 8; and α, β, γ, δ, θ, ε, λ, φ, ρ, μ
are the coefficients of the constant term, post-period, treated firms, treated firms in the post-period, option measures, option measures in the post-period, treated firms’ option measures, treated firms’ option measures in the post-period, controls, error term, respectively.
In untabulated analyses, I construct control and treatment groups in the sample using propensity score matching for random assignment of firms. I also test the groups in a regression discontinuity design framework for a discontinuous jump in leverage around $1 million compensation threshold. I want to check whether these groups are similar in all characteristics and differ only in binding constraint of the tax law. In addition to that, I compare the treatment group to the control group in terms of investment opportunities, profitability, liquidity, growth, size and CEO tenure.
The fixed effects approach is used in the analysis because it controls for the omitted variables that differ between firms but are constant over time. It is a necessity for the difference-in-difference analysis. Moreover, I want to examine the change in the firm’s response before and after the exogenous shock. So, I need to focus on the difference between average post-period values and average pre-period values for that firm after removing changes explained by other factors. That requires firm specific intercept which is estimated via the fixed effects. Finally, for precision, I conduct the Hausman test and decide to use the fixed effects approach.
4.2. MULTIVARIATE ANALYSIS (TRIPLE DIFFERENCE-IN-DIFFERENCE MODEL)
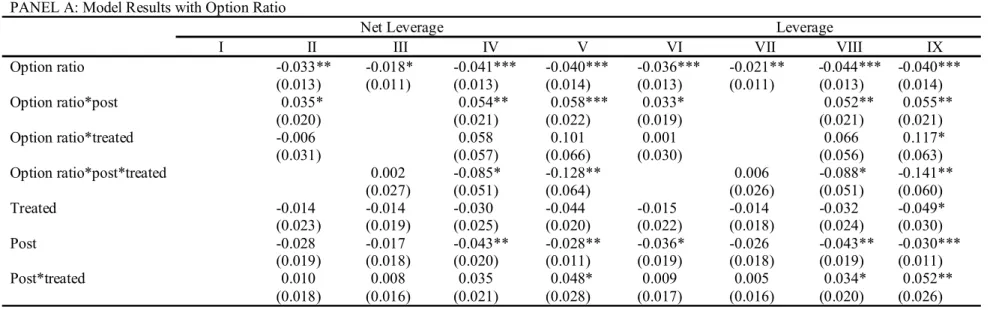
Table 4 presents the Triple Difference-in-Difference analysis for the relationship between CEO option pay and the capital structure. Column I gives the baseline model. Column II and Column VI provide estimates for the model with double interactions only. Column III and Column VII display findings of the model with only the triple interaction for the key variable of interest. In Column IV and Column VIII, the results for the complete model with all variable interactions are given. Column V and Column IX show the results for the complete model along with Stock Grant Ratio. The major focus should be on the estimates for Option Ratio*post*treated and Option Grant Ratio*post*treated because they are the main variables of interest that explain the possible impact of the option pay on leverage.
I obtain mixed results for the baseline model. Consistent with the literature, the findings indicate that companies with tenured CEOs decide on lower leverage as well as firms with high operating profitability, high growth rates, high leased properties and equipment, and low tangibility. Firms operating in industries with low debt average have low leverage ratios, too. Contrary to the literature, the outcomes of this baseline regression analysis suggest that firms with higher cash flow volatility choose to issue more debt.
Panel A shows the results for the model with “Option Ratio”. Even though Option Ratio has negative and statistically significant coefficients, it can’t provide a clear interpretation. It is because it represents all treatment and control firms together for the entire time period between 1992 and 1997. Considering all firms only after 1994 via Option Ratio*post, the potential effect of the option compensation is positive. Option Ratio*post represents also control firms. The influence of the option pay on leverage ratios for these control firms might be strongly positive so that it dominates the combined effect on net leverage and leverage. According to the estimates for Option Ratio*treated, the option pay doesn’t have a statistically significant impact on leverage measures in treatment firms considering pre- and post-tax reform periods together. Option Ratio*post*treated represents the option ratio for treatment firms after the shock. Its negative and statistically significant estimates suggest that treatment firms choose lower leverage ratios as their CEOs are compensated more with valuable options after the enactment of IRC 162(m). Particularly in Column IV, net leverage deteriorates by 2.55% (= 0.085 * 0.302) with one standard deviation increase (about 30%) in option ratio. In other words, if the dollar value of CEO options increases 30% of the total compensation, keeping the total pay constant, then the firm has a 2.6 % decline in net leverage. In Column VIII, leverage drops by 2.64% (= 0.088 * 0.302). Considering the total magnitude of change, the sensitivity of net leverage to option ratio is still negative and it is -0.014 (= -0.041 + 0.054 + 0.058 - 0.085) for treatment firms after the shock. It has the same value for leverage, too. While control firms in the post-period have a sensitivity of net leverage to option ratio of 0.013 (= -0.041 + 0.054), it is 0.017 (= -0.041 + 0.058) for treatment firms in the pre-period. These results indicate that firms subject to the rule 162(m) experience decreases in leverage ratios while firms not impacted by the tax law see a positive association between option grants and leverage measures. It is interesting to compare this finding to the general trend in leverage. For those treatment firms after the shock, leverage seems to increase about 3.4% according to Post*treated. But, when the influence of CEO option pay is considered, the increasing trend in leverage is reversed and leverage drops about 2.6%. This states the impact of the option compensation on the decrease in leverage. The model in Column V and Column IX incorporates the potential influence of stock grants on net leverage and leverage, respectively. The estimates for Stock grant ratio*post*treated suggest that stock grants have an insignificant effect on the decrease in leverage ratios for treatment firms in the post-period. The influence of CEO option pay on the capital structure becomes stronger for those firms after I control for stock grants in the model. In particular, net leverage deteriorates by 3.87% (= 0.128 * 0.302) and leverage drops by 4.26% (= 0.141 * 0.302) with one standard deviation increase (about 30%) in option ratio as suggested by Option ratio*post*treated.
Panel B displays the results for the model with “Option Grant Ratio”. The positive estimates of Option Grant Ratio suggest an increase in net leverage and leverage. But this is a rather general finding
for all firms between 1992 and 1997, which is probably dominated by the influence from control firms in the sample. Option Grant Ratio*post can’t provide any statistically significant results. Contrary to that, the positive estimates for Option Grant Ratio*treated indicate that treatment firms with large option compensation have higher leverage when both pre- and post-periods are considered together. All firms before the tax law had already high leverage ratios which may produce the positive estimates for Option Grant Ratio*treated. The very significant and negative estimates for Option Grant Ratio*post*treated suggest that as the CEOs of treatment firms are paid more with options after the tax law, those firms have lower leverage ratios. Specifically in Column IV and Column VIII, net leverage and leverage decrease about 3.53% (= 0.007 * 5.046) for one standard deviation increase in Option Grant Ratio. In other words, if the amount of options granted to the CEO (in millions) is increased by 0.5%, keeping the total firm shares (in millions) constant, then these treatment firms reduce leverage ratios by 3.53%. In terms of the total magnitude of change, the sensitivity of net leverage to option grant ratio is -0.003 (= 0.002 - 0.001 + 0.003 - 0.007) for treatment firms after the shock. It is -0.002 (= 0.002 - 0.001 + 0.004 - 0.007) for leverage. While control firms in the post-period have a sensitivity of net leverage to option grant ratio of 0.001 (= 0.002 - 0.001), it is 0.005 (= 0.002 + 0.003) for treatment firms in the pre-period. These findings imply that firms affected by the tax law decrease leverage ratios whereas firms not affected by the tax reform experience a positive relationship between option grants and leverage measures. A comparison between the estimates of Option Grant Ratio*post*treated and Post*treated reveals an interesting finding. The increasing trend of 1.7% in leverage ratios is in fact reversed when the influence of the option pay is considered. After I control for stock grants in Column V and Column IX, the significant and negative relationship between the option pay and (net) leverage persists. On the other hand, Stock grant ratio*post*treated shows stock grants don’t have a significant effect on the capital structure.
The Triple Difference-in-Difference analysis with Option Ratio and Option Grant Ratio concludes that the general trend in leverage increase across firms is mitigated for those treatment firms with large CEO option pay.8 The firms with more and valuable CEO option compensation decrease their leverage ratio after the IRC 162(m) tax policy change. This finding is consistent with the debt agency view of the world (i.e., the conflict between the CEO and debtholders). Option payments have no downside for CEOs due to the convex payoff structure. Thus, CEOs with high option compensation are likely to take on more risk, which in return increases the default risk concerns of debtholders. So, they
8 In untabulated analyses, I additionally control for CEO ownership, the total CEO compensation and the increase in the total CEO compensation, separately. Further, I repeat the tests using new debt issuance only. Moreover, I replicate the analyses with vested CEO options. The original results remain robust.
demand higher returns from those firms. In order to reduce this increased cost of debt, firms with a large option pay decide on lower leverage.
4.3. ROBUSTNESS
4.3.1. Cases with Debt Agency Concerns
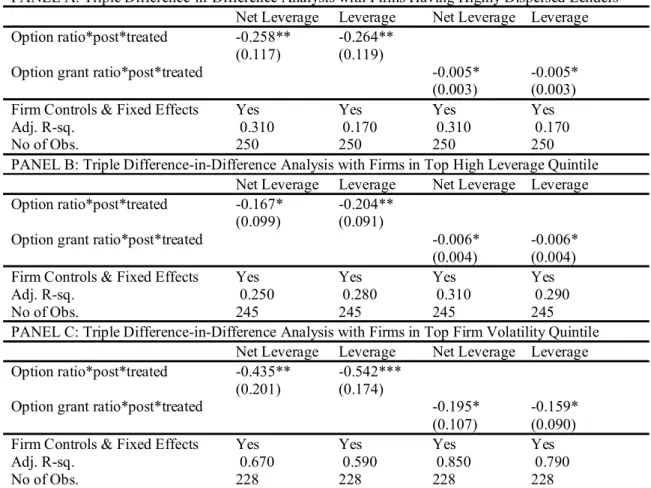
In this paper, the Triple Difference-in-Difference analysis concludes that firms with large CEO option pay decrease leverage. This finding is supported by the debt agency view of the world. In order to further confirm the explanation from debt agency theory, I look at the cases where debtholders are more likely to be concerned about the debt agency problem. Firstly, I consider a subsample of firms with highly dispersed lenders (banks). Any potential debt agency issue may have an aggravated effect in such firms because in a possible case of default, the firm needs to deal with a wider spread of banks. Second subsample comprises firms with very high level of leverage. More specifically, I consider firms in the top high leverage quintile since the debt agency problems are more severe for those firms due to the amount of debt they have accumulated. The final group has the firms with high volatility. In particular, I look at the companies in the top firm volatility quintile because the high risk they carry exacerbates any debt agency issue. The main drawback of this analysis is the loss of observations due to the smaller subsample size.
Table 5 displays the outcomes of the Triple Difference-in-Difference analysis with three separate subsamples. The results are stronger compared to the ones from the original model with the full sample. The negative and statistically significant estimates for Option Ratio*post*treated and Option Grant Ratio*post*treated confirm the robustness of the original findings. They state that treatment firms with large CEO option compensation choose lower leverage and net leverage after the shock which is the idea supported by the debt agency view.
4.3.2. Controls for the Competing Theories
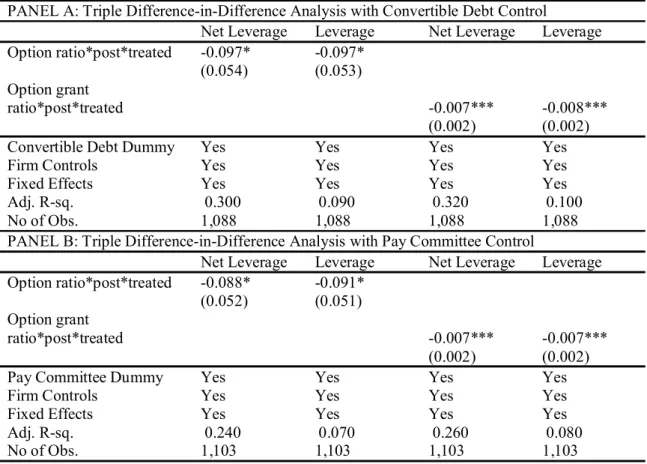
In the literature, some studies suggest that compensating the CEO with stock options ties the interests of shareholders and CEOs together. It increases the cost of debt, because the wealth is shifted away from debtholders who bear the risk of investments without sufficient returns. This problem is called the debt agency issue. As suggested by Haugen and Senbet (1981), issuing convertible debt can mitigate this problem because the convertibility gives debtholders the chance to trade debt into stocks in times of need, such as when they think projects are too risky. In order to control for any effect of debt agency on the option pay and leverage relationship, I repeat the analysis including the “Convertible Debt Dummy” variable. It is a dummy variable that equals one if the firm issues convertible debt and zero otherwise. The
results are presented in Table 6. The negative and significant impact of the option compensation on leverage persists in this robustness test.
Managerial agency theory states that CEOs engage in riskier investment projects as they are paid with more stock options. This can potentially destroy the firm value and lead to an excessive wealth transfer from stockholders to CEOs. A typical solution for this problem is strong corporate governance. As proposed by Gompers, Ishii and Metrick (2003), the Statement of the Financial Economists Roundtable (2003), Jiraporn and Gleason (2007), Faulkender, Kadyrzhanova, Prabhala and Senbet (2011), the reduction in the high level of discretion which CEOs have on their own compensation helps to mitigate this agency problem. This can be achieved by implementing a board with independent directors. To control any potential impact of managerial agency on the relationship between CEO option compensation and leverage, I replicate the main analysis via controlling for the CEO as a member of the compensation committee.9 “Pay Committee Dummy” is a dummy variable that equals one if the CEO is a member of the compensation committee and zero otherwise. Firms having a compensation committee without the CEO as a member should have better corporate governance. The results are presented in Table 6. As supported by the original findings, the negative effect of the option pay on the capital structure remains robust and statistically significant.10
4.3.3. Tests Concerning the Firm Size
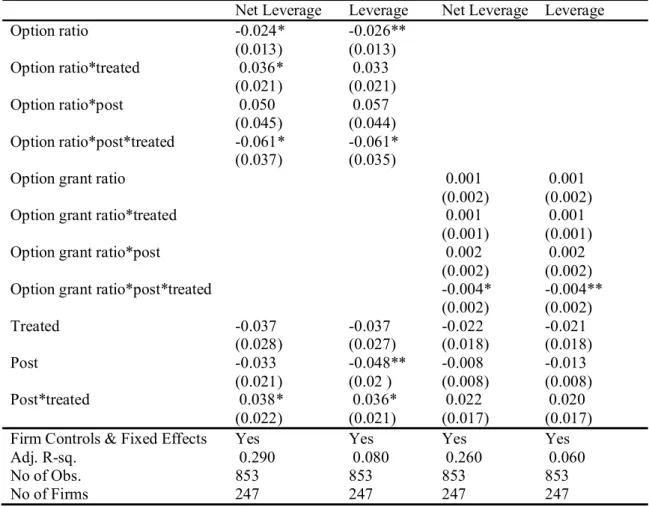
The sample comprises companies with different sizes. Firms that are very small or large are likely to be impacted differently from the exogenous shock in the analysis. It may be useful to consider only the firms that are close to $1 million threshold. Hence, I run the Triple Difference-in-Difference analysis with a reduced sample which only has firms with a CEO salary ± $300.000 of $1 million threshold11. The findings are given in Table 7. The negative and statistically significant estimates for Option Ratio*post*treated and Option Grant Ratio*post*treated confirm the robustness of the original findings for firms around $1 million threshold. Particularly, these results indicate that treatment firms after the 9 As another robustness test, I consider the GIM Index to control for strong corporate governance. Including a dummy for a low (or high) GIM index in the main regression model, I obtain robust results. 10 In untabulated analyses, I construct four subsamples: firms with the CEO as a member of pay committee; firms with the CEO as not a member of the pay committee; firms with convertible debt issuance; and firms with only straight debt issuance. For each subsample, I repeat the main analysis and observe results supporting the original findings.
11I repeat the tests with different salary brackets: “± $400.000” and “± $500.000” of $1 million threshold. The original results remain robust.
shock lower net leverage and leverage about 1.84% (= 0.061 * 0.302) and 2.02% (= 0.004 * 5.046) for one standard deviation increase in Option Ratio and Option Grant Ratio, respectively.
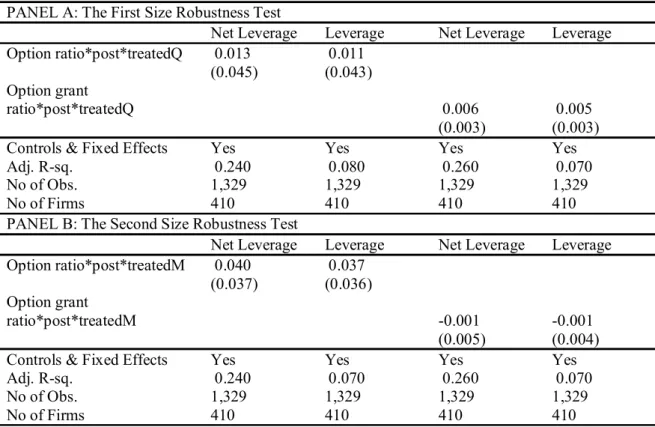
In order to further examine the potential effect of the firm size on the capital structure, I conduct two additional tests. In the first test, I replace the treatment variable with TreatedQ, an indicator for the firm size in the top 25th percentile, so that I can precisely mimic the original treatment variable. In the second robustness test, I substitute the treatment variable with TreatedM, an indicator for the firm size above median. The findings are shown in Table 8. I obtain statistically insignificant findings for the main variables of interest in both cases. They suggest that the firm size is not the main factor impacting the relationship between CEO option pay and leverage.
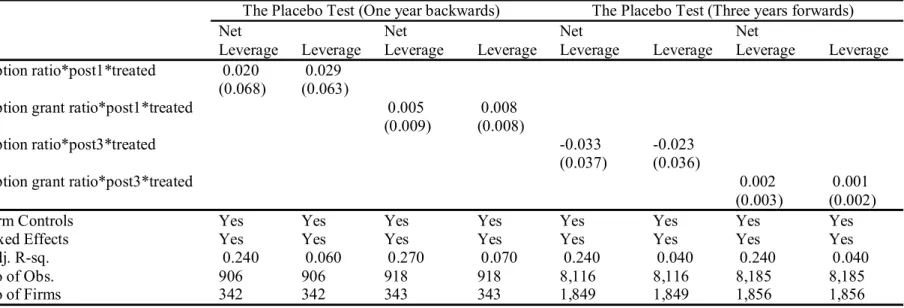
4.3.4. Placebo Tests
The correct choice of an exogenous shock for a solid identification is essential in this study. In order to examine the robustness of the natural experiment with IRC 162(m), I conduct placebo tests in which I keep the main structure of the model the same but shift the time range of the study. By doing so, I can observe whether there are other firm related endogenous shocks or independent exogenous shocks that influence the relationship between the option pay and leverage. If I have significant results from the placebo tests, it means there are other trends than the tax reform that affect the option compensation. In the first test, I move the time frame of the analysis one year backwards. I define a dummy variable, Post1, that equals one for values in the shifted post-period (1993–1996) and zero otherwise. In the second test, I shift the time range of the model three years forwards. I use a dummy variable, Post3, that equals one for values in the shifted post-period (1997–2003) and zero otherwise. The findings are given in Table 9. These analyses provide insignificant results. They support the validity of IRC 162(m) in the natural experiment as the only exogenous shock that affects the relationship between options and leverage.12
4.3.5. Different Independent Variables
In the analyses, I scale the main variables of interest by CEO total pay and the total number of outstanding shares, respectively. In order to observe the full unadjusted impact by the option compensation on leverage, I repeat the original tests with the unscaled version of the main variables: Option Value is the natural logarithm of the Black-Scholes value of option grants; and Option Amount is defined as the natural logarithm of the amount of options granted to the CEO. Table 10 presents the
12 I conduct additional placebo tests with a time shift of two and four years, respectively, and obtain similar robust results.
estimates. The negative and statistically significant findings for Option Value*post*treated and Option Amount*post*treated confirm the robustness of the original results.
While the option compensation has the incentive for the CEO to increase firm risk and equity value in order to boost the CEO’s wealth, the cash compensation may not create the same motivation for the CEO. Hence, it is interesting to further examine CEO option pay in comparison with the total cash pay, and research its effect on leverage. Therefore, I use a different independent variable and replicate the analysis via Option-Cash Ratio. It is the Black-Scholes value of option grants as a fraction of the cash compensation which is salary and bonus together. In general, the option compensation is classified as an incentive pay. Thus, I also define it as a fraction of the total incentive compensation, and observe its influence on the capital structure. I repeat the analysis with this new independent variable: Option-Incentives Ratio is the ratio of the Black-Scholes value of option grants to the performance based compensation which is bonus, stock grants, option grants and long-term incentive pay together. Table 10 shows the findings for these new independent variables. Cash Ratio*post*treated and Option-Incentives Ratio*post*treated have negative and significant estimates which suggest treatment firms after the shock decrease leverage and net leverage as CEO option pay increases. So, the original results stay robust even after the option pay is scaled by different CEO compensation components.
4.3.6. The Effect of Stock Grants
I examine the issue of a possible effect of stock grants on the capital structure. Table 11 presents that option measures increase disproportionately more than stock grant measures for treatment firms after the tax law. The empirical evidence supports that the increase in the option ratio is statistically significant while the increase in the stock grant ratio is insignificant. Moreover, Table 4 shows that option grants influence leverage, even after controlling for stock grants. As a further analysis, I construct two subsamples based on levels of the stock grant ratio, and run the main model for each subsample. The first subsample contains firms with Stock Grant Ratio less than 2%, while the second subsample comprises companies with Stock Grant Ratio more than 5%. I investigate the impact of CEO option pay on the capital structure for firms with low and high levels of stock grants, separately. The findings are given in Table 12. The negative and statistically significant estimates for Option Ratio*post*treated and Option Grant Ratio*post*treated confirm the robustness of the original findings even for the different levels of stock grants.
5. Conclusion
This paper examines the relationship between CEO option compensation and the capital structure. Specifically, the main interest is to uncover any possible impact of the increased option pay on leverage. I
control for the other channels of potential effects on leverage, and I use an exogenous shock, the IRC 162(m) tax law, in the natural experiment setting between 1992 and 1997 to clearly identify the option compensation. I find when CEOs are compensated with more and valuable options, the general trend in leverage increase is reversed for treatment firms after the shock. They choose lower leverage as suggested by debt agency theory (i.e., the conflict between the CEO and debtholders).
This paper contributes to the CEO compensation and capital structure literature by providing insight into the possible impact of the option pay on leverage. This study investigates the interaction between this relationship and corporate governance. The original findings remain robust after I control for any possible effects by corporate governance. Moreover, this study presents a thorough research via the Triple Difference-in-Difference analysis. Maybe most importantly, this research uses a natural experiment based on the IRC 162(m) law. To the best of my knowledge, this is the first study on the relationship between CEO option pay and the capital structure that is conducted in a natural experiment setting with both cross sectional (treatment vs. control firms) and time series (pre- vs. post-tax reform period) variation. Hence, this article does not only present a reliable identification of variables and a precise causality but also provides a baseline for further studies on this relationship. Further, this study with the clear identification and consistent findings can provide assistance to the compensation committee and the board. So, they can make informed decisions on CEO compensation regarding its potential impact on the capital structure. Lastly, policy makers may now rely on these results while considering future regulations on the executive compensation and its possible effects on the firm policy and the financial structure.
References
Agrawal, A, and Mandelker, G. N., (1987), “Managerial Incentives and Corporate Investment and Financing Decisions”, Journal of Finance 42, 823-837.
Andrikopoulos, A., (2009), “Irreversible Investment, Managerial Discretion and Optimal Capital Structure”, Journal of Banking & Finance 33, 709-718.
Berger, P. G., Ofek, E. and Yermack, D. L., (1997), “Managerial Entrenchment and Capital Structure Decisions”, Journal of Finance 4, 1411-1438.
Billett, M. T., King, T. H. D. and Mauer, D. C., (2007), “Growth Opportunities and the Choice of Leverage, Debt Maturity and Covenants”, Journal of Finance 62, 697-730.
Bryan, S., Hwang, L. and Lilien, S., (2000), “CEO Stock-Based Compensation: an Empirical Analysis of Incentive Intensity, Relative Mix, and Economic Determinants”, Journal of Business 73, 661– 693.
Chava, S. and Purnanandam, A., (2010), “CEOs versus CFOs: Incentives and Corporate Policies”, Journal of Financial Economics 97, 263–278.
Coles, J. L., Daniels, N. D. and Naveen, L., (2006), “Managerial Incentives and Risk Taking”, Journal of Financial Economics 79, 431–468.
DeAngelo, H. and Masulis, R. W., (1980), “Optimal Capital Structure under Corporate and Personal Taxation”, Journal of Financial Economics 8, 3-29.
DeFusco, R. A., Johnson, R. R. and Zorn, T. S., (1990), “The Effect of Executive Stock Option Plans on Stockholders and Bondholders”, Journal of Finance 45, 617-627.
Faulkender, M., Kadyrzhanova, D., Prabhala, N. and Senbet, L. W., (2011), “Executive Compensation: An Overview of Research on Corporate Practices and Proposed Reforms”, Journal of Applied Corporate Finance 22, 107-118.
Gompers, P., Ishii, J. and Metrick, A., (2003), “Corporate Governance and Equity Prices”, Quarterly Journal of Economics 2, 107-155.
Gromley, T. A., Matsa, D. A. and Milbourn, T., (2013), “CEO Compensation and Corporate Risk: Evidence from a Natural Experiment”, Journal of Accounting and Economics 56, 79-101.
Guay, W. and Harford, J., (2000), “The Cash-Flow Permanence and Information Content of Dividend Increases versus Repurchases”, Journal of Financial Economics 57, 385-415.
Hassan, H. and Hosino, Y., (2008), “Beginning of Stock Option-Based Compensation in Japan: a Test of Alternative Theories”, Journal of Financial Management and Analysis 21, 11-35.
Haugen, R. A. and Senbet, L. W., (1981), “Resolving the Agency Problems of External Capital through Options”, Journal of Finance 26, 629-647.