Research Paper doi: 10.17705/1pais.11303 Volume 11, Issue 3 (2019)
Determinants of Cloud Computing Adoption:
A Comparative Study
Shailja Tripathi1,*, Vaibhav Mishra21ICFAI Business School (IBS Hyderabad), IFHE University, India, [email protected] 2ICFAI Business School (IBS Hyderabad), IFHE University, India, [email protected]
Abstract
Background: This study investigates the determinants that influence the user's behavioral intention to use cloud computing in adopter and non-adopter firms. The research model is based on the theory of the Valence Framework of Behavioral Beliefs and Technology Acceptance Model (TAM). The present study examined the factors of perceived ease of use, perceived usefulness, perceived ubiquity, perceived benefits, perceived costs and perceived risks in determining behavioral intention to use cloud computing for the adopter and non-adopter firms.
Method: Data were collected using a questionnaire-based survey method. The valid responses received were 458. The sample size of adopters and non-adopter of cloud computing were 239 and 219, respectively. Exploratory Factor Analysis (EFA) and Structural Equation Modeling (SEM) was used for data analysis. Data analysis was done separately for both samples of the adopter and non-adopter firms The results showed that, for adopters firms, perceived usefulness, perceived ease of use, ubiquity, perceived benefits, and perceived risks were found to have a significant and direct influence on behavioral intention to use cloud computing. For non-adopters, perceived usefulness, perceived ubiquity, perceived benefits, perceived costs, and perceived risks were found to have a significant and direct influence on behavioral intention to use cloud computing. A comparison testing was also performed by examining the difference in the strength of path coefficients between adopters and non-adopters firms.
Results: The findings showed that the impact of favorable factors of perceived ubiquity and perceived benefits were found relatively more significant in the case of adopter firms than negative factors. Likewise, the impact of negative factors of perceived risks and perceived costs were found relatively more significant in the case of non-adopter firms.
Conclusions: The major contribution of this study is that it contributes to the understanding of progressive changes in the impact of behavioral beliefs and cognitive factors on behavioral intention to use cloud computing in adopter and non-adopter firms. This study also provides managers' practical understandings for cloud computing adoption during each phase of the adoption process.
Keywords: Cloud Computing, Technology Acceptance Model, Valence Framework, Structural Equation Modeling, Behavioral Intention.
Citation: Tripathi, S., & Mishra, V. (2019). Determinants of Cloud Computing Adoption: A Comparative Study. Pacific Asia Journal of the Association for Information Systems, 11(3), 28-54. https://doi.org/10.17705/1pais.11303
Introduction
Cloud Computing allows data to store, manage and process online without the need for installation on personal physical computer or network (Marston et al, 2011). It also refers to the delivery of computing services like servers, storage, databases, networking, software and analytics over the Internet. According to a recent report by Gartner (2017), India's spending on IT will be 87.1billion dollars in the year 2018 with a 9.2% increment in comparison to the previous year. In the same line, Rao (2018) highlighted that India's spending on public cloud's Infrastructure as a Service (IaaS) and Software as a Service (SaaS) is set to reach $1 billion each. Likewise, Aggarwal (2017) reported that with the increasing growth and usage of Cloud Computing in Indian firms, it is expected to generate over 1.1 million new jobs by 2022. As Cloud Computing Technology (CCT) provides immense IT capability and cost-saving benefits for all types of organizations, its adoption is gaining thrust and rising very fast. Liu et al. (2018) highlighted that cloud infrastructure flexibility and integration are important to improve the firm's agility. According to Riera & Iijima (2019), digital business value can be achieved by using digital technologies like cloud computing and can be measured by the level of achievement that the organization had over the years as per its business objectives. CCT allows data to be stored on many remote virtual servers and can be hosted by a third-party service provider. Dropbox is an example of huge file storage on the cloud that can be accessed from any device through the Internet. According to Thakurta et al. (2018), currently many organizations have already relocated from on-premise systems to cloud computing service because it provides higher performance, better functionality, reduce operating costs and improved usability.
The four deployment models of cloud computing are public, private, hybrid and community cloud (Mell & Grance, 2011). Public cloud services are available publicly through the Internet. Gmail, Hotmail, Google docs are examples of this model. Private cloud services can be accessed under the control of the IT department of a company and only authorized users can be accessed through a secure VPN connection such as Microsoft Exchange. Hybrid cloud is the blend of the public and private cloud where user can store confidential data on private cloud whereas general data can be stored on the public cloud. In a community cloud, two or more organizations set up their own private cloud data center that has common interests and for their sharing purpose (Gupta et al, 2013). Mell & Grance (2011) highlighted that the three most popular service models of cloud computing are Software as a Service (SaaS), Platform as a Service (PaaS) and Infrastructure as a Service (IaaS). IaaS is the lowest-level cloud service model that provides pre-configured hardware resources to users through a virtual interface such as Amazon's EC2, IBM's SoftLayer, and Google's Compute Engine. PaaS provides a platform to users for the development and managing the applications. It includes operating systems and a set of development tools like Google's App Engine, IBM's BlueMix, and Apache's Stratos. SaaS provides the application over the internet and can be directly used by the end-users, for example, Office365 and Salesforce.
Mell & Grance (2011) reported that the five characteristics of CCT are on-demand self-service, broad network access, resource pooling, rapid elasticity, and measured service. On-demand self-service specifies independent provisioning of resources without human interface with the provider while broad network access deals with the delivery of services over a network (Vouk, 2008; Marston et al, 2011). Resource pooling is providing a group of computing resources like storage, processing, memory, bandwidth, etc. to multiple customers. Rapid elasticity specifies that resources are dynamically scaled up and down with demand and, finally, measured service denotes the spontaneous control and effective use of computing resources on a subscription basis (Leavitt, 2009; Vaquero et al., 2009; Lin & Chen, 2012).
This study focus on identifying the factors that influence behavioral intention to use cloud computing. Past studies (Behrend et al., 2011; Wu et al., 2011; Obeidat & Turgay, 2012; Aharony, 2015; Arpaci, 2017) based on individual adoption of cloud computing only focus on
personal characteristics related factors and cognitive factors of cloud computing adoption. Therefore, this study is highly motivated to include both positive and negative utility factors of behavioral beliefs in addition to cognitive factors in analyzing behavioral intention to use cloud computing.
The objective of this study is to empirically test a research model on behavioral intention to use cloud computing that includes positive and negative behavioral beliefs of the Valence Framework and cognitive factors of the Technology Acceptance Model (TAM). Specifically, this study answers the following research questions (1) influence of cognitive factors like perceived usefulness and perceived ease of use on behavioral intention to use cloud computing; (2) influence of positive utility and negative utility factors of behavioral beliefs on behavioral intention to use cloud computing; (3) Progressive changes of impact of the above factors on behavioral intention to use cloud computing from non-adopter to adopter firms. Therefore, this research intends to contribute to an enhanced theoretical understanding of the factors that influence behavioral intention to use cloud computing for non-adopter firms. This study also captures the differential impact of these factors among adopter and non-adopter firms.
Theoretical background
The Valence Framework of Behavioral Beliefs
The valence framework is a well-grounded consumer decision-making theory founded by Peter & Tarpey (1975), which explains consumer's behavioral intention by considering both positive and negative aspects of behavioral beliefs. The framework includes ‘‘perceived risk'' and "perceived benefit" models in which the perceived risk model assumes that consumer acts to minimize any expected negative utility associated with adoption behavior, while the perceived benefit model focuses on the maximization of expected positive utility of consumer adoption behavior. Besides, Kim et al. (2009) also found that the valence framework is an appropriate model in explaining consumer online shopping behavior. This implies that this framework can be used to analyze the positive and negative impact of any IT on its adoption behavior. Similarly, Lu et al. (2011) adopted the valence framework to study the adoption of online banking to test and confirm its influence on both positive and negative behavioral beliefs. Likewise, Yang et al. (2012) applied valence framework and found that positive beliefs like a relative advantage, compatibility and negative beliefs like perceived risks, perceived fee are all important factors for mobile payment services adoption and use. The valence framework was also integrated with a health belief model to study the adoption of online health information services and found that perceived risk had a significant impact on acceptance (Mou et al., 2015).
Technology Acceptance Model (TAM)
Theory of Reasoned Action (TRA) and Technology Acceptance Model (TAM) have been widely used as the primary theoretical framework for understanding and explaining an individual’s adoption behavior in the field of information technology (Davis et al., 1989; Ajzen, 1991). The original TAM examined the mediating role of perceived usefulness and perceived ease of use and their relationships between external variables and the probability of information systems adoption (Wu & Wang, 2005). For a long time, TAM proved to be a useful theoretical model in helping to understand and explain usage behavior in information systems implementation (Legris et al., 2003). Later, Venkatesh & Davis (2000) proposed TAM2 by including subjective norms as a determinant of perceived usefulness in the original TAM model. Legris et al. (2003) declared that the TAM and TAM2 explained only 40% of the variance in use and concluded that TAM should be integrated with other models to increase its predictive capacity. Corresponding to this criticism, a unified theory of acceptance and use of technology
model (UTAUT) was developed by Venkatesh et al. (2003) based on a thorough review of user adoption literature and eight prominent models including TRA, Theory of Planned Behavior (TPB), TAM and the innovation diffusion theory (DOI). Later TAM3 was developed by Venkatesh & Bala (2008) with determinants of both perceived usefulness and perceived ease of use and they also recommended future research directions on interventions based on these factors.
Earlier studies had investigated different models to study cloud computing adoption at the individual level. In the same direction of cloud computing SaaS adoption, Benlian & Hess (2011) analyzed the risks and opportunities in adopter and non-adopter firms from the perspective of IT executives. By using the TRA model, they found that cost advantages and security threats were the dominant factors for both adopter and non-adopter forms while economic risks were found as a critical risk factor for non-adopter firms. Likewise, Wu (2011) used the TAM-diffusion model to examine the important factors influencing the adoption of SaaS and found that perceived usefulness and perceived ease of use are two key factors of behavioral intention. This implies that perceived ease of use and perceived usefulness are two important factors that influence behavioral intention to use cloud computing. Similarly, Behrend et al. (2011) used TAM3 to examine the factors that influence cloud computing adoption in urban and rural community colleges of higher education and found that usage of cloud computing was influenced by perceived ease of use. With the help of the integration of the duo-theme decision-making trial and evaluation laboratory (DEMATEL), with TAM, Wu et al. (2013) found that intervention activities, such as training, organizational support and peers’ support, etc. are important to increase the usage of cloud computing.
To check the adoption of cloud computing, Obeidat & Turgay (2013) integrated TAM and Social Exchange Theory model and found that cloud computing adoption takes place when cloud advantages outweigh the disadvantages of cloud computing adoption. Using TAM, Aharony (2015) examined the factors that might affect librarians and information specialists in making cloud computing adoption decisions in their firms. His findings showed that high scores in PEOU and personal innovativeness were due to high scores in the adoption intention of cloud computing. Likewise, TAM was applied and validated by Lal & Bharadwaj (2016) among IT executives and found that cloud computing adoption decision is impacted by the factors like easy to use interface, experience, and cloud service provider expertise and top management support. Similarly, extended TAM was used by Sharma et al. (2016) to assess the factors that affect cloud computing adoption by IT professionals and found that computer self-efficacy, perceived usefulness, trust, perceived ease of use, and job opportunity are the dominant factors of cloud computing adoption. Likewise, TAM was applied by Arpaci (2017) to inspect the antecedents and consequences of cloud computing adoption in education and found that training and education were impacted by perceived ease of use. In the same way, TAM-diffusion theory model was also applied by Asadi et al. (2017) to investigate the determinants of cloud computing adoption in the banking sector from the perspective of a customer and found that trust, cost, security, and privacy constructs had a strong positive effect on perceived usefulness, perceived ease of use, and trust. Their findings also showed the significant effects of perceived usefulness, perceived ease of use, cost, attitude towards cloud and trust on behavioral intention to adopt cloud computing. Kumar et al. (2017) applied an integrated model founded on Technology Acceptance Model (TAM), Diffusion of Innovation (DOI) and Technology-Organization-Environment (TOE) to examine cloud computing adoption by SMEs in India. They found that relative advantage, security concerns, top management support, external pressure, and service providers’ support are the dominant factors in this regard. Li et al. (2019) evaluated the factors the cloud service transformation intentions in SMEs by integrating the two aspects of benefits and trust in analyzing cloud service transformation in SMEs. The study found that both trust and benefit significantly affect SMEs’ transformation toward cloud computing services. Appendix A. shows the related literature review of cloud computing adoption.
Conceptual model and research hypotheses
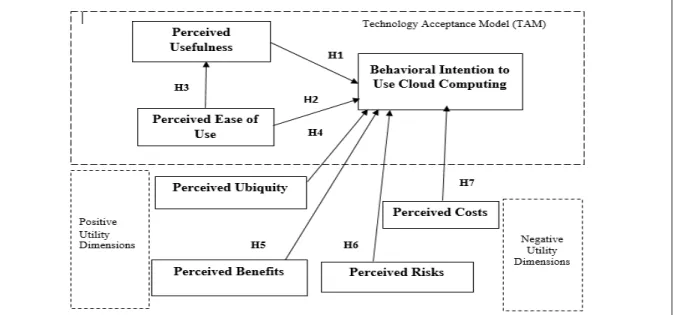
The model focuses on the extension of TAM by incorporating the valance framework of behavioral beliefs. Valence framework considers both positive and negative aspects of behavioral beliefs. Perceived ubiquity and perceived benefits are considered as positive beliefs whereas perceived risks and perceived costs as negative beliefs in the valence framework. Figure 1 demonstrates the conceptual model and related hypotheses that the current study intends to examine.
Figure 1 - Research Model
TAM proposes that behavioral intention to use technology depends on two beliefs - Perceived Usefulness and Perceived Ease of Use (Venkatesh & Bala 2008). Davis et al (1989) found a direct effect of Perceived Usefulness on adoption intention and also both a direct and indirect effect of perceived ease of use on intention through perceived usefulness. In the case of cloud services, Senk (2013) and Liu et al. (2018) reported cloud services can improve the business efficiency, agility, performance as well as productivity, thus perceived usefulness is an influential factor of its intention to use in the organization. Behrend et al. (2011) demonstrated in their study that ease of use of cloud services leads to its intention to use in the organization. Given the above, the following two hypotheses have been proposed to show the influences of perceived usefulness and perceived ease of use on behavioral intention to use cloud computing.
H1: Perceived Usefulness positively influences behavioral intention to use cloud computing. H2: Perceived Ease of Use positively influences behavioral intention to use cloud computing. According to Davis (1989), perceived ease of use has a significant direct influence on perceived usefulness. When two systems are performing the same set of functions, the user should opt for the system that is easier to operate and more useful. Therefore, perceived ease of use may have a positive influence on perceived usefulness in cloud computing adoption. H3: Perceived Ease of Use positively influences Perceived Usefulness.
The positive utility dimension in the valence framework measures the extent of relative benefit that users may derive by adopting services. The availability and accessibility of cloud
computing services can be possible anywhere and anytime and this particular characteristic represents the ubiquitous nature of cloud computing. The ubiquitous nature of cloud computing helps the user to access the information or applications through their own device irrespective of their locations. The perceived benefits of cloud computing services are related to operational benefits that are expected by a firm from cloud computing adoption. The benefits include mobility, efficient reduction of costs, easy installation and maintenance and easy analysis of data over the internet (Armbrust et al., 2010; Hsu et al., 2014). According to Ross & Blumenstein (2013), perceived benefits of cloud computing represent cost reduction, scalability, portability, as well as reduced software and hardware obsolescence According to Hsu et al. (2014), perceived benefits affect the cloud computing adoption in the firms. Therefore perceived ubiquity and perceived benefits are considered as the positive utility dimensions in the study and may have a positive effect on behavioral intention to use cloud computing.
H4: Perceived Ubiquity positively influences behavioral intention to use cloud computing. H5: Perceived Benefits positively influence behavioral intention to use cloud computing. The negative utility dimension of the traditional valence framework is associated with its adoption behavior and is reflected through perceived risks and perceived costs. Prior studies have indicated that perceived risk and perceived fee are the two major factors for consumers' resistance to the finance-related mobile services (Luarn & Lin, 2005). In the present study, the non-monetary expenses are measured based on perceived risk, while the monetary expenses are assessed based on perceived costs. The implementation of cloud computing involves various investments to procure hardware, software, and networking. Hence, costs will be a deciding factor to go for cloud computing adoption and it is hypothesized that there is a negative influence of perceived costs on behavioral intention to use cloud computing. Ross & Blumenstein (2013) highlighted that the cloud raises several apprehensions about security and privacy in storing data. Security, privacy, and data integrity are the concerns that make firms cautious in adopting cloud computing technology (Truong, 2009). Therefore perceived costs and perceived risks may have a negative effect on behavioral intention to use cloud computing.
H6: Perceived Risks negatively influence behavioral intention to use cloud computing H7: Perceived Costs negatively influence behavioral intention to use cloud computing.
Research Methodology
Data Collection and Sample
A quantitative research approach, using a questionnaire was adopted for data collection. The study targeted senior managers (CIO, IT manager and other senior staff) of firms as a sample population, who are responsible for making IT decisions in the organizations and must have at least two years of experience in cloud computing. The respondents are selected from the database of a project consultancy company, NIIR (National Institute of Industrial Research), which includes 7448 of SMEs and large firms of India. The firms belong to the sectors of IT, service, manufacturing, finance, and telecommunication, which have high cloud computing adoption rates as per CIO report (2010). The locations of the companies are Hyderabad, Bangalore, Mumbai, Chennai, and Delhi. Simple random sampling was performed to determine samples for this study. The simple random sampling method is a type of probability sampling technique where the selection of items entirely depends on chance. The sample size of 1000 respondents was selected for the survey. According to Dillman's (1999), questionnaires must send out to the respondents after the first-round contact through telephone to confirm their willingness to participate in the survey.
Senior managers were also asked about their experience in cloud computing and the duration of using cloud computing in their firms. Then finally, the questionnaires were sent to these managers through email or google form link. The data collection process lasted for approximately eight months, starting on December 17th, 2017 until September 14th, 2018. 490 responses were received who filled out the questionnaires, but only 458 (45.8%) valid respondents which become the final sample size for data analysis. Among 458 respondents, 239 respondents belong to the adopter and the other 219 from non-adopter firms. So data analysis was done separately for both samples of 239 adopter firms and 219 non-adopter firms. 84.4% and 85.5% of respondents are male in the case of adopter sand non-adopter of cloud computing respectively. Most of the respondents were between the age group of 25-30 years in both the samples. Likewise, most of the respondents have 5-10 years of experience in the area of cloud computing. Both adopter and non-adopter firms are mostly large-sized firms. The demographic information of the respondents is shown in Table 1. Table 2 shows the demographic analysis of adopter and non-adopter firms in terms of the type of industry, size and organizational structure of firms.
Instrument Development
All items in the questionnaire were adapted from pre-validated studies in the field of information systems. The scale items are converted to cloud computing context. Question items required to identify the relative contribution of all factors in the research model towards behavioral intention to use cloud computing. The final questionnaire contained total 33 questions on seven different constructs of the proposed research model, including perceived usefulness (5 items), perceived ease of use (6 item), perceived ubiquity (3 items), perceived benefits (6 items), perceived costs (3 items), perceived risks (7 items), and behavioral intention to use cloud computing (3 items). A pilot study was conducted among researchers and experts to make sure that the questionnaire is suitable for the research context. In this phase, the questionnaire was reviewed first by three IS professional who has more than ten years' of experience in cloud computing before the distribution. The questionnaire is then customized based on their suggestions. Each item of the construct was measured using a 5-point Likert scale, with values ranging between 1 (strongly disagree) and 5 (strongly agree). A questionnaire link was created with the help of google form. Google form is an online service provided by Google and is relatively effective in terms of time, effort, and cost. This link was sent to the email-id of the respondents.
Five items of perceived usefulness such as usefulness, efficiency, effectiveness, performance, and productivity have adopted from Davis et al. (1989) and Venkatesh & Davis (2000). Likewise, six items of perceived ease of use such as easy to learn, require less mental effort, clear and understandable, flexible, easy to become skillful and simple to use have adopted from Davis et al. (1989) and Venkatesh & Davis (2000). Three items of behavioral intention such as "I will use cloud computing in the next 6 months", "I expect to be a regular user of cloud computing" and "I intend to use cloud computing in the next 6 months" have adopted from the scale of Davis et al. (1989) and Venkatesh & Davis (2000). All the above scales are related to other technologies; hence the scale items are modified in the cloud computing context.
For the construct, perceived ubiquity, the three items have adopted from Kimand Garrison (2009) such as "providing communication and network accessibility", "anytime-and-anywhere communication and connectivity", and "using technology for personal and business purposes". Likewise, for the construct perceived benefits, six items of customization, easily analyze data on the internet, reduce deployment time, reduce IT costs, reduce IT employees costs and ubiquitous access have adopted from Hsu et al. (2014). Similarly, seven items of confidentiality, incompatibility, insufficient service quality guarantee, Internet bottleneck, service outages, underperformance and vendor lock-in, for the construct perceived risks, have adopted from the scale of Hsu et al. (2014). For the construct perceived costs, items such as set-up cost,
maintenance cost, and training cost have adopted from the scale of Premkumar & Roberts (1999) and Kuan & Chau (2001). Appendix B. presents a summary of these items and related references.
Data Analysis and Results
Exploratory Factor Analysis (EFA) and Structural Equation Modeling (SEM) were used for data analysis. Under SEM, confirmatory factor analysis (CFA) and Path Analysis were done. According to Ruscio & Roche (2012), it is best to conduct EFA before proceeding to CFA in the case of very little a priori knowledge of developed structural. Therefore, EFA was performed to test the basic structure of the factor. Then construct reliability, construct validity and goodness of model fit were checked through CFA. In the end, to examine the proposed hypotheses and structural model fit, path analysis was performed.
Exploratory Factor Analysis (EFA) was performed to identify the set of items that represent the dimensions of each of the larger constructs of the measurement model. Data analysis was conducted by structured equation modeling using AMOS 20 to examine the measurement and structural model in the proposed framework. Confirmatory Factor Analysis (CFA) was performed by following the two-step approach recommended by Anderson & Gerbing (1988), firstly the measurement model was examined and construct reliability and validity were tested. Then, the structural model was examined, and the hypotheses were tested.
Descriptive Statistics
Table 1 presents the demographic statistics for both adopters and non-adopter. The statistics showed that 84.4% and 85.5% of respondents are male in the case of adopter sand non-adopter of cloud computing respectively. Most of the respondents were between the age of 25 and 30 in both the samples. Hence the two samples had a similar distribution in terms of gender and age. The distribution in terms of the overall experience was different in the two samples. Most of the respondents have 5-10 years of experience in the area of cloud computing in the case of the adopter (62.3%) and non-adopter firms (45.6%). In the adopters' sample, 4.2% of respondents had between 10 to 15 years of experience whereas in the non-adopter sample the percentage of respondents of this category was 18.7%. Similarly, in the adopters' sample, 6.3% of respondents had more than 15 years of experience whereas in the non-adopter sample the percentage of respondents of this category was 11.8%.
Table 1 - Profile of Respondents Age
Firms
Adopter (239) Non-adopter (219) Adopter and Non-adopter
25-30 132 92 224 30-40 77 75 152 40-50 23 39 62 >50 7 13 20 Gender Male 201 194 395 Female 38 25 63 Overall Experience 2-5 years 65 52 117 5-10 years 149 100 249 10-15 years 15 41 56 >15 years 10 26 36
In the case of respondents profile based on industry as shown in Table 2, most of the responses received from the IT industry i.e. 57.7% from adopters and 42% from non-adopters. The next larger responses received from the service sector i.e. 24.2% from adopter firms and 29.7% from non-adopter firms. Most of the adopters (74.8%) and non-adopters (50.2%) firms are large-sized firms. Most of the small-sized firms belong to non-adopters i.e. 33.7% whereas adopter firms consist of 22.2 % of small-sized firms. Similarly, most of the non-adopters (15.9) firms are medium-sized whereas only 2.9% of medium-sized are adopter firms. In the case of organizational structure, Most of the non-adopter firms (45.6%) have simple organization structure and most of the adopter firms (51.4%) have a hierarchical structure.
Table 2 - Respondents Profile based on Industry Type of industry
Firms
Adopter (239) Non-adopter (219) Adopter and non-adopter
IT 138 92 230 Services 58 65 123 Finance 19 18 37 Manufacturing 12 19 31 Others (Retail, Telecommunication, and Pharmaceuticals) 12 25 37 Firm Size Small 53 74 127 Medium 7 35 42 Large 179 110 289 Organization Structure Simple 83 100 183 Hierarchical 123 72 195 Functional 9 26 35
Others (Divisional and
Matrix) 24 21 45
Reliability and Validity
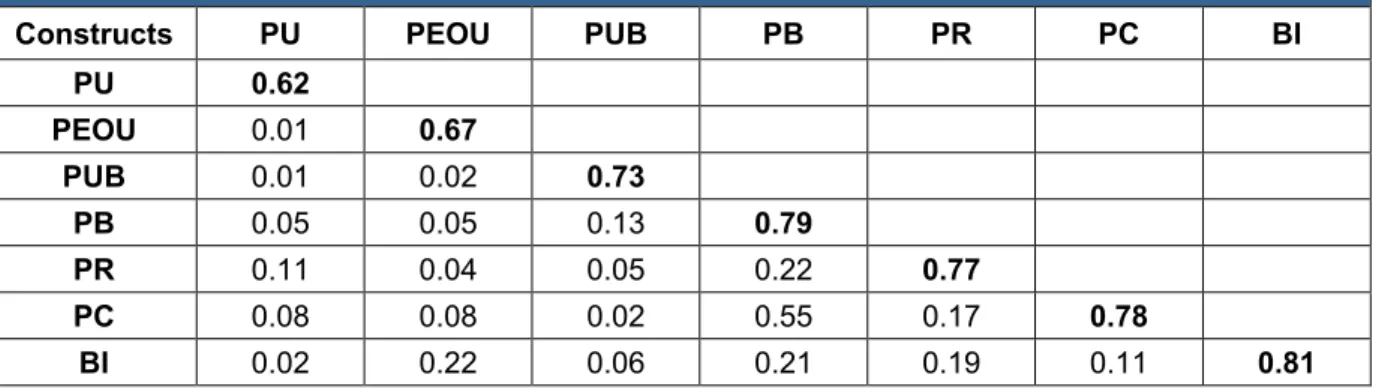
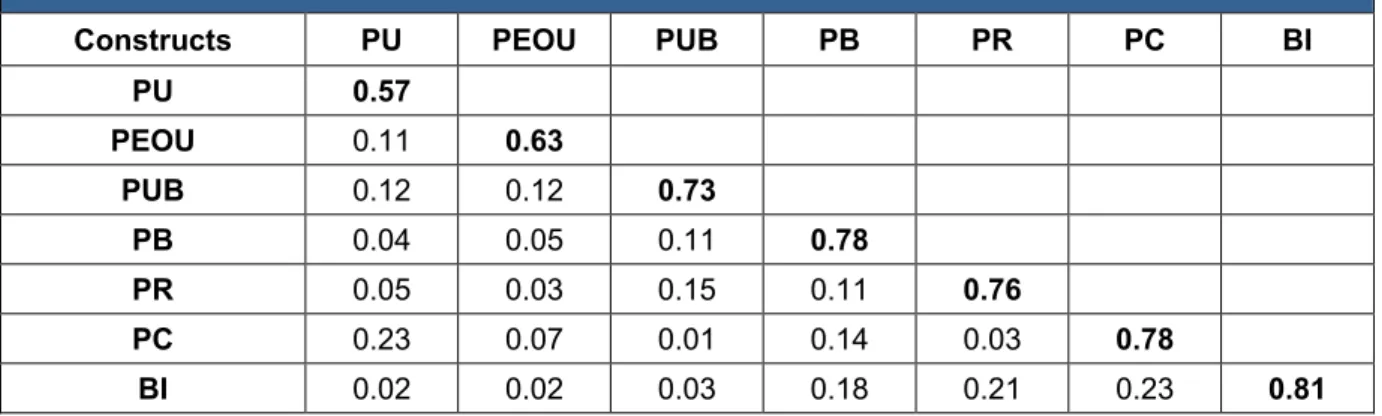
Both EFA and CFA were performed to assess the reliability and validity of the scales. The Kaiser Meyer Olkin (KMO) measure of sampling adequacy for adopters sample and non-adopters sample was 0.838 and 0.788, respectively, indicating the appropriateness of using the principal components factor analysis on the data. Bartlett's test of sphericity also produced a significant test result by rejecting the null hypothesis. Each item has a greater loading on its corresponding factor than the cross-loadings on other factors, showing a clear loading matrix. Construct reliability and validity were further examined by confirmatory factor analysis. As shown in Table 3, the Cronbach's α (alpha) were all above 0.8, indicating good reliabilities of the scales (Nunnally & Bernstein, 1978). The average variance extracted (AVE) for each construct was above 0.6, representing good convergent validities (Baggozi & Yi, 1988). Discriminant validity was examined by comparing the square root of the AVE of each construct and its correlation coefficients with other constructs. As shown in Table 4 and Table 5, for both datasets, the square roots of the AVEs are larger than all corresponding correlation coefficients, suggesting good discriminant validities of the scales (Hair et al., 2010).
Table 3 - Scale properties
Variable Item Standard Adopters Non-Adopters
Loading Cronbach’s α AVE Standard Loading Cronbach’s α AVE
PU PU1 0.72 0.89 0.62 0.68 0.88 0.57 PU2 0.75 0.72 PU3 0.79 0.75 PU4 0.81 0.78 PU5 0.87 0.83 PEOU PEOU1 0.74 0.92 0.67 0.74 0.92 0.66 PEOU2 0.79 0.79 PEOU3 0.76 0.76 PEOU4 0.84 0.84 PEOU5 0.83 0.83 PEOU6 0.90 0.89 PUB PUB1 0.81 0.89 0.73 0.80 0.89 0.73 PUB2 0.87 0.86 PUB3 0.89 0.89 PB PB1 0.80 0.96 0.79 0.79 0.96 0.78 PB2 0.85 0.85 PB3 0.88 0.88 PB4 0.91 0.91 PB5 0.93 0.92 PB6 0.93 0.93 PR PR1 0.79 0.96 0.77 0.79 0.96 0.76 PR2 0.82 0.82 PR3 0.84 0.84 PR4 0.89 0.88 PR5 0.91 0.91 PR6 0.92 0.92 PR7 0.95 0.93 PC PC1 0.88 0.91 0.78 0.87 0.91 0.78 PC2 0.89 0.88 PC3 0.89 0.89 BI BI1 0.84 0.93 0.81 0.84 0.93 0.81 BI2 0.91 0.91 BI3 0.95 0.94
To assess the potential common method bias of our self-reported data, Harman's one-factor test as proposed by Podsakoff & Organ (1986),was performed on the constructs and found that seven factors are present and the covariance explained by one factor in non- adopters' dataset and adopters' dataset is 14.52% and 15.49% respectively. This specifies the datasets used in this study are free from the problem of common method bias.
Table 4 - Factor correlation coefficients and square roots of the AVE (Adopters Firms)
Constructs PU PEOU PUB PB PR PC BI
PU 0.62 PEOU 0.01 0.67 PUB 0.01 0.02 0.73 PB 0.05 0.05 0.13 0.79 PR 0.11 0.04 0.05 0.22 0.77 PC 0.08 0.08 0.02 0.55 0.17 0.78 BI 0.02 0.22 0.06 0.21 0.19 0.11 0.81
Table 5 - Factor correlation coefficients and square roots of the AVE (Non-adopters)
Constructs PU PEOU PUB PB PR PC BI
PU 0.57 PEOU 0.11 0.63 PUB 0.12 0.12 0.73 PB 0.04 0.05 0.11 0.78 PR 0.05 0.03 0.15 0.11 0.76 PC 0.23 0.07 0.01 0.14 0.03 0.78 BI 0.02 0.02 0.03 0.18 0.21 0.23 0.81 The actual and recommended values of the model fit indices are listed in Table 6. Except for GFI and NFI in non-adopter's dataset were slightly below the recommended values, the actual values of all other fit indices were better than the recommended value of 0.90 or above, which demonstrate a good fit between the model and data (Gefen et al., 2000). This study derived RMSEA as 0.047 for adopter firms and 0.053 for non-adopter firms, which is in good agreement with the ranges of values reported by Hair et al. (2010) and Byrne (2001).
Table 6 - Fit indices and recommended values
Fit index χ2/df RMSEA GFI CFI NFI NNFI
Recommended
value <3 <0.08 >0.90 >0.90 >0.90 >0.90 Adopters value 2.25 0.047 0.932 0.927 0.951 0.967
Non Adopters
value 1.69 0.053 0.886 0.918 0.898 0.954
Notes: RMSEA, root mean square error of approximation; GFI, goodness of fit index; CFI, comparative fit index; NFI, normed fit index; NNFI, non-normed fit index.
Results
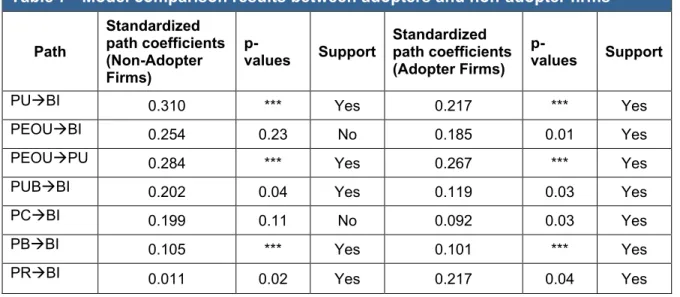
The sample size of adopters and non-adopter of cloud computing are 239 and 219, respectively. Therefore, the sample sizes are large enough for PLS. Path analysis was performed using partial least squares (PLS) to test the consistency of the results across different statistical methods. The measurement model was converted to a structural model to test the proposed hypotheses. The simplified structural models are shown in Figure 2 and Figure 3 for the adopter and non-adopter firms. The hypotheses proposed were tested using standardized regression weight estimates and p-values, as shown in Table 7. In terms of behavioral intention to use cloud computing, the positive effects of perceived usefulness (Hypothesis 1) were supported by both adopter and non-adopter firms. The positive effect of perceived ease of use (Hypothesis 2) on behavioral intention was supported in the case of non-adopter firms but not for adopter firms. The positive effects of perceived ubiquity (Hypothesis 4) and perceived benefits (Hypothesis 6) on behavioral intention were supported in the case of both adopter and non-adopter firms. The negative effect of perceived risk (Hypothesis 7) on behavioral intention was also found to be significant for both adopter and non-adopter firms. The negative effect of perceived costs (Hypothesis 5) on behavioral intention was found significant for a non-adopter firm but was not found significant for adopter firms. The mediating effect of perceived ease of use on perceived usefulness and behavioral intention (Hypothesis 3) was also found significant for both adopter and non-adopter firms.
Figure 2 - Structural Model (Non-Adopter Firms)
Table 7 - Model comparison results between adopters and non-adopter firms Path Standardized path coefficients (Non-Adopter Firms) p-values Support Standardized path coefficients (Adopter Firms) p-values Support PUBI 0.310 *** Yes 0.217 *** Yes PEOUBI 0.254 0.23 No 0.185 0.01 Yes PEOUPU 0.284 *** Yes 0.267 *** Yes PUBBI 0.202 0.04 Yes 0.119 0.03 Yes PCBI 0.199 0.11 No 0.092 0.03 Yes PBBI 0.105 *** Yes 0.101 *** Yes PRBI 0.011 0.02 Yes 0.217 0.04 Yes
Discussion
The present study examined the factors of perceived ease of use, perceived usefulness, perceived ubiquity, perceived benefits, perceived costs and perceived risks in determining behavioral intention to use cloud computing for the adopter and non-adopter firms. The following findings emerge from our analysis. For adopters, perceived usefulness, perceived ease of use, perceived ubiquity, perceived benefits, and perceived risks are found to have a significant and direct influence on behavioral intention to use cloud computing. For non-adopters, perceived usefulness, perceived ubiquity, perceived benefits, perceived costs, and perceived risks are found to have a significant and direct influence on behavioral intention to use cloud computing.
The results of this study show that costs related to implementing cloud computing such as setup, maintenance, and training costs do not influence behavioral intention for adopter firms but it influences behavioral intention to use cloud computing for non-adopter firms. The findings coincide with the findings of Benlian & Hess (2011)that economic factor like costs is the most important factor for non-adopter firms of cloud computing as adopter firms satisfied with basic cloud computing economics. The relationship between perceived ease of use and the behavioral intention was found insignificant for adopter firms rather than non-adopter firms. This result is in good agreement with the findings of Venkatesh & Davis (2000) and Venkatesh & Bala (2008) that the influence of perceived ease of use on an intention to use become weakened over time once the user gets accustomed with the technology. The negative effect of perceived risks on both adopter and non-adopter firms was found significant in the study. This result is coinciding with the finding of Benlian & Hess (2011) that security threats of cloud computing were the dominant factors for both adopter and non-adopter forms. Perceived Ubiquity was found significant for both adopter and non-adopter firms as reported by Park & Ryoo (2013) and Hsu et al. (2014) that the main characteristics of cloud computing are omnipresence or ubiquitous access. Perceived Usefulness and Perceived Benefits were found significant for both adopter and non-adopter firms. This means that cloud providers should encourage more organizations to adopt and use cloud computing, by providing cloud services based on usefulness and benefits. In other words, cloud services are useful for an individual to carry out the task more quickly at the same time that it enhances customization and provide benefits like easy data analysis on Internet, reduce deployment time, reduce IT infrastructure costs and also reduce IT employee's costs.
A comparison testing was also performed by examining the difference in the strength of path coefficients between adopters and non-adopters as shown in Table 8. The table shows that
the negative effect of perceived risk on behavioral intention is stronger for non-adopters than adopter firms. This result coincides with the findings of O'cass & Fenech (2003) that the user's perception of risk with the technology decreases over time. The table also showed that the positive effects of perceived usefulness, perceived ubiquity, and perceived benefits are stronger for adopter firms than non-adopters firms. The results are coinciding with the findings of Kwak et al. (2002) and Ristola (2010) that the adoption of technology is influenced by familiarity with its benefits and usefulness. It can be observed from table 8 that the impact of perceived ease of use on perceived usefulness was found stronger in the case of adopter firms. This finding coincides with the finding of Venkatesh & Davis (2000) that with increasing experience, the impact of perceived ease of use on perceived usefulness will be stronger because users find the technology more useful, once he or she becomes contented with the usage of the technology. Thus, the result supports Hypothesis 3.
Conclusions, Implications, and Limitations
This study covers several vital inferences for managers and the organization to focus on particular factors like perceived usefulness, perceived costs, perceived risks and perceived benefits that affect the successful adoption of cloud computing. Since in this study, data was collected from senior managers of the firm, the empirical analysis of data also gives several insights into the contribution and significance of these factors. The managers can examine advantages, disadvantages as well as business impacts of cloud computing adoption. Since perceived risks were found to have a negative influence on behavioral intention to use cloud computing for the adopter and non-adopter firms, this study provides an important managerial implication that cloud providers should give assurance of data security and privacy in a cloud computing environment. Companies should evaluate potential risks and qualitative benefits of technology to achieve an understandable business rationale (Kürschner et al., 2010). Therefore, cloud vendors should come up with promising risk-mitigation strategies by including mandatory security standards e.g., data encryption technologies and virtual private networks with cloud service to enhance its adoption in the organization.
The contributions of this study are that it provides all-inclusive insight into the decision making process of cloud computing adoption. This study also provides managers' practical understandings for cloud computing adoption during each phase of the adoption process. It contributes to the understanding of progressive changes in the impact of behavioral beliefs and cognitive factors on behavioral intention to use cloud computing in adopter and non-adopter firms. This is one of the first studies that examine the adoption of cloud computing using a combination of valence framework and technology acceptance model. Also, this study is first of its kind that identifies distinguishing factors related to the behavioral intention to use cloud computing from adopters to non-adopters.
This study has limitations in some ways. Firstly, a survey was done, covering a few Indian metropolitan cities like Hyderabad, Bangalore, Chennai, Mumbai, and Delhi that might not a true representation of the suitable population of India. Hence, future research may be focused to increase the sample size by covering all the metropolitan cities of India proportionally. Another limitation is there is no inclusion of control variables like firm size, organizational structure, and industry type and moderators such as age, gender, and experience in this study, which can make the model more robust.
References
A Vouk, M. (2008). Cloud computing–issues, research and implementations. Journal of computing and information technology, 16(4), 235-246.
Adams, D. A., Nelson, R. R., & Todd, P. A. (1992). Perceived usefulness, ease of use, and usage of information technology: a replication. MIS quarterly, 16(2), 227-247.
Adjei, J. K. (2015). Explaining the role of trust in cloud computing services. info, 17(1), 54-67. Aharony, N. (2015). An exploratory study on factors affecting the adoption of cloud computing
by information professionals. The Electronic Library, 33(2), 308-323.
Ajzen, I. (1991). The theory of planned behavior. Organizational behavior and human decision processes, 50(2), 179-211.
Alkhater, N., Walters, R., & Wills, G. (2018). An empirical study of factors influencing cloud adoption among private sector organisations. Telematics and Informatics, 35(1), 38-54.
Alshamaila, Y., Papagiannidis, S., & Li, F. (2013). Cloud computing adoption by SMEs in the north east of England: A multi-perspective framework. Journal of Enterprise Information Management, 26(3), 250-275.
Anderson, J. C., & Gerbing, D. W. (1988). Structural equation modeling in practice: A review and recommended two-step approach. Psychological bulletin, 103(3), 411.
Armbrust, M., Fox, A., Griffith, R., Joseph, A. D., Katz, R., Konwinski, A. & Zaharia, M. (2010). “A view of cloud computing”. Communications of the ACM, 53(4), 50-58.
Arpaci, I. (2017). Antecedents and consequences of cloud computing adoption in education to achieve knowledge management. Computers in Human Behavior.
Asadi, S., Nilashi, M., Husin, A. R. C., & Yadegaridehkordi, E. (2017). Customers perspectives on adoption of cloud computing in banking sector. Information Technology and Management, 18(4), 305-330.
Bagozzi, R. P., Yi, Y. Phillips, L.W. (1991). Assessing construct validity in organizational research. AdminSciQuarts, 36(3), 421-430.
Behrend, T. S., Wiebe, E. N., London, J. E., & Johnson, E. C. (2011). Cloud computing adoption and usage in community colleges. Behaviour and Information Technology, 30(2), 231-240.
Benlian, A., & Hess, T. (2011). Opportunities and risks of software-as-a-service: Findings from a survey of IT executives. Decision Support Systems, 52(1), 232-246.
Byrne, B.M. (2001). Structural equation modeling with AMOS, EQS and LISREL: Comparative approaches to testing for the factorial validity of a measuring instrument. Int. J. Test., 55-86.
CIO Report (2010). Cloud computing in India: a CIO research center report. available at: http:// cioresearchcenter.com
Davis, F. D. (1989). Perceived usefulness, perceived ease of use, and user acceptance of information technology. MIS quarterly, 319-340.
Fishbein, M., & Ajzen I. (1975). Belief, Attitude, Intention and Behavior: An Introduction to Theory and Research. Addison-Wesley, Reading, MA.
Fornell, C. & Larcker, D. F. (1981). Evaluating structural equation models with unobservable variables and measurement error. J Marketing Res, 18(1), 39–47.
Gangwar, H., Date, H., & Ramaswamy, R. (2015). Understanding determinants of cloud computing adoption using an integrated TAM-TOE model. Journal of Enterprise Information Management, 28(1), 107-130.
Garrison, G., Wakefield, R. L., & Kim, S. (2015). The effects of IT capabilities and delivery model on cloud computing success and firm performance for cloud supported processes and operations. International Journal of Information Management, 35(4), 377-393.
Gefen, D., Straub, D., & Boudreau, M. C. (2000). Structural equation modeling and regression: Guidelines for research practice. Communications of the association for information systems, 4(1), 7.
Gupta, P., Seetharaman, A., & Raj, J. R. (2013). The usage and adoption of cloud computing by small and medium businesses. International Journal of Information Management, 33(5), 861-874.
Gutierrez, A., Boukrami, E., & Lumsden, R. (2015). Technological, organisational and environmental factors influencing managers’ decision to adopt cloud computing in the UK. Journal of Enterprise Information Management, 28(6), 788-807.
Hair, J. F., Black, W. C., Babin, B. J., & Anderson, R. E. (2010). Multivariate Data Analysis. (7th Edition).NJ: Prentice Hall.
Hassan, H., Nasir, M., Herry, M., Khairudin, N., & Adon, I. (2017). Factors influencing cloud computing adoption in small and medium enterprises. Journal of Information and Communication Technology, 16(1), 21-41.
Hsu, P. F., Ray, S., & Li-Hsieh, Y. Y. (2014). Examining cloud computing adoption intention, pricing mechanism, and deployment model. International Journal of Information Management, 34(4), 474-488.
Kim, D. J., Ferrin, D. L., & Rao, H. R. (2009). Trust and satisfaction, two stepping stones for successful E-Commerce relationships: A longitudinal exploration. Information Systems Research, 20(2), 237-257.
Kuan, K. K., & Chau, P. Y. (2001). A perception-based model for EDI adoption in small businesses using a technology–organization–environment framework. Information and management, 38(8), 507-521.
Kumar, D., Samalia, H. V. & Verma, P. (2017). Factors Influencing Cloud Computing Adoption by Small and Medium-Sized Enterprises (SMEs) In India. Pacific Asia Journal of the Association for Information Systems, 9(3), 25-48.
Kürschner, C., Brintrup, A., Bowman, P., Dubach, E., Thiesse, F. (2010). Implementing RFID in Production Systems: A Case Study from a Confectionery Manufacturer. Pacific Asia Journal of the Association for Information Systems, 2(2), 19-42.
Kwak, H., Fox, R. J., & Zinkhan, G. M. (2002). What products can be successfully promoted and sold via the Internet. Journal of Advertising Research, 42(1), 23-38.
Lal, P., & Bharadwaj, S. S. (2016). Understanding the impact of cloud-based services adoption on organizational flexibility: An exploratory study” Journal of Enterprise Information Management, 29(4), 566-588.
Leavitt, N. (2009). Is cloud computing really ready for prime time? Computer, 42, 15-20. Legris, P., Ingham, J., & Collerette, P. (2003). Why do people use information technology? A
critical review of the technology acceptance model. Information & management, 40(3), 191-204.
Li, M., Yu, Y., Li, X., Zhao, J. L., & Zhao, D. (2019). Determinants of SMEs’ Transformation Toward Cloud Services: Perspectives of Economic and Social Rationalities. Pacific Asia Journal of the Association for Information Systems, 11(1), 65-87.
Lian, J. W., Yen, D. C., & Wang, Y. T. (2014). An exploratory study to understand the critical factors affecting the decision to adopt cloud computing in Taiwan hospital. International Journal of Information Management, 34(1), 28-36.
Lin, A., & Chen, N. C. (2012). Cloud computing as an innovation: Perception, attitude, and adoption. International Journal of Information Management, 32(6), 533-540.
Liu, S., Chan, F. T., Yang, J., & Niu, B. (2018). Understanding the effect of cloud computing on organizational agility: An empirical examination. International Journal of Information Management, 43, 98-111.
Low, C., Chen, Y., & Wu, M. (2011). Understanding the determinants of cloud computing adoption. Industrial Management & Data Systems, 111(7), 1006-1023.
Lu, Y., Cao, Y., Wang, B., & Yang, S. (2011). A study on factors that affect users’ behavioral intention to transfer usage from the offline to the online channel. Computers in Human Behavior, 27, 355-364.
Luarn, P., & Lin, H. H. (2005). Toward an understanding of the behavioral intention to use mobile banking. Computers in Human Behavior, 21(6), 873-891.
Marston, S., Li, Z., Bandyopadhyay, S., Zhang, J., & Ghalsasi, A. (2011). Cloud computing— the business perspective. Decision Support Systems, 51(1), 176-189.
Mell, P., & Grance, T. (2011). The NIST definition of cloud computing.
Mou, J., Shin, D. H., & Cohen, J. (2016). Health beliefs and the valence framework in health information seeking behaviors. Information Technology & People, 29(4), 876-900. Nunnally, J. C., & Bernstein, I. H. (1994). Psychometric theory (3rd ed.). New York:
McGrawHill.
O’cass, A., & Fenech, T. (2003). Web retailing adoption: exploring the nature of internet users Web retailing behavior. Journal of Retailing and Consumer services, 10(2), 81-94. Obeidat, M. A., & Turgay, T. (2012). Empirical Analysis for the Factors Affecting the Adoption
of Cloud Computing Initiatives by Information Technology Executives. Journal of Management Research, 5(1), 152-178.
Oliveira, T., Thomas, M., & Espadanal, M. (2014). Assessing the determinants of cloud computing adoption: An analysis of the manufacturing and services sectors. Information & Management, 51(5), 497-510.
Park, S. C., & Ryoo, S. Y. (2013). An empirical investigation of end-users’ switching toward cloud computing: A two factor theory perspective. Computers in Human Behavior, 29(1), 160-170.
Peter, J. P., & Tarpey Sr, L. X. (1975). A comparative analysis of three consumer decision strategies. Journal of Consumer Research, 2(1), 29-37.
Podsakoff, P. M., & Organ, D. W. (1986). Self-reports in organizational research: Problems and prospects. Journal of Management, 12(4), 531-544.
Premkumar, G., & Roberts, M. (1999). Adoption of new information technologies in rural small businesses. Omega, 27(4), 467-484.
Priyadarshinee, P., Raut, R. D., Jha, M. K., & Kamble, S. S. (2017). A cloud computing adoption in Indian SMEs: Scale development and validation approach. The Journal of High Technology Management Research, 28(2), 221-245.
Raut, R. D., Priyadarshinee, P., Gardas, B. B., & Jha, M. K. (2018). Analyzing the factors influencing cloud computing adoption using three stage hybrid SEM-ANN-ISM (SEANIS) approach. Technological Forecasting and Social Change, 134, 98-123. Raut, R., Priyadarshinee, P., Jha, M., Gardas, B. B., & Kamble, S. (2018). Modeling the
implementation barriers of cloud computing adoption: an interpretive structural modeling. Benchmarking: An International Journal, Accept.
Riera, C., & Iijima, J. (2019). The Role of IT and Organizational Capabilities on Digital Business Value. Pacific Asia Journal of the Association for Information Systems, 11(2), 67-95.
Ristola, J. (2010). Information technology service management for cloud computing. (Doctoral dissertation, M. Sc dissertation, Aalto University School of Science and Technology). Ross, P., & Blumenstein, M. (2013). Cloud computing: the nexus of strategy and
technology. Journal of Business Strategy, 34(4), 39-47.
Sabi, H. M., Uzoka, F. M. E., Langmia, K., & Njeh, F. N. (2016). Conceptualizing a model for adoption of cloud computing in education. International Journal of Information Management, 36(2), 183-191.
Santhosh Rao (2018). Cloud computing: Face and shape in 2018. Retrieved from http://www.computerworld.in.
Senarathna, I., Wilkin, C., Warren, M., Yeoh, W., & Salzman, S. (2018). Factors That Influence Adoption of Cloud Computing: An Empirical Study of Australian SMEs. Australasian Journal of Information Systems, 22, 1-31.
Senk, C. (2013). Adoption of security as a service. Journal of Internet Services and Applications, 4(1), 11.
Sharma, S. K., Al-Badi, A. H., Govindaluri, S. M., & Al-Kharusi, M. H. (2016). Predicting motivators of cloud computing adoption: A developing country perspective. Computers in Human Behavior, 62, 61-69.
Thakurta, R., Urbach, N., & Basu, A. (2018). Understanding Technology Transition at the Individual Level. Pacific Asia Journal of the Association for Information Systems, 10(3), 25-60.
Truong, D. (2009). How cloud computing enhances competitive advantages: A research model for small businesses. The Business Review, Cambridge, 15(1), 59-65.
Tsai, J. M., & Hung, S. W. (2014). A novel model of technology diffusion: System dynamics perspective for cloud computing. Journal of Engineering and Technology Management, 33, 47-62.
Vaquero, L. M., Rodero-Merino, L., Caceres, J., & Lindner, M. (2008). A break in the clouds: towards a cloud definition. ACM SIGCOMM Computer Communication Review, 39(1), 50-55.
Varun Aggarwal (2017). Cloud Computing to help generate 1.1 mn jobs in India by 2022: Study. Retrieved from https://www.thehindubusinessline.com.
Venkatesh, V. (2000). Determinants of perceived ease of use: Integrating control, intrinsic motivation, and emotion into the technology acceptance model. Information systems research, 11(4), 342-365.
Venkatesh, V., & Bala, H. (2008). Technology acceptance model 3 and a research agenda on interventions. Decision sciences, 39(2), 273-315.
Venkatesh, V., & Davis, F. D. (2000). A theoretical extension of the technology acceptance model: Four longitudinal field studies. Management science, 46(2), 186-204.
Wang, W. Y. C., Rashid, A., & Chuang, H. M. (2011). Toward the trend of cloud computing. Journal of Electronic Commerce Research, 12(4), 238-242.
Warshaw, P. R., & Davis, F. D. (1985). Disentangling behavioral intention and behavioral expectation. Journal of Experimental Social Psychology, 21(3), 213-228.
Wu, J. H., & Wang, S. C. (2005). What drives mobile commerce? An empirical evaluation of the revised technology acceptance model. Information & Management, 42(5), 719-729. Wu, W. W. (2011). Developing an explorative model for SaaS adoption. Expert Systems with
Applications, 38(12), 15057-15064.
Wu, W. W., Lan, L. W., & Lee, Y. T. (2013). Factors hindering acceptance of using cloud services in university: a case study. The Electronic Library, 31(1), 84-98.
Yang, S., Lu, Y., Gupta, S., Cao, Y., & Zhang, R. (2012). Mobile payment services adoption across time: An empirical study of the effects of behavioral beliefs, social influences, and personal traits. Computers in Human Behavior, 28(1), 129-142.
Appendix A. Related Literature on Cloud Computing Adoption
Author Factors Country Methodology
1. Li et al. (2019) Perceived benefit, Trust belief, Demand
uncertainty, Information asymmetry, Information security, Vendor scarcity, Vendor scarcity, Cloud service transformation intention Transaction cost theory (TCT) and agency theory models
China Partial least squares (PLS)
2. Liu et al.
(2018) CI flexibility, CI integration, operational agility, partnering agility and customer agility.
Theory of IT infrastructure capability.
China Partial least squares (PLS) based structural equation modeling with Smart PLS 2.0. 3. Alkhater et al.
(2018) Quality of service, Security, Privacy, Trust, Relative advantage, Compatibility, Top management support, Firm size, Technology readiness, Compliance with regulations, Physical location
An integrated
model Saudi Arabia SEM analysis technique
4. Raut et al.
(2018) Lack of security and privacy, Lack of sharing and collaboration, Lack of top management support, Lack of IT supply source, Lack of compatibility, Lack of finance, Lack of IT infrastructure, Lack of confidentiality Lack of integrity, Lack of
operational and technical support, Lack of technology readiness, Lack of IT standards, Lack of global distribution network, Lack of partnerships Literature Survey And Expert Opinions India Interpretive structural modeling (ISM) approach.
5. Raut (2018) Trust (T), management style (MS), technology innovation (TI), risk analysis (RA), and perceived IT security risk (PITR), decrease of internal systems availability (F1) (PITR cluster), utilization of internal resources, assurance of data privacy, innovativeness , and previous experience TOE
framework India A hybrid three-stage Structural Equation Modeling (SEM) - Artificial Neural Network (ANN) - Interpretive Structural Modeling
(ISM) approach
6. Saleem et al.
(2018) Complexity, compatibility, relative advantage, top management support, firm size, technical readiness, competitive pressure, and trading partner pressure, Technological- organizational-environmental (TOE) framework Capital of Jordan- Amman Multiple regression analysis. 7. Senarathna et
al. (2018) Relative advantage, security, privacy, flexibility, leadership awareness, flexibility, slack and
interconnectedness, competitors, market, regulations and service
TOE
Framework Australia Multiple regression methods used for data analysis
8. Kumar et al.
(2017) Perceived usefulness, Perceived ease of use, Relative Advantage, Compatibility, Security and Privacy,
Technology readiness, Top Management Support, Firm Size, External Pressure, Service Provider Support, Adoption Intention An integrated model founded on Technology Acceptance Model (TAM), Diffusion of Innovation (DOI) and Technology- Organization-Environment (TOE) India Structural Equation Modeling 9. Asadi et al.
(2017) Perceived Usefulness, Perceived Ease of Use, Perceived Benefits, Security and Privacy, Social Influence, Attitude towards CC adoption , Trust, Cost TAM-diffusion theory model (TAM-DTM) with the introduction of three new constructs namely trust, cost, and security and privacy.
Malaysia Survey data were analyzed using the partial least squares (PLS) method while SmartPLS was used to test the hypotheses and to validate the proposed model.
10. Arpaci (2017) Continued use intention, attitudes, perceived usefulness and ease of use, knowledge creation and discovery,
knowledge sharing, knowledge storage, knowledge application, innovativeness and training and education
Technology Acceptance Model Turkey Structural equation modeling
11. Priyadarshinee
et al. (2017) Perceived IT security risk, risk analysis, technology innovation, usage of technology, industry usage, trust, management style, cloud computing adoption and business performance
Ranking model India Analytic Hierarchy Process approach, n Exploratory Factor Analysis and Confirmatory Factor Analysis 12. Haslinda
Hassan (2017) Top management support, IT resources, and employee
knowledge, cloud computing adoption
Conceptual
model Malaysia Partial Least Squares (PLS) (via SmartPLS version 2.0 software) 13. Liu et al.
(2016) Cloud infrastructure flexibility (CI flexibility) and cloud infrastructure integration (CI integration), Partnering Agility, Market turbulence, firm performance, business lifecycle Business
lifecycle theory China The theoretical model was tested using PLS analysis.
14. Sabi et al.
(2016) Awareness, Cost, Risk, Relative advantage, Compatibility,
Complexity,
Observability, Trialability, Results demonstrable, Ease of use, Usefulness, National infrastructure, ICT infrastructure, Intent to adopt & use
Integrated model based on Diffusion of Innovation theory and Technology Acceptance Model SubSaharan
Africa Structural equation modelling (SEM) using SmartPLS 15. Lal & Bharadwaj (2016) Perceived Usefulness, Perceived Ease of Use, Relative advantage, Vendor Credibility, Organizational Flexibility, Cloud-based Service model adoption (SaaS, PaaS, IaaS) TOE Framework and TAM India Conceptual paper 16. Sharma et al.
(2016) Perceived Usefulness, Perceived Ease of Use, computer self-efficacy, trust, and job
opportunity, CC adoption
TAM Oman Multiple linear regression (MLR) and neural network (NN) modeling 17. Adjei (2015) Service providers’ ability,
integrity and benevolence
A trust
framework Ghana A combination of interviews and focus group discussions 18. Gangwar et
al. (2015) Relative advantage , Compatibility, Complexity,
Organizational competency, Top management support,
TAM-TOE
framework India Exploratory factor analysis and
confirmatory factor analysis
Training and education, Competitive pressure, Trading partner support, Perceived ease of use, Perceived usefulness, Adoption intention
using SPSS AMOS
19. Aharony
(2015) Personal innovativeness, perceived ease of use, threat and challenge, self-efficacy and
openness to experience, computer use and social media use
Extended TAM Israel Hierarchical regression
20. Gutierrez et
al. (2015) Relative advantage, top management support, competitive pressure, complexity, compatibility, firm size, technology readiness and trading partner pressure, cloud computing adoption TOE UK Principal component analysis and logistic regression. 21. Garrison et al.
(2015) trust, managerial capability, technical capability, Cloud-deployment performance. Resource based View Model structural-equations model using AMOS 7.0 analytical software 22. Tsai & Hung
(2014) Service quality, the degree of maturity of infrastructure, price, the degree of technological maturity, R&D
investment, perceived risk, economic situation, diffusivity of cloud application
framework of system dynamics
Taiwan ANN (Artificial Neural Network)
23. Hsu et al.
(2014) Perceived Benefits , Business Concerns (BC) , IT Capability , External Pressure, Adoption Intention Technology– organization– environment (TOE) framework of innovation diffusion theory Taiwan Structural Equation Modeling 24. Oliveira et al.
(2014) Security concerns, Cost savings, Relative advantage ,Complexity, Compatibility,
Technology readiness, Top management support, Firm size, Competitive pressure, Regulatory support, Cloud computing adoption A research model based on the innovation characteristics from the diffusion of innovation (DOI) theory and the technology- organization-environment (TOE) framework
Portugal Analysis was done using Smart-PLS software
25. Lian et al.
(2014) Data Security, Perceived Technical Competence, Cost, Top Manager Support, And Complexity, CIO Innovativeness, Compatibility, Adequate Resource, And Perceived Industry Pressure, Government Policy, Perceived Technical Competence, Cost, Benefits, Relative Advantage TOE (Technology- Organization-Environment) framework and HOT-fit (Human- Organization-Technology fit) model Taiwan Analysis of Variance (ANOVA) technique 26. Obeidat &
Turgay (2013) Perceived Advantages, Perceived Disadvantages, adoption intention, actual adoption
Applied Social Exchange theory into TAM
US Paired tailed tests and the t-statistic 27. Wu et al.
(2013) Perceived Usefulness, Perceived Ease of Use The duo-theme decision making trial and evaluation laboratory (DEMATEL) with TAM
Taiwan Case study methodology
28. Ross & Blumenstein (2013)
Cloud-based business
strategies Resource view of the firm and transaction Costs economics Australia Qualitative research 29. Alshamaila et
al. (2013) Relative advantage, uncertainty, geo-restriction, compatibility, trialability, size,
topmanagement support, prior experience,
innovativeness, industry, market scope, supplier efforts and
external computing support, competitive pressure
TOE
framework England Qualitative approach in the form of Semi structured interviews
30. Gupta et al.
(2013) Cloud computing usage by SME, ease of use and convenience, security and privacy, reliability, sharing and collaboration, and cost reduction.
Conceptual
Model Singapore and neighboring countries like Malaysia, India PLS (Partial Least Square) technique
31. Park & Ryoo
(2013) Omnipresence, collaboration support, switching enablers, satisfaction with incumbent IT, breath use of incumbent IT, switching inhibitors, social influence, personal innovativeness ,
Two-factor
model Korea PLS (partial least squares) approach
intention to switch towards cloud
32. Lin & Chen
(2012) Relative advantage, compatibility, complexity, observability, and trialability
Diffusion of
Innovation Taiwan Exploratory study which used a survey by interview approach 33. Benlian &
Hess (2011) Cost advantages , Strategic flexibility, Focus on core competencies , Access to specialized resources, Quality improvements, Perceived risks, Perceived opportunities, Performance risk, Economic risk, Strategic risk, Security risk, Managerial risk Theory of Reasoned Action. Germany PLS based structural equation modeling 34. Wu (2011) Perceived usefulness , Perceived ease of use, Behavioral Intention, Attitude towards
Technology, Innovation, Security & Trust, Perceived Benefit and Social Influence
TAM Taiwan PLS path
modeling
35. Behrend et al.
(2011) Usefulness, ease of use, Access to personal copies of software, Reliability, Personal Innovativeness, Anxiety towards technology, Actual use, Intention for future use, future usefulness perceptions
TAM3 Southeastern
USA A path analytic model
36. Low et al.
(2011) Relative advantage, top management support, firm size,
competitive pressure, trading partner pressure and cloud computing adoption
TOE
Framework Taiwan Logistic regression analysis.
37. Truong (2010) Customization, alignment, inter-connectivity, mediators are innovation and collaboration. Moderators include security, intellectual property and reliability, competitive advantage Resource Based View Model Conceptual paper