Jamova cesta 2
1000 Ljubljana, Slovenija
http://www3.fgg.uni-lj.si/
DRUGG
– Digitalni repozitorij UL FGG
http://drugg.fgg.uni-lj.si/
V zbirki je izvirna različica doktorske
disertacije.
Prosimo, da se pri navajanju sklicujete na
bibliografske podatke, kot je navedeno:
University of Ljubljana
Faculty of Civil and Geodetic Engineering
Jamova cesta 2
SI – 1000 Ljubljana, Slovenia
http://www3.fgg.uni-lj.si/en/
DRUGG
– The Digital Repository
http://drugg.fgg.uni-lj.si/
This is an original PDF file of doctoral
thesis.
When citing, please refer as follows:
Cotič, P. 2014. Sinteza večsenzorskih neporušnih preiskav gradbenih konstrukcijskih
elementov z uporabo metod gručenja. Doktorska disertacija. = The synthesis of multisensor
non-destructive testing of civil engineering structural elements with the use of clustering
methods. Doctoral dissertation. Ljubljana, Univerza v Ljubljani, Fakulteta za gradbeništvo in
geodezijo. (Mentor Jagličić, Z., somentor Bosiljkov, V.)
http://drugg.fgg.uni-lj.si
Univerza v Ljubljani Fakulteta za gradbeništvo in geodezijoPATRICIA COTIČ
SINTEZA VEČSENZORSKIH NEPORUŠNIH PREISKAV
GRADBENIH KONSTRUKCIJSKIH ELEMENTOV Z
UPORABO METOD GRUČENJA
Doktorska disertacija štev.: 9/GO
THE SYNTHESIS OF MULTISENSOR NON-DESTRUCTIVE
TESTING OF CIVIL ENGINEERING STRUCTURAL
ELEMENTS WITH THE USE OF CLUSTERING METHODS
Doctoral thesis No.: 9/GO
Soglasje k temi doktorske disertacije je dala Komisija za doktorski študij Univerze v Ljubljani na 28. redni seji, 16. maja 2012.
Za mentorja je bil imenovan izr. prof. dr. Zvonko Jagličić, za somentorja izr. prof. dr. Vlatko Bosiljkov. Odobreno je bilo pisanje disertacije v angleškem jeziku.
• izr. prof. dr. Vlatko Bosiljkov,
• prof. dr. Goran Turk,
• doc. dr. Mitja Lakner,
• prof. dr. Janez Dolinšek, UL FMF
je imenoval Senat Fakultete za gradbeništvo in geodezijo na 29. redni seji, 28. marca 2012.
Poročevalce za oceno doktorske disertacije v sestavi:
• prof. dr. Janez Dolinšek, UL FMF,
• dr. rer. nat. Ernst Niederleithinger, BAM Federal Institute for Materials Research and
Testing, Berlin,
• doc. dr. Mitja Lakner,
• prof. dr. Goran Turk
je imenoval Senat Fakultete za gradbeništvo in geodezijo na 8. redni seji, 26. februarja 2014.
Komisijo za zagovor doktorske disertacije v sestavi:
• prof. dr. Matjaž Mikoš, dekan UL FGG, predsednik,
• izr. prof. dr. Zvonko Jagličić,
• izr. prof. dr. Vlatko Bosiljkov,
• prof. dr. Janez Dolinšek, UL FMF,
• dr. rer. nat. Ernst Niederleithinger, BAM Federal Institute for Materials Research and
Testing, Berlin,
• doc. dr. Mitja Lakner,
• prof. dr. Goran Turk
je imenoval Senat Fakultete za gradbeništvo in geodezijo na 4. dopisni seji, ki je potekala od 24. do 28. aprila 2014.
PodpisanaPatricia COTIČ izjavljam, da sem avtorica doktorske disertacije z naslovom Sin-teza večsenzorskih neporušnih preiskav gradbenih konstrukcijskih elementov z uporabo metod gručenja.
Izjavljam, da je elektronska različica v vsem enaka tiskani različici.
Izjavljam, da dovoljujem objavo elektronske različice v digitalnih repozitorijih.
Ljubljana, 6. maj 2014 . . . .
ERRATA
BIBLIOGRAPHIC-DOCUMENTALISTIC INFORMATION AND ABSTRACT
UDC: 551.509.313:624.012.82:624.012.4:(043.3) Author: Patricia Cotič, B.Sc.
Supervisor: Assoc. prof. Zvonko Jagličić, Ph.D. Co-advisor: Assoc. prof. Vlatko Bosiljkov, Ph.D.
Title: The synthesis of multisensor non-destructive testing of civil engi-neering structural elements with the use of clustering methods Document type: doctoral dissertation
Notes: 100 p., 6 tab., 37 fig., 72 eq., 4 ann., 161 ref.
Keywords: non-destructive testing, civil engineering, ground penetrating radar, infrared thermography, ultrasonic, complex resistivity, concrete, masonry, data fusion, image fusion, clustering methods
Abstract:
In the thesis, clustering-based image fusion of multi-sensor non-destructive (NDT) data is stud-ied. Several hard and fuzzy clustering algorithms are analysed and implemented both at the pixel and feature level fusion. Image fusion of ground penetrating radar (GPR) and infrared thermography (IRT) data is applied on concrete specimens with inbuilt artificial defects, as well as on masonry specimens where defects such as plaster delamination and structural cracking were generated through a shear test. We show that on concrete, the GK clustering algorithm exhibits the best performance since it is not limited to the detection of spherical clusters as are the FCM and PFCM algorithms. We also prove that clustering-based fusion outperforms supervised fusion, especially in situations with very limited knowledge about the material prop-erties and depths of the defects. Complementary use of GPR and IRT on multi-leaf masonry walls enabled the detection of the walls’ morphology, texture, as well as plaster delamination and structural cracking. For improved detection of the latter two, we propose using data fusion at the pixel level for data segmentation. In addition to defect detection, the effect of moisture is analysed on masonry using GPR, ultrasonic and complex resistivity tomographies. Within the thesis, clustering is also successfully applied in a case study where a multi-sensor NDT data set was automatically collected by a self-navigating mobile robot system. Besides, the classification of spectroscopic spatial data from concrete is taken under consideration. In both applications, clustering is used for unsupervised segmentation of data.
BIBLIOGRAFSKO-DOKUMENTACIJSKA STRAN IN IZVLEČEK
UDK: 551.509.313:624.012.82:624.012.4:(043.3) Avtor: Patricia Cotič, univ. dipl. inž. grad. Mentor: izr. prof. dr. Zvonko Jagličić
Somentor: izr. prof. dr. Vlatko Bosiljkov
Naslov: Sinteza večsenzorskih neporušnih preiskav gradbenih konstruk-cijskih elementov z uporabo metod gručenja
Tip dokumenta: doktorska disertacija
Obseg in oprema: 100 str., 6 pregl., 37 sl., 72 en., 4 pril., 161 vir.
Ključne besede: neporušne preiskave, gradbeništvo, georadar, infrardeča termo-grafija, ultrazvočna metoda, kompleksno-uporovna metoda, be-ton, zidovje, združevanje podatkov, združevanje slik, metode gručenja
Izvleček:
V disertaciji predstavimo uporabo postopka za združevanje slik večsenzorskih neporušnih preiskav, ki temelji na metodah gručenja. Za združevanje na nivoju posamezne slikovne točke in z uporabo značilnic analiziramo algoritme trdega in mehkega gručenja. Sintezo georadarskih in termograf-skih podatkov opravimo na rezultatih preiskav betontermograf-skih preizkušancev z vgrajenimi anomalijami ter na rezultatih preiskav zidovja s prisotnimi razpokami in odstopanjem ometa zaradi delovanja strižne obremenitve. Na betonskih preizkušancih najboljše deluje algoritem gručenja GK, ker prepoznava razrede gručenja poljubne oblike in ne le sferične kot algoritma FCM in PFCM. V primerih s še posebno omejenim vedenjem o materialnih lastnostih in globini anomalij združe-vanje z uporabo metod gručenja deluje bolje kot metode nadzorovanega združevanja podatkov. Na večslojnih kamnitih zidovih lahko z uporabo georadarja in infrardeče termografije zaznamo morfologijo in teksturo zidov ter odstopanje ometa in nastanek razpok. Za izboljšano zaznavanje odstopanja ometa in razpok predlagamo združevanje podatkov na nivoju posamezne slikovne točke za segmentacijo slik. Z georadarsko, ultrazvočno in geoelekrično tomografijo opravimo na zidovju tudi raziskavo vpliva stopnje vlažnosti zidovja na občutljivost neporušnih metod. Metode gručenja uporabimo tudi za združevanje neporušnih podatkov navigacijskega večsen-zorskega robotnega sistema. Poleg tega izvedemo tudi klasifikacijo spektroskopskih podatkov betonskih preizkušancev. V obeh primerih metode gručenja uporabimo za segmentacijo po-datkov.
ACKNOWLEDGEMENT
I would like to express my deepest appreciation to my supervisor, Dr. Zvonko Jagličić, and my co-advisor, Dr. Vlatko Bosiljkov, for guidance during my research. Without you, this dissertation would not have materialized. I would particularly like to express my warmest gratitude to Zvonko, who allowed me to spend hours on my Physics study. Without your optimism, encouragement and support both studies would hardly have been completed.
I am deeply grateful to my supervisor at BAM, Dr. Ernst Niederleithinger, who guided me into the world of NDT and cluster analysis and gave me insightful comments and suggestions on my research. Only with your leading charm and the splendid working atmosphere from all the colleagues at BAM, Div. 8.2, the work done was made possible. I would particularly like to thank Dr. Christiane Trela, Dr. Ute Effner and Dr. Sabine Kruschwitz for the extensive support with the work done on the masonry specimen “Asterix”. Special thanks also to Gerd Wilsch for the LIBS data, as well as to Dr. Markus Stoppel for the BetoScan data. The valuable ideas on data fusion from Dr. Parisa Shokouhi are acknowledged. Marco Lange, Sean Smith and Jens Wöstmann were the guys willing to help me at any time. You taught me many tricks in the lab and contributed to almost all the work I did at BAM. You and especially Christian Köpp and Sebastian Goldschmidt, were my best German teachers. I would also like to express my special thanks to Julia Wolf, Maria Grohmann and Sabine Müller for the friendship and the time we spent in Berlin.
I would also like to thank my colleagues at UL FGG. Particularly, Dr. Violeta Bokan-Bosiljkov for her valuable instructions and generous support, as well as Dr. Dejan Kolarič for his contribution on the numerical simulation on heat propagation. Special thanks also to Franci Čepon, Damjan Špeglič and Primož Murn for extensive measurement support. A big thank goes to the colleagues at IMFM, who contributed to my work in a number of ways. Part of the experimental work could not have been done without the cooperation with people from other institutes. I thank Dr. Aleksander Zidanšek (Jožef Stefan International Postgraduate School) and his group for the use of their radar system, as well as Vid Peterman (Modri Planet, d.o.o.) for performing DIC. I sincerely thank Dr. David Antolinc, Petra Štukovnik and Meta Kržan from UL FGG, with whom discussions illuminated my work significantly. You’ve become my dear friends that also contribute to my life experiences.
Finally, I would like to express my warmest gratitude to my parents, who were greatly tolerant
and supportive during these three and half years. Hvala vama! I owe my deepest thank to my
dear sister Karolina, who gave me insightful comments and suggestions on my English writing. Jože, without you, the thesis in this form would not become true. Your love and encouragement
“I think nature’s imagination is so much greater than man’s, she’s never going to let us relax”
TABLE OF CONTENTS
Bibliographic-documentalistic information and abstract . . . III
Bibliografsko-dokumentacijska stran in izvleček . . . V
Acknowledgement . . . VII
1 Introduction 1
1.1 Scientific background and motivation . . . 1
1.2 Aims and scope . . . 4
2 Basic principles of selected NDT methods 7 2.1 Overview of NDT methods used in civil engineering . . . 7
2.2 Ground penetrating radar . . . 8
2.2.1 Electromagnetic properties of building materials and the energy storage-loss mechanisms . . . 9
2.2.2 Wave nature of electromagnetic fields . . . 10
2.2.3 Reflection and refraction of electromagnetic waves . . . 12
2.2.4 Horizontal and vertical resolution . . . 13
2.3 Complex resistivity . . . 13
2.3.1 Electrical polarization . . . 14
2.3.2 Apparent and true resistivities . . . 15
2.3.3 Electrode configurations . . . 16
2.4 Infrared thermography . . . 17
2.4.1 Interaction of incident radiation with matter . . . 19
2.4.2 Thermal emission . . . 19
2.4.3 Conduction heat transfer . . . 21
2.4.4 Quantitative data analysis in pulsed thermography . . . 22
2.4.4.1 Thermal contrast . . . 23
2.4.4.2 Pulsed phase thermography . . . 24
2.5 Ultrasonic . . . 27
2.5.1 Acoustic wave theory . . . 27
2.5.2 Reflection and refraction of acoustic waves . . . 29
2.5.3 Acoustic attenuation and dispersion . . . 29
2.5.4 Piezoelectric transducers . . . 30
3.1 Introduction to data fusion . . . 31
3.2 A data fusion framework . . . 31
3.3 Cluster analysis . . . 34
3.3.1 Distance and similarity . . . 34
3.3.2 Objective function-based clustering – a general note . . . 34
3.3.3 Objective function-based clustering algorithms . . . 36
3.3.3.1 Hard clustering . . . 36
3.3.3.2 Fuzzy clustering . . . 37
3.3.4 Validity measures . . . 41
3.3.5 Objective function-based clustering algorithm scheme . . . 42
4 Non-destructive testing of laboratory concrete specimens with inbuilt de-fects and inclusions 45 4.1 Experimental . . . 45
4.1.1 Specimen description . . . 45
4.1.2 Methods . . . 46
4.2 Results . . . 48
4.2.1 Characterization of defects and inclusions using infrared thermography . . 48
4.2.1.1 Thermal contrast . . . 48
4.2.1.2 Pulsed phase thermography . . . 52
4.2.1.3 Numerical simulation . . . 55
4.2.2 Sensitivity evaluation of ground penetrating radar and infrared thermography 58 5 Conclusion and Outlook 61 Summary 65 6 Razširjeni povzetek v slovenskem jeziku (Extended abstract in Slovene) 67 6.1 Uvod . . . 67
6.2 Osnove izbranih neporušnih metod . . . 69
6.3 Združevanje podatkov z gručenjem . . . 72
6.4 Neporušne preiskave laboratorijskih betonskih preizkušancev z vgrajenimi anoma-lijami . . . 74
6.4.1 Eksperimentalne metode in materiali . . . 74
6.4.2 Rezultati . . . 74
6.5.1 Eksperimentalne metode in materiali . . . 76
6.5.2 Rezultati . . . 77
6.6 Neporušne preiskave laboratorijskega opečnatega zidu pod vplivom različne vlažnosti 78 6.6.1 Eksperimentalne metode in materiali . . . 78
6.6.2 Rezultati . . . 78
6.7 Neporušne preiskave z večsenzorskim robotnim sistemom BetoScan . . . 79
6.7.1 Eksperimentalne metode in materiali . . . 80
6.7.2 Rezultati . . . 80
6.8 Uporaba metod gručenja za avtomatsko klasifikacijo spektroskopskih podatkov na betonskih preizkušancih . . . 81
6.8.1 Eksperimentalne metode in materiali . . . 81
6.8.2 Rezultati . . . 81
6.9 Zaključki in obeti . . . 82
References 85
LIST OF TABLES
Table 2.1: The typical range of relative dielectric permittivity εr, electric conductivity
σ, wave velocity v and attenuation coefficient α of most common building
materials measured at 100 MHz (Daniels, 2004: 74, 90). The values for the
materials marked with an asterisk (∗) are taken from Wendrich (2009: 21). . 12
Table 2.2: Thermal properties (mass density ρm, thermal conductivity k, specific heat
cp, thermal diffusivity α) of most common building materials (Brink, 2005:
119). . . 22
Table 2.3: The typical range of longitudinal sound wave velocity vl of some building
materials (Wendrich, 2009: 11). . . 29
Table 4.1: Material and concrete cover of inbuilt defects in specimens S0–S3. . . 46
Table 4.2: The frequency of the maximal phase contrastfch for defects in specimen S0. 53
Table 4.3: The simulation results of Cmax, tCmax and fch for defects at depths of 1.5,
LIST OF FIGURES
Figure 1.1: Failure mechanisms on concrete structures: (a) a schematic presentation (Banville, 2008: 2), (b) spalling of concrete due to a chloride attack of em-bedded reinforcement (Banville, 2008: 2), (c) rebar corrosion with visible
cracking of concrete. . . 2
Figure 2.1: Schematic illustration of the GPR signal reflection from boundaries with different dielectric properties, and the different visualization modes – an
A-scan, B-scan and C-scan (Kohl, 2005: 819). . . 9
Figure 2.2: Common electrode arrangements in resistivity surveys and their configuration
factors K. In the figure, a refers to the dipole separation length, n is the
dipole separation factor, C1 and C2 are the current injection electrodes, and
P1 and P2 measure the potential. . . 16
Figure 2.3: The arrangement of electrodes for a 2D resistivity survey of a brickwork specimen and the sequence of measurements used to build up a pseudo-section
with the Wenner array (modified after Loke, 2011: 26). . . 17
Figure 2.4: The principle of optical IRT techniques in reflection mode – pulsed ther-mography (PT), square pulse therther-mography (SPT), lock-in therther-mography (LT) and step heating thermography (SHT). Particularly, the different used
waveforms for heat generation are presented. . . 18
Figure 2.5: The spectral distribution of EM radiation from a blackbody at different tem-peratures as described by Planck’s law. The arrows mark the wavelength where the blackbody at a particular temperature radiates the most. From the inset (y-axis is logarithmic), it can be seen that a blackbody at room temperature (300 K) radiates much less than bodies of some 1000 K even in
the IR region. . . 20
Figure 2.6: The definition of the thermal contrast C(t) as the difference in surface
tem-peratures above the defectTdef and sound area Tsound. Here,Cmax refers to
the maximal thermal contrast and tCmax is its corresponding time. . . 24
Figure 2.7: The Fourier transform of a pulse with amplitudeAp and duration tp. . . 24
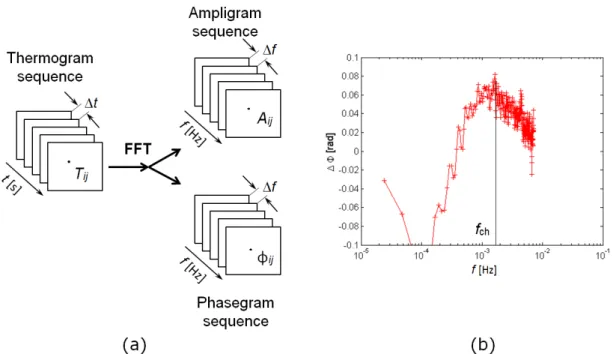
Figure 2.8: (a) The principle of pulsed phase thermography (PPT) and (b) presentation of the phase contrast curve with the frequency of the maximal phase contrast fch. . . 26 Figure 3.1: Data fusion schemes at pixel-level fusion, feature-level fusion and
symbol-level fusion. . . 32
Figure 3.2: Schematic diagram of the architecture of a generalized system for NDT data
fusion (modified after Gros et al., 1995: 2). . . 33
Figure 3.3: The distance norms used in fuzzy clustering algorithms (Babuška, 2009: 70). 35
Figure 3.4: Representation of partitioning a data set of two variables into three clusters. The assignment of observations (data points) to a specific cluster (here, red,
green or blue) is associated by the colour. For a specific observationxj, the
distances to the three cluster centres v1,v2,v3 are marked as well. . . 36
Figure 3.5: The principle of hard and fuzzy clustering. . . 37
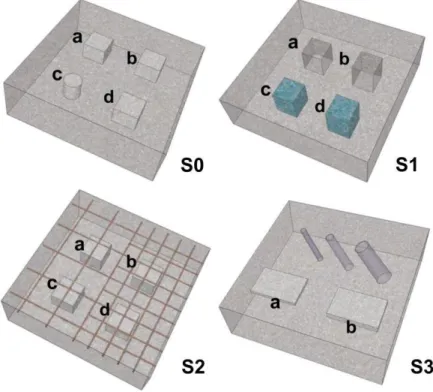
Figure 4.1: Sketches of laboratory concrete test specimens with inbuilt defects. . . 46
Figure 4.2: The IR camera FLIR A320 used for the thermographic measurements. . . . 47
Figure 4.3: The radar system used for the GPR measurements. . . 47
Figure 4.4: Thermograms of specimen S0 at different cooling down times. Each image
has a different colour scaling. . . 48
Figure 4.5: The time dependent thermal contrast C(t) for defects in specimen S0 after
30 min of heating. . . 48
Figure 4.6: The time dependent thermal contrast C(t) for defects in specimens S1 and
S2 after 30 min of heating: (a) for a water and an air defect at a depth of 3 cm, and (b) for a polystyrene defect at a depth of 4.6 cm with present
reinforcement of two densities (5 and 10 cm). . . 49
Figure 4.7: (a) A contrast image and (b) a timegram of specimen S0 after 30 min of heating. 50 Figure 4.8: (a) A contrast image and (b) a timegram of specimen S1 after 30 min of heating. 50 Figure 4.9: (a) A contrast image and (b) a timegram of specimen S2 after 30 min of heating. 50 Figure 4.10: (a) A contrast image and (b) a timegram of specimen S3 after 30 min of heating. 50
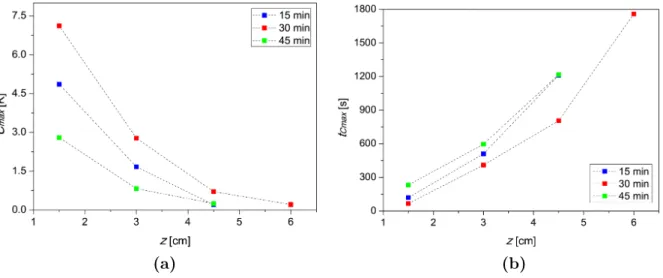
Figure 4.11: Dependence of (a) the maximal thermal contrast Cmax and (b) its
corre-sponding timetCmax on the depth of defects for different heating times (15,
30 and 45 min). The dotted lines are guides to the eye. . . 51
Figure 4.12: The fitting result forCmax andtCmaxusing the model proposed by Balageas
et al.(2.36). Experimental results for defects in specimen S0 obtained at a
heating time of 30 min were used. . . 52
Figure 4.13: The frequency dependent phase contrast∆φfor (a) the defect at a depth of
1.5 cm and (b) the defect at a depth of 3 cm in specimen S0 after 45 min of
heating and 150 min of cooling. . . 53
Figure 4.14: The fitting result for fch using the model proposed by Arndt et al. (2.44).
Experimental results for defects in specimen S0, obtained after 45 min of
heating and 150 min of cooling, were used. . . 54
Figure 4.15: IR images obtained for specimen S3: (a) the thermogram obtained directly after heating, (b) the contrast image and (c) the phase contrast image at a frequency of3.7·10−3Hz. . . . 54
Figure 4.16: The phase contrast images at (a) a frequency of 6.2·10−4Hz for specimen
S1 and (b) at a frequency of3.0·10−4Hz for specimen S2. In Fig. 4.16a, the
upper defect refers to air (b), the lower to water (d). In Fig. 4.16b, the right part of the image refers to the part of the specimen with dense reinforcement.
The red squares mark the defects position, labelled according to Table 4.1. . 55
Figure 4.17: A 2D numerical model simulating two cross-sections of a concrete specimen with inbuilt polystyrene defects (white colour). The points on the surface
where temperature was monitored are marked with red dots. . . 56
Figure 4.18: (a) The time dependent thermal contrastC(t) and (b) the frequency
depen-dent phase contrast∆φ for defects at depths of 1.5, 3.5, 6 and 7.5 cm after
30 min of simulated heating and 120 min of simulated cooling. The inset in Fig. 4.18a presents the time evolution of thermal contrast for the whole
Figure 4.19: (a) The fitting results for Cmax and tCmax using the model proposed by
Balageas et al. (2.36) and (b) the fitting results for fch using the model
proposed by Arndtet al. (2.44). . . 58
Figure 4.20: A schematic presentation of true positive (T P), true negative (T N), false
positive (F P) and false negative (F N) calls for the detection of a defect. . . 59
Figure 4.21: The results of sensitivity evaluation in terms ofc_sens(in %) for GPR (full
marks) and IRT (empty marks) with respect to the material and depth of
the defects in specimens S0–S2. The dotted lines are guides to the eye. . . . 60
Figure 4.22: The imaging results of specimen S3 with marked polystyrene plates according to Table 4.1: (a) a GPR depth slice at a depth of 1.5 cm and (b) an IR phase
KAZALO PREGLEDNIC
Preglednica 2.1: Okvirne vrednosti relativne dielektrične konstante εr, električne
pre-vodnosti σ, hitrosti valovanja v in atenuacijskega koeficienta α za
naj-pogostejše gradbene materiale pri frekvenci valovanja 100 MHz (Daniels,
2004: 74, 90). Vrednosti za materiale označene z zvezdico (∗) so vzete
po Wendrich (2009: 21). . . 12
Preglednica 2.2: Termične lastnosti (gostotaρm, toplotna prevodnostk, specifična toplota
cp, termična difuzivnostα) najpogostejših gradbenih materialov (Brink,
2005: 119). . . 22
Preglednica 2.3: Okvirne vrednosti hitrosti longitudinalnih zvočnih valovvl v nekaterih
gradbenih materialih (Wendrich, 2009: 11). . . 29
Preglednica 4.1: Material in krovni sloj betona vgrajenih anomalij v preizkušancih S0–S3. 46
Preglednica 4.2: Frekvenca pri maksimalnem faznem kontrastufchza anomalije v
preiz-kušancu S0. . . 53
Preglednica 4.3: Rezultat simulacije zaCmax,tCmax infchza anomalije na globinah 1,5,
KAZALO SLIK
Slika 1.1: Mehanizmi propadanja betonskih konstrukcij: (a) shematičen prikaz (Banville, 2008: 2), (b) odstopanje betona zaradi korozije armature kot posledica vdora kloridnih ionov (Banville, 2008: 2), (c) korozija armaturne palice z vidnim
razpokanjem betona. . . 2
Slika 2.1: Shematični prikaz odboja georadarskega signala na mejah materialov z ra-zličnimi dielektričnimi konstantami. Prikazani so še načini grafičnega prika-zovanja rezultatov – grafični prikaz refleksijske sledi (A-scan), radargram geo-radarskega profila (B-scan) in grafični prikaz prereza (C-scan) (Kohl, 2005:
819). . . 9
Slika 2.2: Tipične geometrijske razporeditve elektrod in ustrezni konfiguracijski faktorji
K pri geoelektričnih meritvah. Na sliki parameter a označuje razdaljo med
dipoloma, n je faktor razdalje med diploma, C1 in C2 sta tokovni elektrodi,
P1 in P2 pa merita napetost. . . 16
Slika 2.3: Razporeditev elektrod pri geometrijski razporeditvi Wenner za 2D geoelektri-čno meritev opečnatega preizkušanca ter sosledje meritev, ki ustvari psevdo
prerez (prirejeno po Loke, 2011: 26). . . 17
Slika 2.4: Princip delovanja tehnik optične IRT v odbojnem načinu merjenja – pulzne termografije (PT), termografije s kvadratnim pulzom (SPT), termografije z odzivom na periodično motnjo (LT) in termografije s stopničastim pulzom
(SHT). Za vsako tehniko je prikazan način ogrevanja. . . 18
Slika 2.5: Spektralna porazdelitev sevanja črnega telesa pri različnih temperaturah telesa kakor ga opisuje Planckov zakon. Navpične puščice označujejo valovno dolžino, pri kateri telo z izbrano temperaturo seva največ energije. Iz vložene slike (skala na ordinatni osi je logaritemska) je razvidno, da telesa s sobno tempe-raturo (300 K) tudi v IR območju sevajo precej manj kot telesa s tempetempe-raturo
nekaj tisoč Kelvinov. . . 20
Slika 2.6: Določitev temperaturnega kontrastaC(t)iz razlike med površinsko
temperatu-ro nad anomalijo Tdef in površinsko temperaturo nad homogenim področjem
Tsound. Pri tem Cmax označuje maksimalni temperaturni kontrast, tCmax pa
čas nastopa le-tega. . . 24
Slika 2.7: Fourierjeva transformacija pulza z amplitudoAp in dolžinetp. . . 24
Slika 2.8: (a) Princip delovanja pulzno-fazne termografije (PPT) in (b) prikaz krivulje
faznega kontrasta in frekvence, pri kateri nastopi maksimalni fazni kontrast fch. 26
Slika 3.1: Združevanje podatkov na nivoju slikovne točke, z uporabo značilnic in na
simbolnem nivoju. . . 32
Slika 3.2: Shematični prikaz arhitekture splošnega sistema za združevanje podatkov
(prire-jeno po Gros et al., 1995: 2). . . 33
Slika 3.3: Norme uporabljene v algoritmih za mehko združevanje (Babuška, 2009: 70). . 35
Slika 3.4: Prikaz gručenja množice podatkov dveh spremenljivk v tri razrede. Razpore-ditev posameznega podatka v ustrezen razred je na sliki ponazorjena z barvo
razreda (rdeči, zeleni ali modri). Za podatekxjso prikazane razdalje do središč
razredovv1,v2,v3. . . 36
Slika 3.5: Princip delovanja trdega in mehkega gručenja. . . 37
Slika 4.1: Skice laboratorijskih betonskih preizkušancev z vgrajenimi anomalijami. . . . 46
Slika 4.2: Termokamera FLIR A320, ki smo jo uporabili pri raziskavah. . . 47
Slika 4.3: Georadarski sistem MALÅ Geoscience, ki smo ga uporabili pri raziskavah. . . 47
Slika 4.4: Termogrami za preizkušanec S0 pri različnih časih ohlajanja. Vsaka slika ima
svojo temperaturno skalo. . . 48
Slika 4.5: Potek časovno odvisnega temperaturnega kontrasta C(t) za različno globoke
anomalije v preizkušancu S0 po 30 min segrevanju. . . 48
Slika 4.6: Potek časovno odvisnega temperaturnega kontrastaC(t)za anomalije v
preiz-kušancih S1 in S2 po 30 min segrevanju: (a) za vodno in zračno anomalijo na globini 3 cm ter (b) za anomalijo iz stiropora na globini 4,6 cm in ob prisotni
armaturi rastra 5 oz. 10 cm. . . 49
Slika 4.7: (a) Kontrastna slika in (b) časovna slika za preizkušanec S0 po 30 min segrevanju. 50 Slika 4.8: (a) Kontrastna slika in (b) časovna slika za preizkušanec S1 po 30 min segrevanju. 50 Slika 4.9: (a) Kontrastna slika in (b) časovna slika za preizkušanec S2 po 30 min segrevanju. 50 Slika 4.10: (a) Kontrastna slika in (b) časovna slika za preizkušanec S3 po 30 min segrevanju. 50
Slika 4.11: Odvisnost (a) maksimalnega temperaturnega kontrasta Cmax in (b) časa
nje-govega nastopatCmax od globine anomalije za različne čase gretja (15, 30 in
45 min). Črta le povezuje merske točke za lažje spremljanje rezultatov. . . 51
Slika 4.12: Rezultat prilagajanja eksperimentalnih podatkov zaCmaxintCmaxz modelom
po enačbi (2.36). Vključeni so rezultati za anomalije v preizkušancu S0 za čas
gretja 30 min. . . 52
Slika 4.13: Potek frekvenčno odvisnega faznega kontrasta ∆φza (a) anomalijo na globini
1,5 cm in (b) za anomalijo na globini 3 cm v preizkušancu S0 po 45 min
segrevanju in merjenju ohlajanja za 150 min. . . 53
Slika 4.14: Rezultat prilagajanja eksperimentalnih podatkov zafch z modelom po enačbi
(2.44). Vključeni so rezultati za anomalije v preizkušancu S0, dobljeni po
45 min segrevanju in merjenju ohlajanja za 150 min. . . 54
Slika 4.15: IR slike za preizkušanec S3: (a) termogram ob začetku snemanja, (b)
kon-trastna slika in (c) fazno-konkon-trastna slika pri frekvenci3,7·10−3Hz. . . . 54
Slika 4.16: Fazno-kontrastna slika pri (a) frekvenci 6,2·10−4Hz za preizkušanec S1 in
pri (b) frekvenci 3,0·10−4Hz za preizkušanec S2. Na sliki 4.16a je zračna
anomalija zgoraj (b), vodna anomalija pa spodaj (d). Na sliki 4.16b je gostejša armatura na desni strani. Rdeči kvadrati označujejo območje anomalij (za
oznake anomalij glej preglednico 4.1). . . 55
Slika 4.17: 2D numerični model, ki ponazarja dva prereza betonskega preizkušanca z vgra-jenimi anomalijami iz stiropora (belo območje). Točke na sprednji strani
mo-dela, kjer smo spremljali temperaturo, so označene z rdečimi pikami. . . 56
Slika 4.18: (a) Potek časovno odvisnega temperaturnega kontrasta C(t) in (b) potek
frekvenčno odvisnega faznega kontrasta∆φza anomalije na globinah 1,5, 3,5,
6 and 7,5 cm po 30 min simuliranem segrevanju in 120 min simuliranem ohla-janju. Vložena slika na sliki 4.18a prikazuje potek temperaturnega kontrasta
Slika 4.19: (a) Rezultat prilagajanja podatkov zaCmaxintCmaxz modelom po enačbi (2.36)
in (b) rezultat prilagajanja podatkov zafch z modelom po enačbi (2.44). . . . 58
Slika 4.20: Shematični prikaz kazalcev za vrednotenje zaznavanja anomalij: pravilno
po-zitivni (T P), pravilno negativni (T N), napačno pozitivni (F P) in napačno
negativni (F N). . . 59
Slika 4.21: Rezultat občutljivostne analize za georadar (polni znaki) in IRT (prazni znaki) v odvisnosti od materiala in globine anomalij v preizkušancih S0–S2. Rezultati
so podani v % parametra c_sens. Pikčasti črti povezujeta merske točke za
lažje spremljanje rezultatov. . . 60
Slika 4.22: Grafični prikaz rezultatov za preizkušanec S3 z označenimi ploščami iz stiropora (preglednica 4.1): (a) georadarski grafični prikaz prereza na globini 1,5 cm in
LIST OF APPENDICES
APPENDIX A: Article 1 – Image fusion for improved detection of near-surface defects in
NDT-CE using unsupervised clustering methods
APPENDIX B: Article 2 – Validation of non-destructive characterization of the structure
and seismic damage propagation of plaster and texture in multi-leaf stone masonry walls of cultural-artistic value
APPENDIX C: Article 3 – Effect of moisture on the reliability of void detection in
brick-work masonry using radar, ultrasonic and complex resistivity tomography
APPENDIX D: Article 4 – Unsupervised clustering of laser-induced breakdown
ABBREVIATIONS
AC Alternating current
AE Acoustic emission
AFC Adaptive fuzzy clustering algorithm
CE Civil engineering
CFRP Carbon fibre reinforced plastic
CR Complex resistivity
DC Direct current
DIC Digital image correlation
D-S Dempster-Shafer
EM Electromagnetic
EMW Electromagnetic waves
FCM Fuzzy c-means algorithm
FFT Fast Fourier transform
FPCM Fuzzy-possibilistic c-means algorithm
FT Fourier transform
GK Gustafson-Kessel algorithm
GKAρ Gustafson-Kessel algorithm with adaptive cluster volumes
GPR Ground penetrating radar
IE Impact-echo
IRT Infrared thermography
IT Inductive thermography
LIBS Laser-induced breakdown spectroscopy
LMMSE Linear minimum mean square error
LT Lock-in thermography
NCFCM Noise handling fuzzy c-means algorithm
NDE Non-destructive evaluation
NDT Non-destructive testing
NDT-CE Non-destructive testing in civil engineering
PCM Possibilistic c-means algorithm
PFCM Possibilistic-fuzzy c-means algorithm
PPT Pulsed phase thermography
PT Pulsed thermography
S Separation index
SAFT Synthetic aperture focusing technique
SC Partition index
SHT Step heating thermography
SPT Square pulse thermography
TWT Two-way travel time
UT Ultrasound thermography
1 INTRODUCTION
1.1 Scientific background and motivation
Among the numerous methods developed for the inspection of materials and structures, non-destructive testing (NDT) techniques provide the advantage of preserving the inspected object undamaged [1]. Their application to civil engineering (CE) structures originally emerged in the 1940s for the assessment of homogeneity and compressive strength of concrete using techniques such as rebound hammer, a windsor probe test, a pull-out test and ultrasonic pulse velocity method, which are today standardized methods [2, 3]. Due to the fast development of both new building materials and construction techniques, the development of potential non-destructive methods for controlling the quality of a building process is nowadays still an important research
field (e.g. for the detection of aggregate segregation, excessive amount of entrapped air voids
and honeycombs1 due to inappropriate material properties and/or construction techniques).
Relatively recently attention has focused on the loss of durability of existing building structures,
caused by both material degradation and impacts of e.g. seismic action in relation to
inappro-priate construction. To ensure accurate repair and retrofitting of such structures rather than demolition and construction of new ones, the evaluation of their current state together with damage assessment with minimal possible interference, is urgently required. To overcome the limits of visual inspection and testing samples extracted from the structure by drilling, many NDT methods have been proposed. Acoustic, dielectric, electric and thermal methods have arisen mainly from geophysics, as well as from NDT in aerospace for the inspection of compos-ite structures. Currently, only a few standards for particular application of NDT-CE methods are available [1, 3, 5]. Hence, to bring NDT into practice, an extensive validation process of the methods performance with respect to the various possible defect assessment applications is required [6].
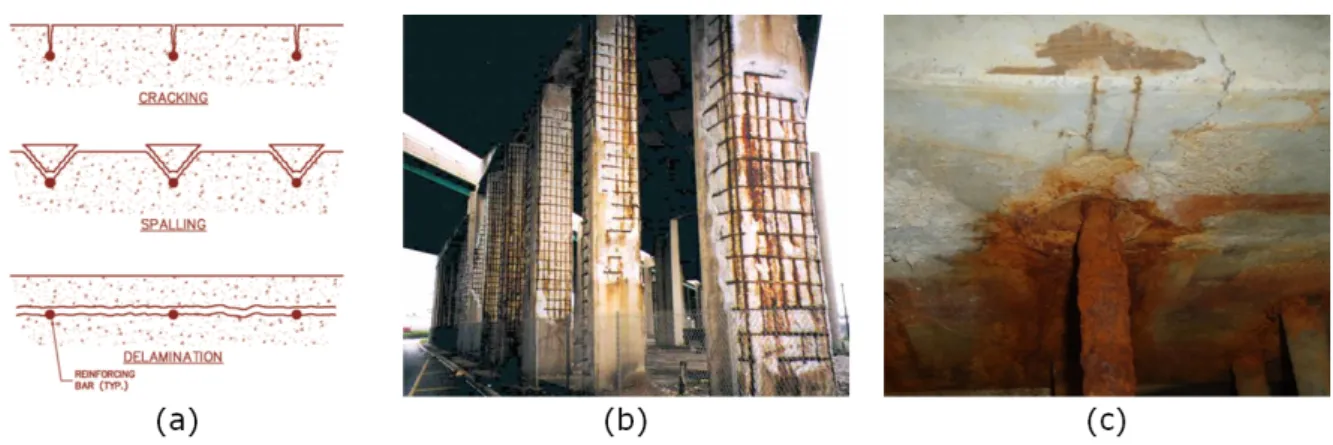
Damage of concrete structures (mostly referred to bridges, parking garages and tunnels) reflects in cracking, spalling and delamination [7] (see Fig. 1.1). In most cases it is a result of deteri-oration mechanisms such as frost action, a sulphate attack, an alkali-silica reaction as well as reinforcement corrosion [4, 7]. Except from frost action, all processes are induced by the ingress of de-icing salts into the pore system of the cement matrix in combination with insufficient con-crete quality and poor workmanship, which results in excessive amount of entrapped air voids and honeycombs as well as insufficient concrete cover above the reinforcement [8]. Damage as-sessment of masonry structures, among which a large proportion represents cultural heritage assets, is apart from the effect of de-icing salts related to the presence of high moisture content with even trapped water and internal voids. Moreover, particularly stone masonry buildings in European Mediterranean countries are highly vulnerable to seismic action, resulting in leaf detachment and cracks [9].
1
Segregation refers to separation of the components of fresh concrete, resulting in a non-uniform arrangement of aggregates, whereas honeycombs occur in case the space between aggregates is not filled [4].
Figure 1.1: Failure mechanisms on concrete structures: (a) a schematic presentation (Banville, 2008: 2), (b) spalling of concrete due to a chloride attack of embedded reinforcement (Banville, 2008: 2), (c) rebar corrosion with visible cracking of concrete.
Slika 1.1: Mehanizmi propadanja betonskih konstrukcij: (a) shematičen prikaz (Banville, 2008: 2), (b) odstopanje betona zaradi korozije armature kot posledica vdora kloridnih ionov (Banville, 2008: 2), (c) korozija armaturne palice z vidnim razpokanjem betona.
To visualize the internal structure and to detect most of the above mentioned damages affecting CE structures, methods such as ground penetrating radar (GPR), ultrasonic, impact-echo (IE) and infrared thermography (IRT) are most commonly used [10, 11, 12]. Contrary to the inspec-tion of metal and composite structures, where most research is focused on the detecinspec-tion of cracks, the application of the above mentioned methods in CE has to account for both the heterogeneous material structure and a variety of possible defects and inclusions. With respect to this, NDT-CE methods are characterized by different penetration depths, as well as different sensitivity to the physical properties of the material. However, this requires extensive validation processes of the methods performance with respect to the type of defects and material inspected [6]. In the recent two decades, an outstanding progress has been made in the characterisation of NDT-CE methods with respect to specific testing problems, for which a literature overview is given below. GPR proves to be a highly effective method for the detection of reinforcement and metal in-clusions, but at the same time dense reinforcement greatly decreases the penetration capability of electromagnetic waves (EMW) and thus decreases the efficiency in detection of defects below reinforcement [13, 14]. In case the thickness of a structural element is known, the determination of the moisture and salt concentration in the material is possible since moisture greatly affects the velocity of EMW. Apart from velocity, the moisture and salt concentration largely affect the attenuation of the radar signal [13, 15, 16], whereas pore size distribution and distribution of aggregates in the material affect the penetration capabilities to a smaller extent [14]. The effect of unfilled and grouted joints as well as the presence of larger voids in different layered brick masonry was investigated in [17]. Here, the researchers concluded that unfilled joints can be observed in the radargrams as small hyperbolas, as well as the modifications resulting after the joints were grouted. Moreover, it was found that the detection of the multi-layered structure is based on the measurements of the travel time, amplitude and phase of the reflected radar signal. Ultrasonic has been employed for the thickness estimation of concrete structural elements [18], as well as for the detection of reinforcement and tendon ducts [18, 19, 20] and for the detection
of surface cracks [20, 21]. The physical basis for most of the experimental ultrasonic results
obtained from the investigation of grouting faults in tendon ducts was explained by Krause et
al.[22] and Imet al.[23] and further confirmed by Krauseet al. using modelling techniques [24].
For the investigation of grouting faults in tendon ducts and thickness estimation of structural elements, IE was proposed as an alternative method to ultrasonic [23, 25, 26, 27]. However, for the inspection of thin structures, IE was found to perform poor since most of the input energy is transformed into shear and surface waves producing interference due to reflections at edges [6]. Apart from the investigation of concrete structures, IE was applied for evaluating the integrity of bonding in stone masonry structures and was in addition recommended for the detection of larger voids and for the monitoring of the quality of grouting repairs [28]. However, in gen-eral, GPR, the sonic pulse velocity method and IRT were proposed for assessing the bonding condition, monitoring the quality of grouting repairs, detecting the multi-layered structure and leaf detachment, as well as the presence of larger voids and higher moisture content in masonry structures [9, 29, 30, 31, 32, 33]. It should be noticed that for the inspection of historic masonry buildings, particularly the non-contact IRT has gained interest. Here, pulsed thermography was applied for the characterization of the surface and interfaces, more exactly for the detection of delamination, the masonry texture, filled vs. unfilled mortar joints [9, 31, 34, 35], as well as for the investigation of plastered mosaics [36, 37, 38]. Apart from pulsed thermography, lock-in thermography was applied on masonry for moisture measurements [39], as well as for the structural visualization at different depths [40]. Basic research on quantitative analysis of ex-perimental and numerical pulsed thermography data was performed on concrete specimens with inbuilt defects [41, 42, 43, 44, 45].
For the monitoring of micro-cracking activity at different levels of loading of concrete structures, acoustic emission (AE) was proposed [46, 47]. For the on-site investigation of historic structures on the other hand, IRT and ultrasonic were used for assessing the depth of surface cracks [48], as well as their orientation [49]. However, up till now, no methods have been proposed for the detection of internal cracks in masonry. A surface crack activation could only be observed from the displacement field when applying digital image correlation (DIC) to masonry walls subjected to shear loading [50, 51].
The given review indicates the capabilities and limitations of the currently used NDT techniques. Apart from the fact that each method can only measure certain physical properties and penetrate to a certain depth range, the methods’ performance is also greatly affected by the heterogeneous nature of building materials and structures. Therefore, the utilization of more than one method
or one method in different modes,i.e. multi-sensor testing [52, 53], would generally be required
to fully characterize the objects under inspection and to increase the accuracy of the evaluation. The first example of a multi-sensor inspection of concrete structures appears in the works by
Krause et al. [18, 54] and Pöpel and Flohrer [55], where thickness measurements of structural
elements and the detection of reinforcement are performed using GPR, ultrasonic and IE, as well
as GPR and covermeter, respectively. Dérobert et al. [56] stress the benefits of combined use
autopsy by means of hydro-demolition, whereas Naumann and Haardt [57] study the potential of combined use of GPR, acoustic, electrical and magnetic flux methods for the inspection of high-way structures. Further studies on multi-sensor inspection of concrete structures cover research on the detection, localization and characterization of surface-breaking cracks using electrical re-sistivity and ultrasonic [58], as well as the detection and visualization of inclusions using GPR, ultrasonic and IE [27]. On masonry, a combination of GPR, electrical and acoustic methods have been employed for the detection of moisture, inclusions, as well as defects such as leaf detachment and voids [9, 59, 60, 61].
Although the aforementioned studies have shown the benefit of multi-sensor testing to overcome the limitations of individual techniques, data processing and interpretation of the results were performed for each NDT technique individually. In practice, where large inspection areas and/or data sets should be evaluated, this is both costly and time consuming and is additionally sub-jected to human error interpretation and does not provide a straightforward evaluation of the structural condition. To overcome these constraints, current and future research shed light on au-tomated and computer controlled data analysis with systematic integration of information from multiple sources – data fusion [62]. Data fusion has long been used for military applications [52]. However, in the field of non-destructive evaluation (NDE), it was first introduced in 1994 in the
conference papers by Georgel and Lavayssière [63] and Gros et al. [64]. Since then, research on
data fusion has emerged rapidly for NDE applications in aerospace and nuclear industry. Dif-ferent fusion algorithms have been proposed based on optimization methods, multi-resolution approaches [65, 66, 67], heuristic methods [68], probabilistic methods such as Bayesian inference
and Dempster-Shafer (D-S) evidence [69, 65, 70, 71, 72, 73, 74], as well as fuzzy logic [71, 75].2
Taking into account that NDT results are commonly presented in 2D or 3D image formats rather than as numerical data, special interest has been devoted to the development of fully automated image processing and computer visualization [62]. However, only few of the above presented references report on the application of image fusion, based on eddy current and IRT images from composite and steel structures [69, 65, 73, 67]. In NDT-CE applications, image fusion was performed on GPR data acquired at different frequencies and polarizations, and on GPR and ultrasonic data on prestressed concrete bridge beams and test specimens for the detection of grouting faults in tendon ducts, as well as for the detection of reinforcement placed at larger
depths [14, 76, 77]. However, here, the applied fusion techniques were restricted to simple
arithmetical methods such as minimal or maximal amplitude and averaging.
1.2 Aims and scope
The main goal of this thesis was to develop an image fusion methodology based on clustering techniques, which would enable more efficient and reliable evaluation of multi-sensor NDT data in CE applications. For image fusion, clustering methods have already been applied in medical
imaging for pattern recognition,e.g. for the detection of cancerous cells from magnetic resonance
images [78] and mammograms [79], as well as for subsurface zonation by cooperative inversion of
multi-method geophysical data [80, 81]. Their main advantage is that they can work fully unsu-pervised. This is of particular interest in implementing NDT in practice in terms of automated application by trained engineers and technicians rather than scientists.
In the thesis, the aim was fulfilled by the implementation of hard – the k-means algorithm [82] – as well as different fuzzy clustering algorithms. For fuzzy clustering, the conventional proba-bilistic fuzzy c-means (FCM) by Bezdek [83], as well as its noise handling variant (NCFCM) [84] and the distance adaptive Gustafson-Kessel (GK) algorithm [85], were used. In addition, two fuzzy possibilistic clustering algorithms were analysed: the possibilistic c-means (PCM) with repulsion [86] and the possibilistic-fuzzy c-means (PFCM) [87].
Apart from developing and testing the image fusion technique for multi-sensor NDT, the thesis aimed at studying the NDT-CE methods performance with respect to different defects present in the structure as well as the material’s condition. Sensitivity analyses were performed on GPR and IRT measurements on laboratory concrete specimens with inbuilt defects and stone masonry walls subjected to plaster delamination and crack propagation. Moreover, the effect of moisture on the reliability of void detection in brickwork masonry was studied using GPR, ultrasonic and complex resistivity (CR) tomography.
Four laboratory concrete specimens served for basic studies on the detection of near-surface defects in CE such as voids, localized water and delamination, as well as for the detection of inclusions such as pipes and reinforcement. GPR and IRT were chosen since they were regarded as complementary methods in the near-surface region (up till a depth of 10 cm). Both methods were also chosen for non-destructive assessment of laboratory plastered multi-leaf stone masonry walls. Here, the measurements aimed at evaluating the masonry texture and morphology, as well as plaster detachment and structural cracking due to simulated seismic activity through stepwise in-plane cyclic shear test. A complementary use of GPR and IRT was particularly considered in order to enable a relatively fast inspection with minimal impact on the damaged structure during the shear test. In practice, the material characterization with defect detection by means of NDT plays a crucial role for masonry with artistic or cultural heritage value. Here, the evaluation of the structural condition with minimal interference is of particular importance.
As already mentioned, moisture is considered as an important parameter that may influence the state and degradation of masonry. Therefore, the performance of NDT-CE methods with respect to the moisture of the material was studied on a laboratory brickwork specimen. For this task, GPR, ultrasonic and CR tomographies were investigated. Since the tomographic tech-nique delivers a 3D visualization of the structure, the detection of a larger void was particularly considered with respect to the humidity level of masonry.
During the course of this work, the developed clustering algorithms were implemented into two data fusion frameworks for practical application: the framework for a multi-sensor robot system – the BetoScan robot system, and for a fully automated classification of spectroscopic spatial data from concrete for cement identification.
The thesis is organized as follows. The following chapter introduces the NDT-CE methods. Particularly, the physical concepts of GPR, IRT, ultrasonic and CR are presented. Chapter 3 briefly describes the aspects of image fusion, focusing on cluster analysis. Hard and several fuzzy clustering methods are presented and followed by the algorithm derivation. Chapter 4 presents the results obtained from the sensitivity evaluation of GPR and IRT on laboratory concrete specimens, focusing on the characterization of defects and inclusions using IRT. Further fusion of this data set is covered in the article given in Appx. A. This article also gives the results from the BetoScan robot system. The main outcomes from the application of GPR and IRT on stone masonry walls are presented in the article given in Appx. B. Experimental measurement results from the investigation of brickwork masonry are covered in the article in Appx. C. Clustering of laser-induced breakdown spectroscopy (LIBS) data from a concrete specimen is presented in Appx. D. The thesis is summarized by the main findings of the presented research and outlooks in chapter 5. The main part of the thesis is followed by an extended abstract of the thesis in Slovene, given in chapter 6.
2 BASIC PRINCIPLES OF SELECTED NDT METHODS 2.1 Overview of NDT methods used in civil engineering
NDT-CE methods can be broadly classified into two categories – acoustic and electromagnetic
methods. Both are based on the wave propagation with energy transfer that can be mathe-matically described by the second order partial differential wave equation. While for acoustic methods, the propagation of mechanical acoustic waves through a medium is of importance, electromagnetic methods are based on the propagation and radiation of electromagnetic waves. Therefore, different physical properties of the material are measured – with acoustic methods the information about the materials elastic properties is obtained, whereas electromagnetic methods are sensitive to the material electromagnetic properties.
All acoustic methods have in common the basic principle, which is recording acoustic waves propagating in the material after the generation of a mechanical disturbance. For recording, a piezoelectric transducer is most commonly used. However, according to [11], factors such as the used frequency range and the type of the acoustic wave generator (elastic impact hammer and spheres, as well as piezoelectric transducers) further distinguish the acoustic methods used in CE:
• Micro-seismic methods that operate in the frequency range f = 100Hz – 1 kHz [11] and
are mostly applied to the investigation of masonry arch bridges where deep penetration is essential.
• Sonic pulse velocity method where an elastic hammer generates acoustic waves in the
fre-quency range f = 500Hz – 10 kHz [11]. Due to the method’s poor resolution, but deep
penetration (results from the low frequency range), the method is particularly recom-mended for qualitative condition evaluation of masonry structures and for control of the quality of grouting repairs [88].
• Impact-echo (IE), which emerged from pile testing using frequencies lower than 1 kHz and is nowadays also used for thickness estimation of concrete slabs using frequencies up to 80 kHz [89]. The method is based on the measurement of resonant frequencies, resulting mainly from the reflections from the external boundary [12].
• Ultrasonic, which uses piezoelectric transducers for acoustic wave generation in the fre-quency range above 20 kHz [11].
• Acoustic emission (AE), which is based on the recording of acoustic waves generated within
the material undergoing stress. This principle is contrary to the recording of actively
generated waves with transducers or a mechanical impact that is common in other acoustic methods [46, 90].
The classification of various electromagnetic methods is, however, much broader than it is for acoustic methods. Here, the techniques are not only classified by the part of the electromag-netic spectrum they employ, but they also differ greatly in their sensitivity to different material properties and thus the used instrumentation. With respect to the measurement of dielectric, magnetic and electric properties, the following classification is most common [11]:
• Ground penetrating radar (GPR), which is based on antenna emissions of radio frequency signals and their penetration through a medium, as well as on the recording of reflected signals from irregularities with different dielectric properties in the material.
• Eddy current or commercially also known as thecovermeter method, which uses the prin-ciple of electric induction to determine the thickness of the concrete cover above the rein-forcement [11].
• Electrical resistivity methods (alsogeoelectrics) such as the conventionalresistivity method
and complex resistivity (CR)1 that are based on the measurement of potential difference between two electrodes as the result of an electric current injection [91].
• Electromagnetic potential methods which measure the electric potentials resulting from an
applied electromagnetic field. In CE, the most common is the half-cell potential method,
which is based on the measurement of the electrochemical potentials of the embedded reinforcement relative to a reference electrode, known as a half-cell placed at the concrete surface [11, 92].
Apart from the above methods, infrared thermography (IRT) is based on the recording of IR
radiation from the previously heated surface of a specimen and is thus sensitive to the material
thermal properties, whereasradiography measures the absorption of very high frequency
electro-magnetic radiation (X-rays and gamma rays) or the absorption of a neutron flux, with respect to the density of the material [11].
The following sections present the basic physics related to four NDT methods taken into account in the main part of the thesis – GPR, CR, IRT and ultrasonic. The techniques’ fundamental theoretical concepts will be introduced, as well as their challenges and limitations.
2.2 Ground penetrating radar
The first use of pulsed EMW to detect the structure of buried objects dates back to 1926 [93]. However, it was not before the 1980s when the first commercially available GPR system ap-peared [94], and since then the technique has emerged in a variety of other applications [95]. GPR is based on the generation and propagation of EM pulses in the radio-frequency range within the material, and the detection of either reflected or transmitted EM signals using an antenna [94]. For CE applications, the typical frequency of EM pulses is between 300 MHz and 2.5 GHz [76]. Upon the signal propagation into a dielectrically lossy material, the wave exhibits scattering and attenuation, as well as refraction and reflection from dielectric discontinuities enabling the detection of defects, which is the primary aim of NDT inspections. The estimated defect depths depends both on the waves’ velocity as well as on the travel time needed from
transmission to reflection and recording of the signal, i.e. the two-way travel time (TWT) [94].
A point measurement of the reflected EM energy from internal discontinuities builds up a GPR trace – a time dependant variation of the signals energy (with amplitude and polarity). However,
1
CR may in general refer to both the induced polarization method as well as to spectral induced polarization. Spectral induced polarization refers to the induced polarization method performed at several frequencies.
during a radar measurement, several measurement points are collected along the scanning line – a GPR profile. The visualization of the GPR trace refers to an A-scan, whereas the visualization of the GPR profile refers to a B-scan, also termed radargram [76]. The GPR principle of the signal reflection from boundaries with different dielectric properties, as well as different visualization modes (an A-scan, B-scan and time slice or C-scan), are presented in Fig. 2.1. It is worth noticing that the GPR trace does not only include reflections from discontinuities, but is also affected by the direct air wave which appears first in the A-scan, as well as by the direct ground wave and the critically refracted lateral wave [96].
Figure 2.1: Schematic illustration of the GPR signal reflection from boundaries with different dielectric properties, and the different visualization modes – an A-scan, B-scan and C-scan (Kohl, 2005: 819).
Slika 2.1: Shematični prikaz odboja georadarskega signala na mejah materialov z različnimi dielektričnimi konstantami. Prikazani so še načini grafičnega prikazovanja rezultatov – grafični prikaz refleksijske sledi (A-scan), radargram georadarskega profila (B-scan) in grafični prikaz prereza (C-scan) (Kohl, 2005: 819).
2.2.1 Electromagnetic properties of building materials and the energy storage-loss mechanisms
Quantities that determine the materials’ response to an EM field are dielectric permittivity (ε),
magnetic permeability (µ) and electric conductivity (σ), where all quantities determine the stored
and released energy. εis related to the constrained charge displacement in the electric field – the
polarization process – and thus to the stored electric field energy,µ is related to the distortion
of intrinsic atomic and molecular magnetic moments in the magnetic field – magnetisation –
and thus to the stored magnetic field energy, and σ is related to the free charge movement in
the electric field, which results in electric field energy released as heat. The statements can be mathematically described by the constitutive equations [96]
D=εE, (2.1a)
B=µH, (2.1b)
J=σE, (2.1c)
whereD is the dielectric displacement field vector, E is the electric field strength vector, B is
the magnetic flux density vector, H is the magnetic field strength vector and J is the electric
In the general case of an inhomogeneous, anisotropic and nonlinear medium,ε,µand σ are ten-sors, dependent on the position, direction and on the strength of the EM field. However, in the context of GPR applications, a homogeneous, isotropic and linear material can be assumed,
re-sulting in scalar quantities [96]. Nonetheless, in real lossy (dispersive) materials,D,BandJmay
not be directly related to the energy field strength components according to Eq. (2.1a)–(2.1c), but exhibit a particular time-history dependence on the temporarily preceding field (radiated field due to moving charges) with respect to the frequency dependent polarization or magneti-zation phenomena. Hence, the material properties are frequency-dependent complex quantities, such that
ε(ω) =ε0−i ε00, (2.2a)
µ(ω) =µ0−i µ00, (2.2b)
σ(ω) =σ0−i σ00, (2.2c)
where the imaginary dielectric permittivity ε00 and magnetic permeability µ00 relate to the
re-laxation energy losses in the polarization and magnetization processes, respectively. Similarly,
the imaginary electric conductivity σ00 quantifies the energy stored during polarization of free
charges. In the context of GPR applications, only εand σ are of importance as most building
materials are generally nonmagnetic [96].
In general, polarization processes in materials can be of various types: electronic (circular orbits of electrons become elliptical), atomic (distortion of atoms), dipolar (the rotation of dipole molecules into alignment with the electric field) and Max-Wagner (accumulation of free ionic
charges at boundaries at frequencies below 10 MHz) [96, 97]. All polarization processes are
frequency dependent, where the imaginary dielectric constant relates to the energy released in the relaxation process [94]. However, for the GPR frequency range, the most important polarization process is the dipolar due to free and bound water molecules in the material. Here, the maximal released energy occurs around 10–20 GHz, which limits the high-frequency range of GPR [94]. Similarly, energy losses due to electric conductivity of ionic charge transport in water are most pronounced at the frequency range of 10–300 MHz, which defines the low-frequency limit of GPR [94]. However, the high-frequency limit is apart from the polarization processes determined by scattering losses, which become apparent at wavelengths approaching the size
of particles [97]. In addition to material attenuation losses due to σ0 and ε00, as well as target
scattering losses, the GPR gain decreases along the path also as a result of energy spreading loss [94, 95].
2.2.2 Wave nature of electromagnetic fields
The foundations of GPR are governed by the Maxwell equations coupling the electric and mag-netic fields, as well as by the constitutive laws describing the materials’ response to an EM field [96]. By coupling both of them, the wave equation for the electric and magnetic field is
obtained, which for the electric field vectorEyields [96]
∇ × ∇ ×E+µσ∂E
∂t +µε
∂2E
∂2t = 0. (2.3)
For a conducting dielectric, the resulting electric field can be described as a function of distance, z, and time,t, by [95]
E(z, t) =E0e−αzei(ωt−βz), (2.4)
where the first exponential term relates to attenuation and the second to propagation of EMW.
Parameter α is the material attenuation coefficient, β the phase constant, ω the angular
fre-quency,ω= 2πf, andf is the frequency of EMW. By relatingαandβto a complex propagation
factor for a dispersive medium, k, such that ik = α+iβ = iωpµ(ε0−iε00),2 the attenuation
coefficientαand wave velocity v can be expressed as [95, 96]
α= σ 2 r µ ε =ω µε0 2 p 1 + tan2δ −1 1/2 , (2.5a) v=√1 µε =c µrε0r 2 p 1 + tan2δ + 1− 1/2 , (2.5b)
where c is the velocity of EMW in free space, εr is the relative dielectric permittivity of the
medium, related toεand the free-space dielectric permittivity,ε0, byεr=ε/ε0,µris the relative
magnetic permeability of the medium, related toµand the free-space magnetic permeability,µ0,
by µr =µ/µ0, andtanδ is the loss tangent quantifying the ratio between the total energy loss
and the total energy storage due to both dipolar and conductivity effects as [96]
tanδ = σ0+ωε00
ωε0−σ00. (2.6)
According to Eq. (2.5a), higher frequencies result in greatly attenuated EM propagation. Thus, lower frequencies have to be used with GPR to penetrate deeper. For low-loss conditions, the following can be assumed
tanδ ≈ σ0
ωε0 ≤1, (2.7)
which yields the low-loss conditions for the frequency independent attenuation coefficient and
the wave velocity3
α= σ 2 r µ ε , (2.8a) v=√c εr . (2.8b) 2
Note that according to Daniels [95] and other literature on GPR, the term complex propagation factor k is mostly used for the relationik=α+iβ, although strikly speakingkis the complex wavenumber and is related to the complex propagation factor¯γbyγ¯=−ik.
3Eq. (2.8b) is obtained by assumingµ
From Eq. (2.8a) it can be seen that the electric conductivity affects the EMW attenuation the most.
Using Eq. (2.8b), the wavelength of the EMW in low-lossy materials can be estimated according to λ= v f = c f√εr . (2.9)
Table 2.1 summarizes the typical range of relative dielectric permittivity εr, electric
conductiv-ity σ, wave velocity v and attenuation coefficient α of various building materials measured at
100 MHz.
Table 2.1: The typical range of relative dielectric permittivityεr, electric conductivityσ, wave velocity
vand attenuation coefficientαof most common building materials measured at 100 MHz (Daniels, 2004: 74, 90). The values for the materials marked with an asterisk (∗) are taken from Wendrich (2009: 21).
Preglednica 2.1: Okvirne vrednosti relativne dielektrične konstanteεr, električne prevodnostiσ, hitrosti
valovanja v in atenuacijskega koeficienta α za najpogostejše gradbene materiale pri frekvenci valovanja 100 MHz (Daniels, 2004: 74, 90). Vrednosti za materiale označene z zvezdico (∗) so vzete po Wendrich (2009: 21). Material εr σ (S/m) v (m/ns) α (dB/m) Air 1 0 0.300 0 Freshwater 81 10−6–10−2 0.033 0.01 Sea water 81 100 0.01 100 Concrete dry 4–10 10−3–10−2 0.11 2–12 Concrete wet 10–20 10−2–10−1 0.08 10–25 Brick dry∗ 4–8 <10−3 0.12 <2 Brick wet∗ 8–12 10−2 0.09 9–11 Limestone dry 7 10−8–10−6 0.11 0.5–10 Limestone wet 8 10−2–10−1 0.11 1–20 Sandstone dry 2–5 10−6–10−5 0.15 2–10 Sandstone wet 5–10 10−4–10−2 0.11 4–20
2.2.3 Reflection and refraction of electromagnetic waves
When the GPR signal encounters a subsurface discontinuity, both reflection and refraction of EMW occur with respect to both geometric characteristics of the target and its dielectric prop-erties as well as the dielectric propprop-erties of the medium. The change in amplitude of the reflected
signal from a planar boundary is governed by the reflection coefficient r
r= Z2−Z1
Z2+Z1
, (2.10)
where Z1 and Z2 are the electromagnetic impedances of medium 1 and 2 and Z = E/H. In
a nonmagnetic and low-lossy medium and a single frequency of radiation, the above expression may be simplified to [95] r= √ε r2 −√εr1 √ε r2 +√εr1 , (2.11)
whereεr1 andεr2 are the relative dielectric permittivities of medium 1 and 2.
Considering that the reflection coefficient has a positive value when εr2 > εr1 and otherwise
a negative one, amplitude changes can be detected with respect to the dielectric contrasts at boundaries.
2.2.4 Horizontal and vertical resolution
The resolution of an antenna is defined by the ability to resolve two closely spaced features [94].
For GPR, two resolution components are important: vertical (range or depth) – ∆V – and
horizontal (plan) –∆H – resolution. The vertical resolution relates to the temporal resolution
to differentiate two adjacent signals in time, whereas the horizontal resolution is the ability to differentiate two targets placed at the same depth [95]. Both are dependent on the antenna
characteristics (system bandwidthB) and material properties by [96]
∆V ≥ v 4B = λc 4 , (2.12a) ∆H ≥ r vd 2B = r λcd 2 , (2.12b)
whereB =fc for impulse GPR [96] and fc is the centre frequency of the antenna signal, λc is
related tofcaccording to Eq. (2.9) and dis the distance to the target.
It should be noted that the expression for the horizontal resolution (2.12b) results from the
Fresnel zone concept,i.e. the interference of reflected signals from targets placed at a distanced
with the radiated EM field occurs in an ellipsoidal volume of radius∆H (the Fresnel zone) [96].
The interference effects hence directly limit the ability to resolve two closely spaced targets at the same depth.
However, in addition to the vertical resolution, the shallowest targets to be detected are
deter-mined by the GPR near-field region, which extends up till the depth of1.5λc[95]. However, the
strongest antenna induction/coupling effects appear in the reactive near-field region. Thus, for
the minimal detectable distance to targets, a recommendation ofdmin =λc/2π has been given
as the boundary between the reactive and radiating near-field region for an electrically small antenna [96]. For most GPR applications in CE, the use of a small bow-tie dipole or butterfly antennae is the most common. However, the antenna characteristics and the GPR system will not be reviewed herein. An excellent description is given in [95] and [96].
2.3 Complex resistivity
In 1912 the Schlumberger brothers performed the first electrical resistivity survey to estimate the subsurface conductivity over a region of interest [98]. A four-electrode array was used, where the outer two electrodes served for current injection and the inner two measured the resulting electrical potential difference. Nowadays, several electrode array configurations can be used and combined in a multi-electrode acquisition survey producing 2D and 3D data sets. With this
obtained using tomographic inversion routines.
The two electrically based resistivity methods – the resistivity and the CR method – determine the resistivity of a material from the measured potential difference between two electrodes af-ter current injection according to Ohm’s law. However, their main difference is that CR uses alternating currents (AC) of high frequencies and is more sensitive than the normal resistivity method, which uses either direct currents (DC) or AC of low frequencies (up to 20 Hz) [91]. Therefore, CR is able to detect materials of very low conductivity that can hardly be detected using the conventional resistivity method [99].
2.3.1 Electrical polarization
The term CR directly reflects that when AC is used, the materials’ frequency dependent complex
resistivity (also electrical impedance) is of significance, where the real component ρ0 refers to
the electrical resistivity and the imaginary component ρ00 to the reactivity and polarization
phenomenon, such that4
ρ(ω) =ρ0−i ρ00=|ρ|eiδ = 1
σ(ω), (2.13)
where |ρ| is the resistivity magnitude – the in-phase amplitude rati