The Rockwool Foundation Research Unit
Immigration to Denmark
An Overview of the Research
Carried Out from 1999 to 2006 by the
Rockwool Foundation Research Unit
Poul Chr. Matthiessen
University Press of Southern Denmark
Odense 2009
Immigration to Denmark
An Overview of the Research Carried Out from 1999 to 2006 by the Rockwool Foundation Research Unit
Published by:
© The Rockwool Foundation Research Unit and University Press of Southern Denmark
Copying from this book is permitted only within Institutions that have agreements with CopyDan, and only in accordance with the limitations laid down in the agreement
Linguistic adviser: Tim Caudery
Address:
The Rockwool Foundation Research Unit Sejroegade 11 DK-2100 Copenhagen Oe Telephone: +45 39 17 38 32 Fax: +45 39 20 52 19 E-mail: [email protected] Home page: www.rff.dk ISBN 978 87 7674 413 7 October 2009 Print run: 800
Printed by Special-Trykkeriet Viborg a-s Price: 235.00 DKK, including 25% VAT
Foreword
The Rockwool Foundation aims to provide new knowledge of society to inform Denmark’s decision-makers and the public debate. Since 1997, the Rockwool Foundation has given high priority to the study of conditions of life for non-Western immigrants in Denmark among the research topics that it supports. A whole range of research reports in this field have been published from 1999 onwards, mainly in Danish, together with some more readily accessible presentations intended to provide a wider public with access to the main results of the research. At one hand there had been a very involved public debate during the 1990s and even before this, and on the other hand the issue had only scarcely been empirically considered in Denmark at the time of the unit’s first publication in 1999.
Initially, the research focused especially on issues concerned with the integration of non-Western immigrants into the Danish labour market, supplemented by a number of analyses of other important factors concerning conditions of life in Denmark for immigrants, and of demographic factors.
Later, the work was extended to include analyses of other related topics. In addition, a comparative study was conducted in collaboration with Professor Klaus F. Zimmermann of the Institut zur Zukunft der Arbeit (IZA – Institute for the Study of Labor) in Bonn. The study was based on data of an almost identical nature concerning the integration of non-Western immigrants into the labour markets of Denmark and Germany as well as other aspects of their conditions of life and their situation in relation to the welfare state.
In 2007, with a view to providing the international research community with access to this very comprehensive body of material through an overview presentation in English, I approached Poul Chr. Matthiessen, former professor of demography at the University of Copenhagen, and invited him to write a summary of the central results in a readily accessible form. Professor Matthiessen was in an excellent position to undertake the task of disseminating information in this area, since he had also played a central role in the Rockwool Foundation’s work on immigration from the outset. This book is the outcome of his work. At the same time as summarising previous work, Professor Matthiessen has aimed to update the factual information involved as far as possible, so that the book now presents not only the research that has been carried out but also a great deal of information about the most recent immigration to Denmark and about immigrants’ integration into Danish society. In the writing of this book, the author and the Rockwool Foundation Research Unit have benefited from comments on the text from various experts in the areas covered by the different analyses. The former Head of Research at the Research Unit, Gunnar Viby Mogensen, who was responsible for starting the programme of research on this topic under the auspices of the Rockwool Foundation, and
who has himself published various books in the field, has read and commented on the entire manuscript, as has Bent Jensen of the Research Unit.
Several researchers currently or previously employed at the Research Unit, namely Jens Bonke, Claus Larsen, Niels-Kenneth Nielsen and Marie Louise Schultz-Nielsen, have also contributed to the work by reading through and commenting on the chapters concerned with their particular research projects in the field. Similarly, Professor Eskil Wadensjö from the University of Stockholm and Hans Jørgen Nielsen, former Associate Professor at the Department of Political Science, University of Copenhagen, have commented on the sections where their research is presented.
I would like to mention in particular the very helpful cooperation we have received from Statistics Denmark, which is under the direction of Jan Plovsing. Statistics Denmark not only works closely with the Rockwool Foundation Research Unit but also hosts our offices within their premises.
I would like to express my thanks to a number of people working within the Research Unit. Mai-britt Sejberg, the Research Unit secretary, has corrected the proofs, prepared the manuscript for printing and carried out other practical tasks in connection with the production of the book. Johannes K. Clausen and Peer Skov, both students of Political Science, have provided skilled research assistance, while Bent Jensen, in addition to providing academic commentary on the manuscript, has been responsible for liaison with our ever-patient and highly professional publisher, the University Press of Southern Denmark.
As always with the Research Unit’s projects, the work on this book has been carried out in complete academic independence and free from the influence of any party, including the Rockwool Foundation itself, who have generously provided the necessary resources. Poul Chr. Matthiessen and I would like to extend our warmest thanks to the staff of the Foundation, including the President, Elin Schmidt, and the Board, chaired by Tom Kähler, for their unfailing support and cooperation.
Contents
1. Immigration to Denmark since the 1960s...9
1.1. Introduction ...9
1.2. Numbers of immigrants and second generation immigrants ...10
1.3. Naturalisation ...15
1.4. Remigration ...18
1.5. Gender and age distributions ...18
1.6. Fertility ...19
1.7. Immigration of labour, family reunification and refugees...20
1.7.1. Permits for work and study...20
1.7.2. Family reunification ...21
1.7.3. Refugees ...22
1.7.4. Annual asylum statistics and longitudinal analyses...23
1.8. Summary ...24
2. The various stages of the research and the datasets used ...29
2.1. Introduction ...29
2.2. The 1999 study ...30
2.2.1. Introduction ...30
2.2.2. The questionnaire survey...31
2.2.3. The omnibus surveys...35
2.2.4. Register information ...35
2.2.5. The Law Model ...36
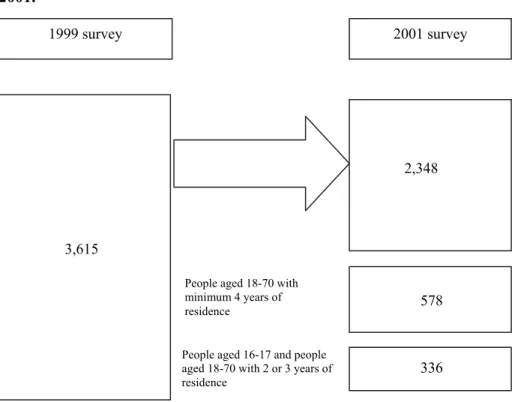
2.3. The 2001 study ...36
2.4. The German dataset...39
2.5. Summary ...42
3. Education and Danish language proficiency ...45
3.1. The 1999 study ...45
3.1.1. Introduction ...45
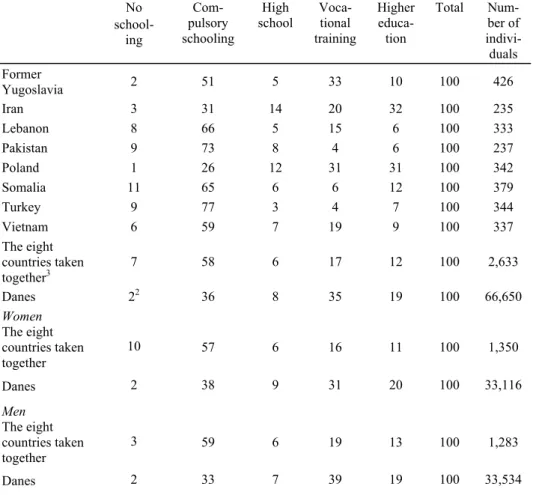
3.1.2. Education from countries of origin...46
3.1.3. The overall picture of the education level of non-Western immigrants...47
3.1.4. Significant factors for the level of education of non-Western immigrants...50
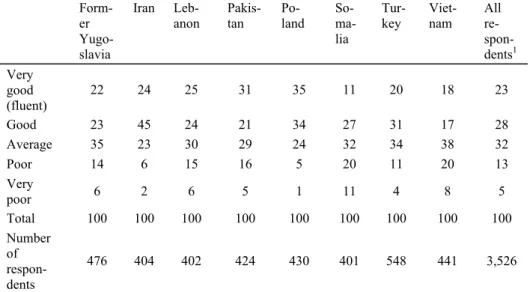
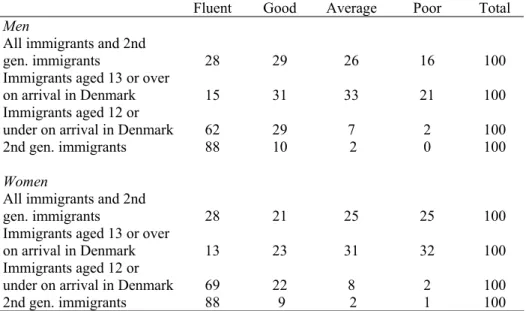
3.1.5. Danish language proficiency skills among non-Western immigrants and second generation immigrants...52
3.2. The 2001 study ...56
3.3. The 2004 study ...58
3.4. Summary ...59
4. Crime among immigrants ...63
4.1. Introduction ...63
4.2. Convictions 1993-1998 ...64
5. Labour market conditions...71
5.1. Introduction ...71
5.2. Trends in employment 1985-2007...71
5.3. The link between year of immigration and participation in the labour market...77
5.4. Distribution of employment categories among immigrants from non-Western countries ...80
5.5. Discrimination ...81
5.6. Incentives to work ...83
5.7. Comparative analyses for employed and unemployed immigrants...85
5.8. Summary ...88
6. Immigrants and the Danish Welfare System ...93
6.1. Introduction ...93
6.2. Welfare payments...93
6.2.1. Long-term benefits ...93
6.2.2. Short-term benefits ...94
6.2.3. Entitlements...95
6.3. Transfer payments to immigrants ...96
6.3.1. Long-term benefits ...96
6.3.2. Short-term benefits ...100
6.4. Duration of benefit payments ...103
6.5. The average level of public support ...106
6.6. Likelihood of receiving welfare benefits...108
6.7. Summary ...110
7. Immigrants and the public exchequer...113
7.1. Introduction ...113
7.2. Changes over the period 1991-2001...114
7.3. Factors affecting the amount of net transfers to or from individuals...117
7.4. A cohort analysis: The long-term effects of one year’s immigration ...119
7.5. Studies in other countries ...120
7.6. Summary ...121
8. The geographical distribution of non-Western immigrants in Denmark ...125
8.1. The residential pattern of non-Western immigrants, 1985-2004...125
8.1.1. Introduction ...125
8.1.2. The Dissimilation Index ...126
8.1.3. The Isolation Index...127
8.1.4. Delimitation of residential districts ...128
8.1.5. Trends in the two indices, 1985-2004 ...129
8.2. Where do non-Western immigrants live?...133
8.3. The effects of living in a municipality with many other refugees on refugees’ employment prospects and salary ...134
8.4. Summary ...139
9. The integration of non-Western immigrants in Denmark and Germany ...143
9.1. Introduction ...143
9.2. Educational attainment and training ...144
9.3. Employment trends...146 9.4. Employment incentives ...146 9.5. Earnings dispersion ...147 9.6. Immigrant self-employment ...149 9.7. Welfare take-up ...150 9.8. Crime ...151
9.9. The public exchequer ...152
9.10. Socio-economic consequences ...153
9.11. Summary ...154
10. The attitudes of the Danish population to the admission of refugees to Denmark ...159
10.1. Introduction ...159
10.2. Danes’ opinions on the admission of refugees ...160
10.3. The opinions of Danes and the populations of neighbouring countries on the admission of refugees...162
10.4. Immigrants’ opinions on admission of refugees...165
10.5. Summary ...166
11. Are Danes hostile towards immigrants? Foreign media images of Denmark...169
11.1. Introduction ...169
11.2. Scanning the press ...171
11.3. The image of the Danes as xenophobic ...173
11.4. Selectivity in the description ...176
11.5. The attitudes of the Danish people, according to the foreign media ...179
11.6. Generalisations ...181
11.7. Norms for what may be written and for how it is written ...182
11.8. Are the Danes more “xenophobic” than anyone else?...184
11.9. Is the Danish debate more “xenophobic” than that in other countries? ...186
11.10. A reality created by opinions? ...189
11.11. Summary ...191
12. Foreigners in the Danish newspaper debate ...195
12.1. Introduction ...195
12.2. The migration of labour...195
12.2.1. The immigration of Swedish labour ...195
12.2.2. The Polish workers in Denmark ...197
12.3. Refugees and asylum seekers ...200
12.3.1. Russian Jews and revolutionary refugees, 1905-1920...200
12.3.2. Prisoners of war, revolutionary agents and White Russian refugees, 1915-1920...202
12.3.3. Refugees from Hitler’s Germany, 1933-1940 ...203
12.3.4. German refugees in Denmark, 1945-1949...203
12.3.5. The Hungarian refugees, 1956 and 1957...204
12.3.6. Asylum seekers, 1983-1995 ...205
12.4. Summary ...207
13. Summary ...211
13.1. Aims, background and sources...211
13.2. Education, Danish language proficiency and crime ...214
13.3. The labour market, the social security system and the public sector...216
13.4. Distribution of housing...220
13.5. The Danish-German project ...222
13.6. The media and opinions of immigration...224
13.7. Main points...227
Publications in English from the Rockwool Foundation Research Unit...229
1.
Immigration to Denmark since the 1960s
1.1. Introduction
Ever since the sixteenth century, Europeans have been emigrating to North and South America, Australia and New Zealand in the hope of creating better lives for themselves. There has also been a smaller flow of emigrants to African countries such as South Africa, Kenya and Algeria. Until the middle of the twentieth century, the flow of emigrants out of Europe was greater than the number of immigrants; however, during the second half of the century the situation altered, and Europe saw net immigration. The picture in Denmark has reflected these trends.
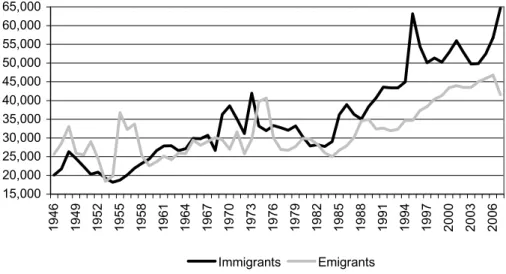
Figure 1.1. Number of immigrants and emigrants to and from Denmark, 1946-2007. 15,000 20,000 25,000 30,000 35,000 40,000 45,000 50,000 55,000 60,000 65,000 194 6 194 9 195 2 195 5 195 8 196 1 196 4 196 7 197 0 197 3 197 6 197 9 198 2 198 5 198 8 199 1 199 4 199 7 200 0 200 3 200 6 Immigrants Emigrants
Note: The statistics include both Danish and foreign nationals. Source: Statistikbanken (StatBank Denmark1), Table HISB3.
Figure 1.1 shows the annual flows of migrants in and out of Denmark since the end of World War II, and covers both Danish and foreign nationals. Up until 1960 there was net emigration in most years; after that date, however, Denmark generally saw net immigration, with the body of immigrants changing not only in size but also in composition.
Until the mid-1960s, immigrants to Denmark came principally from Norway, Sweden, the United Kingdom, Germany and the USA – the same countries as those to which emigrants mainly chose to go. The immigrants were in many cases Danish citizens returning home after a period abroad, while many emigrants were similarly returning to their respective home countries after a period of residence in Denmark. Since the 1960s, Denmark has experienced immigration from non-Western countries. Western and non-Western countries are here defined as follows:
Western countries: EU member states, Iceland, Norway, Switzerland, USA, Canada, Australia and New Zealand.
Non-Western countries: All countries other than those listed above.
A large number of countries have joined the EU since the 1970s (see Table 1.1), so that the categories of Western and non-Western countries have not included the same countries at all times. Poland, for example, is counted among the Western countries from the start of 2005 onwards, following its accession to the EU in 2004.
Up until the suspension of immigration in 1973, which was introduced in the wake of the huge oil price increases and the subsequent fear of unemployment, immigration from non-Western countries was principally comprised of “guest workers” from Turkey, Pakistan and Yugoslavia, who came to work in the Danish industrial sector. A long period of economic growth and low levels of unemployment had created a demand for labour which could not be fully met by the local workforce, even though the size of the workforce had been swollen by the “baby boomer” generation born during and immediately after the war and by the increasing number of women active on the labour market. As a result, Denmark – like many other Western European countries – welcomed labour immigrating from the countries mentioned above. After the suspension of immigration, the composition of immigration from non-Western countries changed once more, now consisting largely of members of the families of the original guest workers or their children, of refugees, and of people joining those refugees through family reunification (Pedersen 1999 and 2000; Larsen and Matthiessen 2002; Bauer, Larsen and Matthiessen 2004a).
1.2. Numbers of immigrants and second generation immigrants
Immigration after the mid-1960s has led to a significant increase in the number of foreign nationals from non-Western countries residing in Denmark. Accord-ing to Pedersen (1999), the numbers of citizens of Yugoslavia and Turkey resi-dent in Denmark were below 500 for each of the two countries in 1965 – the first year in which separate counts were made of nationals from these countries – and that remained the situation until 1967. 1971 is the first year for which
infor-mation is available regarding the number of Pakistani nationals in Denmark; there were over 2,000. The figures for the years since 1974 – which is the first year for which precise and complete figures are available for the numbers of resident foreign nationals – are shown in Table 1.1. It should be noted that 1974 was the year following the suspension of immigration mentioned above.
The numbers of residents from the three original source countries for guest workers all increased after 1974. The number of citizens of Yugoslavia increased by two thirds between 1974 and 1995, at which time the civil war in that country created an extraordinary situation. As a result, a large number of refugees who had temporary residence permits were granted permanent resident status within a very short space of time, so that by the turn of the century the total number of residents from the former Yugoslavia – as the area had now become known as – was five times what it was in 1974. The number of Turkish citizens quadrupled during the same period, while the figure for Pakistani nationals doubled. The total number of foreign nationals from other non-Western countries increased five-fold. Since the turn of the millennium, the number of citizens from the three original guest-worker countries resident in Denmark has fallen. In contrast, the number of citizens from the EU and North America resident in Denmark has increased significantly since the expansion of the EU in 2004.
A definition purely on the basis of citizenship of the section of the population which has a foreign background is, however, too narrow to be useful for purposes such as the consideration of integration policy. It is not in fact the case that all immigrants who adopt Danish nationality become fully integrated into Danish society. Since there are some national groups who have a greater tendency than others to become naturalised, grouping foreign nationals according to their countries of origin creates a misleading picture of the numerical relationships between the various nationalities.
With a view to creating a more realistic and relevant division of the resident population of Denmark for purposes of scientific analysis or formation of integration policies, the legal definitions in terms of citizenship used in official statistics were supplemented in 1991 with the concepts immigrants, second generation immigrants and others (i.e. Danes), based on origin – first and foremost on the basis of the parents’ place of birth and citizenship. In place of
others (the description people of Danish origin is used in the official Danish statistics today), we shall use the more idiomatic term Danes in this book to describe the 90-95% of the population who are neither immigrants nor second generation immigrants.
Table 1.1. Numbers of resident foreign citizens shown according to nationality, 1974-2008. Non-Western countries Nordic countries EU member states and North America (Former)
Yugosla-via Turkey Pakistan
Other countries Total Total 1974 21,774 28,895 6,779 8,138 3,733 20,536 39,186 89,855 1975 21,945 30,683 6,892 8,129 4,982 21,300 41,303 93,931 1976 21,096 29,450 6,396 7,857 5,178 20,877 40,308 90,854 1977 21,419 29,211 6,434 8,628 5,400 20,563 41,025 91,655 1978 21,886 29,605 6,674 10,299 5,557 20,394 42,924 94,415 1979 22,432 30,177 6,955 11,985 5,912 20,154 45,006 97,615 1980 22,608 29,308 7,126 14,086 6,400 20,268 47,880 99,796 1981 22,390 29,379 7,317 15,838 6,598 20,078 49,831 101,600 1982 22,147 28,418 7,402 16,705 6,822 20,420 51,349 101,914 1983 22,201 28,296 7,344 17,240 6,750 21,221 52,555 103,052 1984 22,334 28,424 7,397 17,827 6,659 21,421 53,304 104,062 1985 22,600 29,299 7,617 18,806 6,692 22,712 55,827 107,726 1986 23,021 30,783 7,943 20,408 6,619 28,175 63,145 116,949 1987 23,377 31,924 8,348 22,313 6,590 35,701 72,952 128,253 1988 23,130 32,097 8,799 24,423 6,500 41,228 80,950 136,177 1989 22,977 31,658 9,149 26,072 6,454 45,706 87,381 142,016 1990 23,064 31,829 9,535 27,929 6,285 52,002 95,751 150,644 1991 23,242 33,265 10,039 29,680 6,231 58,184 104,134 160,641 1992 23,512 33,766 10,719 32,018 6,081 63,429 112,247 169,525 1993 23,745 35,196 11,306 33,653 6,259 69,944 121,162 180,103 1994 24,192 37,058 11,618 34,658 6,368 75,120 127,764 189,014 1995 25,378 39,593 11,324 34,967 6,401 79,042 131,734 196,705 1996 27,052 41,511 28,081 35,739 6,552 83,811 154,183 222,746 1997 28,660 43,638 32,184 36,835 6,736 89,642 165,397 237,695 1998 29,927 45,403 33,931 37,519 6,934 95,914 174,298 249,628 1999 30,646 47,052 34,456 38,055 7,135 98,930 178,576 256,274 2000 31,313 47,451 35,062 36,569 7,115 101,847 180,593 259,357 2001 31,763 47,905 34,954 35,232 7,071 101,704 178,961 258,629 2002 32,080 48,831 35,354 33,383 7,160 109,921 185,818 266,729 2003 32,842 49,367 33,127 31,898 6,917 111,273 183,215 265,424 2004 33,735 50,335 32,700 30,273 7,022 117,146 187,141 271,211 2005 34,362 62,260 28,981 29,956 6,859 105,186 170,982 267,604 2006 34,828 65,967 27,705 29,491 6,671 105,389 169,256 270,051 2007 35,865 75,023 26,872 28,752 6,587 104,921 167,208 278,096 2008 37,054 83,777 26,762 28,843 6,724 107,330 169,659 290,490 Note: Greece is counted as an EU member state from 1 Jan 1981, Portugal and Spain from 1 Jan 1986, the former East Germany (DDR) from 1 Jan 1991, Austria from 1 Jan 1995, the ten new Eastern and Southern European members from 1 Jan 2005, and Bulgaria and Romania from 1 Jan 2007. Iceland, Sweden and Finland are included in the figures for the Nordic countries. Sources: 1974-1978: Matthiessen (2007); 1979-2006: Statistikbanken, Table Bef:2A, 2007-2008: Statistikbanken, Table KRBEF: 2A.
The three categories of the population are defined as follows:
Immigrants: People born abroad whose parents were both (or in cases where only one parent is known, that parent) foreign nationals or born abroad. If no information is available about either parent, and the person was born abroad, the person is also classified as an immigrant (Danmarks Statistik (Statistics Denmark) 2005). The concept covers equally those who have immigrated in order to work, in connection with family reunification, or as refugees.
Second generation immigrants: People born in Denmark of parents neither of whom (or in cases where only one parent is known, that parent) is a Danish citizen born in Denmark. If no information is available about either of the parents, and the person in question is a foreign citizen, the person is also classified as a second generation immigrant (Danmarks Statistik 2005).
Danes: People born to parents of whom at least one is a Danish citizen born in Denmark, regardless of the country of birth of the person in question or his/her citizenship. If no information is available about either of the parents, the person is classified as a Dane if he/she is a Danish citizen born in Denmark (Tænketanken (Think Tank on Integration in Denmark) 2002).
This division based on parents’ countries of birth and citizenship has been applied retroactively as far back as 1980. Categorisation according to this method naturally places a larger proportion of the Danish population in the group of people with a foreign background than does categorisation based on citizenship, since Danish nationals may also be included in the group with foreign origins. This is illustrated in Table 1.2, which shows the figures for all years since 1980 for the people with foreign backgrounds calculated in terms of numbers of foreign nationals and in terms of numbers of immigrants and second generation immigrants. Percentages of the population are also shown. The proportion of the Danish population with foreign citizenship increased from 1.9% in 1980 to 5.5% in 2008, while the proportion of immigrants and second generation immigrants increased from 3.0% to 9.1% over the same period. The proportion of second generation immigrants among the total immigrant population doubled from 12% to 24% between 1980 and 2008.
As is the case for foreign nationals, there are more immigrants and second generation immigrants today from non-Western countries than from Western countries. In 2008, immigrants and second generation immigrants from non-Western countries made up around 70% of the immigrant population, as compared to just 34% in 1980. Changes in the numbers of immigrants and second generation immigrants from Western and non-Western countries since 1980 are shown in Figure 1.2.
The distribution by geographical origin of the immigrant population from non-Western countries has changed significantly in the space of less than thirty years. In 1980, the ten largest groups (in descending order) had their origins in the
Table 1.2. Foreign nationals, immigrants and second generation immigrants, 1980-2008. Foreign nationals Immigrants 2nd generation Immigrants and 2nd gen. in total Foreign nationals as a percentage of the entire Danish population Immigrants and 2nd gen. as a percentage of the entire Danish population 1980 99,796 134,705 18,253 152,958 1.9 3.0 1981 101,600 136,229 19,423 155,652 2.0 3.0 1982 101,914 136,411 20,554 156,965 2.0 3.1 1983 103,052 136,976 21,552 158,528 2.0 3.1 1984 104,062 137,541 22,278 159,819 2.0 3.1 1985 107,726 140,566 23,360 163,926 2.1 3.2 1986 116,949 149,476 24,439 173,915 2.3 3.4 1987 128,253 160,358 26,203 186,561 2.5 3.6 1988 136,177 167,837 28,369 196,206 2.7 3.8 1989 142,016 173,576 30,527 204,103 2.8 4.0 1990 150,644 181,109 33,462 214,571 2.9 4.2 1991 160,641 189,649 36,553 226,202 3.1 4.4 1992 169,525 198,898 40,343 239,241 3.3 4.6 1993 180,103 208,865 44,507 253,372 3.5 4.9 1994 189,014 217,154 48,915 266,069 3.6 5.1 1995 196,705 224,995 53,464 278,459 3.8 5.3 1996 222,746 249,885 58,838 308,723 4.2 5.9 1997 237,695 265,794 64,498 330,292 4.5 6.3 1998 249,628 276,781 70,252 347,033 4.7 6.6 1999 256,276 287,681 75,741 363,422 4.8 6.8 2000 259,361 296,924 81,238 378,162 4.9 7.1 2001 258,630 308,674 87,273 395,947 4.8 7.4 2002 266,729 321,794 93,537 415,331 5.0 7.7 2003 265,424 331,506 99,183 430,689 4.9 8.0 2004 271,211 337,802 104,234 442,036 5.0 8.2 2005 267,604 343,367 108,728 452,095 4.9 8.4 2006 270,051 350,436 112,799 463,235 5.0 8.5 2007 278,096 360,902 116,798 477,700 5.1 8.8 2008 298,490 378,665 119,297 497,962 5.5 9.1
Sources: For foreign nationals, immigrants and second generation immigrants: Statistikbanken, Table BEF3. For calculating the totals as percentages of the entire population: Statistikbanken, Table BEF1A. For 2007-2008: KRBEF3 and BEF1A07.
following countries: Turkey, Pakistan, Yugoslavia, Poland, the Soviet Union, Morocco, India, Vietnam, Chile and the Philippines. In 2008, the ten leading countries of origin were: Turkey, former Yugoslavia, Iraq, Lebanon, Pakistan, Somalia, Iran, Vietnam, Afghanistan and Sri Lanka (Danmarks Statistik 2008). As mentioned previously, Poland was included in the group of Western countries as from 1 January 2005.
Figure 1.2. Number of immigrants and second generation immigrants from Western and non-Western countries, 1980-2008.
0 50.000 100.000 150.000 200.000 250.000 300.000 350.000 400.000 1980 1982 1984 1986 1988 1990 1992 1994 1996 1998 2000 2002 2004 2006 2008 Western Non-Western
Notes: All the present 27 EU member states are counted as Western countries. Source: Statistikbanken, BEF 3 and KRBEF 3.
1.3. Naturalisation
As can be seen in Table 1.1, there was a fall in the number of Turkish nationals in 2000. This fall occurred after a steady increase in numbers over the previous decades, while in contrast the number of Pakistani nationals has varied little over the past thirty years. As mentioned previously, however, such changes cannot necessarily be seen as indications of the true size of these national groups, but may equally well be a reflection of a difference in the propensity of various national groups to become naturalised Danish citizens.
Until 1 July 2002, the main requirements for adopting Danish citizenship were as follows:
Nationals of the Nordic countries were required to have been legally resident in Denmark for an unbroken period of at least two years. Citizens of other countries had to have had at least seven years of residence, though this was reduced to six years in the case of refugees and stateless persons.
Since July 2002, however, significantly more stringent requirements have been applied for obtaining Danish citizenship. For example, foreigners are now required to have been resident in Denmark for at least nine years, or eight years in the case of refugees. This period is reduced, however, for the spouses of Danish citizens. A criminal record or outstanding debts to the public purse can prevent or delay naturalisation. Finally, it is a condition for naturalisation that the applicant can participate with ease in a general conversation in Danish. Foreign nationals who have lived in Denmark as children and who fulfil certain requirements with respect to length of residence can obtain Danish citizenship by a simple declaration. All that is required of the person concerned is that after reaching the age of 18, but before the age of 23, he or she should make a declaration to the local authorities of a wish to become a Danish citizen. However, since mid-2004 this rule has only applied in the case of citizens of Nordic countries and of former Danish citizens.
With effect from 2006, the requirements for obtaining Danish citizenship have been tightened up even further. The requirements concerning proficiency in the Danish language have been increased, and applicants must also pass a test in Danish history, culture and society. Finally, the applicant must have been self-supporting in four out of the previous five years.
It should be noted that naturalisation, in addition to changing the distribution of foreign nationals by country, may also affect the categorisation of a person as immigrant, second generation immigrant or Dane in the classification of the population. For example, if a second generation immigrant is naturalised, the status of any children that person may have will change from being second generation immigrants to being Danes – that is, if they are not already Danes by virtue of their other parent being a Danish national born in Denmark.
There were around 3,000 to 4,000 naturalisations per year in the period from 1980 to 1990, and this increased to around 5,000 to 6,000 annually during the years 1991 to 1997. The numbers then increased in each of the following three years, the annual total reaching a peak of just under 19,000 in 2000 before falling back to around 12,000 in 2001. In 2007 fewer than 4,000 people were naturalised. The general increase in the number of people changing their nationality from a foreign citizenship to Danish is associated with an increase in the size and a change in the composition of the immigrant population. In the 1980s, a larger number of refugees came to Denmark than previously, and they had a greater propensity to seek Danish nationality than the foreign nationals who were already in the country. The increased numbers of naturalisations after the mid-1990s were from among nationals of Turkey, Iran, Iraq, and Somalia, and from among Lebanese and the stateless. Western citizens have a limited propensity to seek Danish nationality.
Pedersen (2000) studied the proportions of naturalised Danes in a given year in comparison with the number of citizens entitled to acquire Danish nationality in 1991 and 1997. These naturalisation percentages, with equivalent calculations for 1999 and 2000, are shown for selected countries in Figure 1.3 (Larsen and Matthiessen 2002).
Figure 1.3. Percentages of naturalised nationals from selected countries for the years 1991, 1997, 1999 and 2000.
0 5 10 15 20 25 30 35 40 45 Form er Yu gosla via Iran Lebano n and statel ess Paki stan Polan d Som alia Turk ey Vietnam Othe r non -We stern Wes tern All n on-We stern P e rcent 1991 1997 1999 2000
Source: Pedersen (2000) and Larsen and Matthiessen (2002).
As can be seen from Figure 1.3, the percentages of those naturalised were greater in 1991 than in 1997 for most groups, but there was an increase in 1999 and 2000. In 1991 the proportions were especially high for immigrants from Iran, Lebanon (including the stateless), Vietnam and – to a lesser degree – from Poland. The people involved were often refugees who came to Denmark during the 1980s and who applied for citizenship relatively soon after they became entitled to do so. In 1997 the proportion was highest for foreign nationals from Iran and Lebanon (including the stateless), and these categories were also the largest in 1999 and 2000. In comparison, the naturalisation percentages among nationals from the original “guest worker” source countries – Turkey, the former Yugoslavia and Pakistan – are much smaller. In 1991 a greater proportion of Pakistani nationals were naturalised than Turkish nationals, but this relationship had changed by the end of the 1990s. This change can explain the fall in the number of residents with Turkish citizenship; see Table 1.1.
Changes in the propensity to remigrate out of Denmark may also be a factor, as the next section explains.
1.4. Remigration
The effects of immigration on the size and composition of the population of Denmark are partly dependent on the number of immigrants who remigrate. If one considers only those who retain their foreign nationality, then there is a significant level of remigration among people from Western countries (Pedersen 1999). Of immigrants from the Nordic countries, the EC/EU and North America who came to Denmark in 1977 and 1990, between two thirds and nine-tenths had remigrated after five years. This ties in well with the low propensity of people in this group to seek Danish nationality.
Remigration is much less frequent among immigrants with Turkish nationality; of those who immigrated to Denmark in 1977, only 14% remigrated within the next five years. For Yugoslav and Pakistani nationals the corresponding figures were 24% and 26% respectively. Remigration was even less frequent among those who immigrated in 1990, and this situation does not appear to have changed in the course of the 1990s.
The relatively large increase in the number of Turkish nationals in comparison with citizens of other countries during the period from 1974 to 2000 can be explained in part by the lower propensity to remigrate, while the fall after 2000 can be attributed to the greater number of naturalisations.
1.5. Gender and age distributions
The immigrant population is in general younger than the population as a whole. As of 1 January 2008, there was a greater percentage of the male immigrant population in each 5-year age band for groups up until the age of 50 than was the case for the whole male population of Denmark, and the same was true up to the age of 45 for females. This overall picture, however, conceals the fact that among Western immigrants and second generation immigrants there are relatively fewer people of ages up to twenty than is the case for non-Western immigrants and Danes. In the age range 20-59, the proportion of male Western immigrants and second generation immigrants is greater in each age band than for the population as a whole, and, with a couple of minor exceptions, the same is true for the proportions of Western women right up to the age of 85. For non-Western immigrants and second generation immigrants, the proportions are below the average from age 45 upwards.
While a little over half the entire population is female (50.5%), the proportion is only 50% for the non-Western immigrant and second generation immigrant
population. In contrast, 51.4% of Western immigrants and second generation immigrants are women.
With respect to patterns of place of residence, there are differences between the non-Western immigrant community on the one hand and the Western immigrants and Danes on the other. The largest percentage of non-Western immigrants and second generation immigrants live in the larger urban areas and the smallest percentage in country districts, while Western immigrants and second generation immigrants are more evenly spread over the country, and a majority of Danes live in small provincial towns and in rural districts.
1.6. Fertility
There are marked differences in fertility between Danes and immigrants from Western and non-Western countries. In the period 2002-2006 the fertility rate for Danish women was 1.75 children each, while the figures for Western and non-Western immigrant women were 1.53 and 2.34 respectively. Women from Somalia gave birth to an average of 4.43 children, while the fertility rates for women from Pakistan, Turkey and the former Yugoslavia were 3.10, 2.20 and 2.17 children respectively. The fertility rates for nationals of Pakistan and Turkey were 4.44 and 3.50 children per women in 1990, significantly higher than in 2002-2006. There was thus some convergence with the fertility rates for Danish women, which increased slightly over the same period.
Pedersen (2000) analysed fertility among immigrant women by country of origin and age at the time of immigration for the period 1994-1998, using data from the Danish National Board of Health on births, combined with information about the women from Statistics Denmark. This analysis showed that age at the time of immigration had great significance for the number of children born by non-Western women. Pedersen distinguishes between women who immigrated when they were between 18 and 49 years old and those who were under 18 years of age. Those women who came to the country as adults had a markedly higher level of fertility than women who had lived in Denmark for all or most of their childhood. For all non-Western women the figures were 3.2 and 2.4 children for the two age groups respectively. For Turkish women the figures were 4.9 and 2.5, and for Pakistani women 5.6 and 2.7. Thus this study again shows a convergence towards the fertility rates of the receiving country.
The overall fertility rate for the total population of Denmark in 2007 was 1.85 children per woman and was thus not at a level that would sustain the size of the population in the long term without further immigration. The level that is required to sustain the population is today just under 2.1 children per woman (Matthiessen 2007).
1.7. Immigration of labour, family reunification and refugees
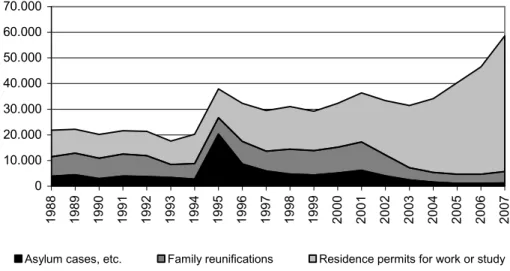
The structure of immigration has changed since the first guest workers came to Denmark in the 1960s. This change is evident from Figure 1.4, which shows the number of residence permits granted during the period 1988-2007 grouped by basis for the granting of the permit (1988 is the first year for which there are statistics available for residence permits granted on the basis of family reunification).The three categories for granting a residence permit are work and study, family reunification and asylum.
Figure 1.4. Number of asylum cases, family reunifications and work or study permits in relation to the total number of residence permits granted, 1988-2007. 0 10.000 20.000 30.000 40.000 50.000 60.000 70.000 198 8 198 9 199 0 199 1 199 2 199 3 199 4 199 5 199 6 199 7 199 8 199 9 200 0 200 1 200 2 200 3 200 4 200 5 200 6 200 7
Asylum cases, etc. Family reunifications Residence permits for work or study Note: From May 2000 onward it has been a requirement that children of foreigners with residence permits, including children born in Denmark, must have their own separate residence permits; these children’s permits are not included in the figures. Around 2,550 and 2,237 such children’s permits were issued for the years 2000 and 2001 respectively (Udlændingestyrelsen 2002b). Sources: For 1988-1995: Befolkningens bevægelser 1996, p.155; for 1995-2004: Statistiske Efterretninger: Befolkning og Valg "Asylansøgninger og opholdstilladelser 2004" 2005/12, pp. 2 and 9; for 2005: Statistiske Efterretninger: Befolkning og Valg "Asylansøgninger og opholdstilladelser 2005" 2006/10, pp. 2 and 9; for 2006-2007: Statistikbanken VAN6.
1.7.1. Permits for work and study
Until 1983, access to Denmark for foreign nationals was regulated on the basis of the Aliens Act of 1952. The Act originally allowed foreigners relatively free entry to the country to apply for work and residence permits. A halt to immigration was introduced as a result of the oil crisis in 1973. However, this did not apply to citizens of the Nordic countries, who were covered by a joint Nordic agreement of 1954 allowing free movement of labour; nor did it apply to
citizens of European Community member states, Denmark having become an EC member in 1973.
The restrictions on the immigration of labour were retained in the Aliens Act of 1983. The 10,400 work and study permits granted in 1988 were divided fairly equally between residence granted on the basis of a European Community nationality, permits in connection with employment, and residence permits in connection with study or work as an au-pair. After remaining at a fairly constant level, the number of these permits increased after the mid-1990s to reach 53,000 in 2007, a five-fold increase, accounting for 90% of the residence permits granted.
1.7.2. Family reunification
An Act of Parliament of 1983 introduced a legal right to family reunification with children, spouses and parents. The number of family reunification permits granted in 1988, the first year for which separate records were kept, was just under 8,000. Apart from dips in 1993 and 1997, the number steadily increased up until 2001, when just under 11,000 such permits were granted. Except in the year 1995, the number of family reunifications accounted for between a quarter and a third of the total number of residence permits granted.
An important factor to note in connection with the number of family reunifications is that in 1998 around 90% of all married or cohabiting immigrants from the former Yugoslavia, Pakistan, Somalia, Turkey and Vietnam had compatriots as their partners. The figure for non-Western immigrants as a group was 75%, compared with just 13% for Western immigrants and second generation immigrants. Family reunification with spouses might either have been related to reuniting couples who were married before one spouse came to Denmark, or be a matter of the creation of new families as a result of an immigrant or second generation immigrant living in Denmark finding a spouse in his or her home country. Among young immigrants and second generation immigrants without Danish citizenship aged 18 to 25 with at least ten years of residence in Denmark, around 70% of both men and women from the former Yugoslavia and Pakistan, and 90% of men and 80% of women from Turkey, had found spouses in their home countries. For young non-Western males of all nationalities taken together the figure was 80%, and for women it was 70%. It is possible to get an impression of the number of spousal family reunifications that are related to the reuniting of long-time spouses and how many involved the formation of new families by looking at the date of the marriage. If the limit for the cases which can be considered as creating new families is set to marriages taking place less than a year before, or less than six months after the time of immigration, then almost 30% of married non-Western men and nearly 50% of
women who arrived in Denmark can be defined as coming to the country in connection with the establishment of new families.
After 2001 the number of family reunifications fell dramatically, with the result that the figure in 2007 was a little over 4,500, accounting for barely 8% of the total number of residence permits issued. This development was primarily due to a revision of the Aliens Act in 2002 which made it more difficult to obtain permits for family reunification (Bauer, Larsen and Matthiessen, 2004b). The requirements under the existing rules were tightened up, both with respect to demonstrating that one could provide for a spouse financially and with regard to the groups of people covered by the regulations. In practice, the rules were not previously applied to Danish citizens, nationals of other Nordic countries, and refugees; but they are now. Previously, immigrants who were not Danish citizens or refugees were required to have had a permanent residence permit for at least three years before they could bring a spouse of partner to join them in the country. Now it is a requirement that the person should have been legally resident for a period of seven years before a permanent residence permit can be granted. In addition, it is no longer permitted for parents of adult children living in Denmark to come to the country under the family reunification system. The right to family reunification with spouses has been scrapped for people under the age of 24, with the stated aim of preventing pro forma and forced marriages. Finally, the total connection to Denmark of the two spouses taken together must be stronger than their connection to any other country.
1.7.3. Refugees
The total number of spontaneous asylum applications has shown great variation for the years since 1980, although it rose steadily up until the turn of the millennium. Spontaneous asylum applications are defined as those actually handled in Denmark. The fluctuations in the figures reflect both alterations to the law and changes in the size of the flow of refugees caused by wars. Having remained in the low hundreds for each year from 1980 to 1983, the total figure rose after the changes in the law in 1983 to over 9,000 in 1986, when the legislation was revised once more in the light of the large influx. These changes placed additional limitations on the right to enter and reside in Denmark while the application for asylum was processed: in part because of the introduction of an administrative rejection procedure on the grounds of an application being “clearly groundless” (a procedure which cannot be appealed if the Danish Refugee Council supports the decision of the Danish Immigration Service); and in part because of the possibility of sending refugees back if they had come to Denmark via another EU country or other secure country (Bauer, Larsen and Matthiessen, 2004b). The number of spontaneous asylum seekers fell to under 3,000 in 1987 before rising again to around 5,000 annually in the period 1988 to 1991. The civil war in the former Yugoslavia was partly responsible for a sharp increase in asylum seekers to 14,000 in both 1992 and 1993. In the period 1994
to 1999 the annual total of asylum seekers was between 5,000 and 6,000. It then rose to 8,000-10,000 in the years 2000 and 2001 before dropping dramatically, bringing the numbers right down to a little over 1,000 in 2007 (Statistikbanken VAN5). The present low number of asylum seekers can be explained in part by the general fall in the numbers coming to Europe from refugee-producing countries.
There is naturally a close connection between the number of applications for asylum made in Denmark and the number of residence permits granted in asylum cases. The large number of residence permits granted in asylum cases in 1995 was due first and foremost to the large number of people from the former Yugoslavia who were awarded permanent resident status. The reduction in the number of asylum seekers since 2002 has also been accompanied by a fall in the number of permits issued, with the result that the total of permits in 2007 only reached just over 1,000 (Statistikbanken VAN6). Another contributory cause of the fall was the abolition of the concept of “de facto” refugees in 2002, that is to say refugees who, unlike “Convention” refugees, did not meet the conditions laid down in the UN Convention on Refugees.
1.7.4. Annual asylum statistics and longitudinal analyses
It is not possible to state very accurately the proportion of asylum applications processed in a given country that actually result in the award of a residence permit, let alone to begin to make comparisons between countries, simply on the basis of the asylum statistics for a given year or years. Nevertheless, the UN High Commission for Refugees has attempted to do this using statistics for the calendar years 1998 and 1999. The Commission’s figures place Denmark ahead of comparable countries such as Norway, Sweden, Germany and the Netherlands, both in terms of the proportion of completed cases that end with the award of residence status, with rates of 54.5% and 51.8% for the two years in question, and in terms of the award of Convention Refugee status (UNHCR 1999 and 2000). In the case of Denmark, there must be added the many more people with de facto refugee status who have also achieved an approximately similar final result. An analysis in which all asylum seekers from 1998 are traced individually until the resolution of their cases shows that 70% of those whose cases were actually processed in Denmark were granted the right of residence in the country (Udlændingestyrelsen 2002b).
The Danish Immigration Service and the corresponding German institution have provided access to unpublished figures in order to allow a comparison for three selected nationalities of asylum seekers – Afghans, Iraqis and Sri Lankans. The situation as of 31 December 2000, when 21% to 31% of the German cases as opposed to 1% of those in Denmark were still unresolved, suggested that unless all the pending cases in Germany ended with the granting of residence permits,
the percentage of refugees in Denmark who were granted permits was relatively high.
1.8. Summary
Up until the year 1960, the flow of emigrants from Denmark exceeded the number of immigrants to the country. In the course of the 1960s the situation changed to one of net immigration, and Denmark began to receive immigrants from non-Western countries. Until the suspension of immigration in 1973 these were primarily guest workers from Turkey, Yugoslavia and Pakistan, and subsequently most immigration came as the result of family reunification and, later, of the arrival of refugees.
On 1 January 2008 the total of immigrants and second generation immigrants residing in Denmark was 498,000, or 9.1% of the population. Of these, 290,000 were foreign nationals, corresponding to 5.5% of the population. In 1980 the corresponding figures were 3.0% and 1.9% respectively. While in 1980 a slight majority of immigrants and second generation immigrants were from Western countries, only 30% of the immigrant population fall into this category today. The five largest nationalities in the immigrant population from non-Western countries in 2008 are Turks, people from the former Yugoslavia, Iraqis, Lebanese and Pakistanis.
The fact that the number of people with a foreign background – immigrants and second generation immigrants – exceeds the number of foreign nationals is due to naturalisation. It is primarily people from non-Western countries who have become naturalised Danes. In line with the fact that relatively few immigrants from Western countries seek naturalisation, the majority of people in this category eventually emigrate again.
In general, the immigrant population is younger than the population as a whole, whereas the distribution between the genders is essentially the same for all groups. The greatest proportion of non-Western immigrants and second generation immigrants live in large towns and the smallest proportion in rural areas, while Western immigrants and second generation immigrants live more evenly spread across the country.
During the period 2002 to 2006 the fertility rate for Danish women was an average of 1.8 children per woman. For women from Western and non-Western countries living in Denmark the rates were 1.5 and 2.3 children respectively, though with considerable differences between countries of origin in the latter group. More detailed analyses suggest a gradual trend in the direction of convergence with the fertility rate of the host country.
The total number of spontaneous asylum seekers has shown great variation from year to year for the period since 1980, but with an overall rising trend up until the turn of the millennium. An increase to 8,000-10,000 in 2000 and 2001 was followed by a sharp decline, which has brought the figure down to a little over 1,000 in 2007. In parallel with these changes, the number of residence permits issued to asylum seekers in 2007 also totalled just over 1,000.
The number of family reunifications showed a rising trend from 1988 – the first year for which figures were recorded – to 2001, when almost 11,000 permits were granted. After this there was a sharp fall in the numbers, so that the total in 2007 was a little over 4,500. This reduction was due primarily to the introduction of more stringent regulations for obtaining permission for family reunification, as well as a reduced number of refugees.
After 1988, the number of work and study permits issued increased from just over 10,000 to more than 53,000 in 2007, accounting in that year for 90% of the total residence permits issued.
An analysis in which all asylum seekers from 1998 are traced individually until the resolution of their cases shows that 70% of those whose cases were actually processed in Denmark also received the right of residence in the country.
References
Bauer, Thomas, Claus Larsen and Poul Chr. Matthiessen. 2004a. “Immigration Policy and Danish and German Immigration”, in Torben Tranæs and Klaus F. Zimmermann (eds), Migrants, Work, and the Welfare State. Odense: University Press of Southern Denmark.
Bauer, Thomas, Claus Larsen and Poul Chr. Matthiessen. 2004b. “Indvandringspolitik og indvandringen til Danmark og Tyskland”. Nyt fra Rockwool Fondens Forskningsenhed, October 2004. Copenhagen: Rockwool Foundation Research Unit.
Danmarks Statistik. Befolkningens Bevægelser 1996. Copenhagen. Danmarks Statistik. 2005. Befolkningens Bevægelser 2004. Copenhagen. Danmarks Statistik. 2005. “Asylansøgninger og opholdstilladelser 2004”.
Statistiske Efterretninger: Befolkning og Valg. Copenhagen.
Danmarks Statistik. 2006. “Asylansøgninger og opholdstilladelser 2005”.
Statistiske Efterretninger: Befolkning og Valg. Copenhagen.
Danmarks Statistik. 2008. “Udenlandske statsborgere, personer født i udlandet samt indvandrere og efterkommere 1. januar 2008”. Statistiske Efterretninger, Befolkning og Valg 2008/4. Copenhagen.
Larsen, Claus and Poul Chr. Matthiessen. 2002. “Indvandrerbefolkningens sammensætning og udvikling i Danmark”, in Gunnar Viby Mogensen and Poul Chr. Matthiessen (eds), Indvandrerne og arbejdsmarkedet. Copenhagen: Spektrum, 25-79.
Matthiessen, Poul Chr. 2007. Befolkning og Samfund. Copenhagen.
Pedersen, Søren. 1999. “Vandringen til og fra Danmark i perioden 1960-1997”, in David Coleman and Eskil Wadensjö with contributions by Bent Jensen and Søren Pedersen, Indvandringen til Danmark. Copenhagen: Spektrum, 233-284. Pedersen, Søren. 2000. “Indvandrernes demografiske forhold”, in Gunnar Viby Mogensen and Poul Chr. Matthiessen (eds), Integration i Danmark omkring årtusindeskiftet. Aarhus: Aarhus University Press, 27-47.
Tænketanken om udfordringer for integrationsindsatsen i Danmark. 2002.
Udlændingestyrelsen. 2002a. “Nøgletal på udlændingeområdet 2001”. Copenhagen.
Udlændingestyrelsen. 2002b. “Ny type statistik på asylområdet: Forløbsanalyser i spontane asylsager”. U S Statistik serie nr. 1. Copenhagen.
UNHCR (United Nations High Commissioner for Refugees). 1999. Refugees and Others of Concern to UNHCR. 1998 Statistical Overview. Geneva.
UNHCR (United Nations High Commissioner for Refugees). 2000. Refugees and Others of Concern to UNHCR. 1999 Statistical Overview. Geneva.
2.
The various stages of the research and the datasets used
2.1. Introduction
The previous chapter showed the development in and nature of immigration to Denmark since the 1960s, the time when immigration to Denmark began to exceed emigration from the country, and showed how immigration altered both in extent and nature. It was against the background of these changes that, in 1997, the Rockwool Foundation decided to give high priority to “Immigrants and their conditions of life” as one of the topics which they sought to investigate through research projects, in order to provide a solid and detailed basis of knowledge to be used for political decision-makers.
Key questions to be addressed by this research concerned the interface between immigrants and second generation immigrants on the one hand and Danish society on the other, as well as the influence this relationship had on the conditions of life for immigrants and second generation immigrants. The process of integration into the Danish labour market was a significant factor in this context. The previous experience from the research at the Rockwool Foundation Research Unit and the abundant statistical data available in this area provided a good basis for this research.
A pilot project was conducted in 1998-99 with the participation of international experts. It was intended that this project should give a broader background picture of the nature of immigration in the form of, for example, analyses of the global demographic situation. The results from this study were published in 1999 in a book by David Coleman and Eskil Wadensjö, which appeared in Danish as Indvandringen til Danmark. Internationale og nationale perspektiver
(Spektrum) and in English as Immigration to Denmark. International and national perspectives (Aarhus University Press).
In the first three chapters of the book Dr Coleman, of the University of Oxford, described immigration to Denmark in an international perspective. Chapter 1 described and analysed the contemporary global and European demographic processes, and how these affected Denmark. In Chapter 2 there were analyses of the structure of and trends in recent migration, with particular emphasis on the situation in Europe. Finally, Chapter 3 presented the policies introduced by various European countries to regulate migration and to find solutions to the new problems created by the arrival of large numbers of immigrants who came primarily from non-European countries.
Professor Eskil Wadensjö of the University of Stockholm contributed a special chapter on the socioeconomic consequences of immigration. The analyses were
based primarily on the Danish “Law Model”, which is described further in section 2.2.5.
In Chapter 4, Søren Pedersen (MSc) presented a statistical overview of the extent and composition of immigration to Denmark and of the integration of immigrants into the labour market. Finally Bent Jensen (MA) devoted two chapters to describing how major Danish newspapers had treated the topic of immigration over the previous decade.
2.2. The 1999 study 2.2.1. Introduction
The 1999 study, published in Danish as Gunnar Viby Mogensen and Poul Chr. Matthiessen (eds) (2000), Indvandringen til Danmark omkring årtusindeskiftet
(Immigration to Denmark around the turn of the millennium) (Aarhus University Press), aimed to discover new information about immigrants and their conditions of life, with special emphasis on the process of integration into the Danish labour market. “Integration into the labour market” was understood as relating to the extent to which immigrants were not only part of the labour force, but actually had jobs.
Among the conditions of life that formed part of the study, emphasis was placed first of all on three factors of clear relevance for employment, namely knowledge of the Danish language, education, and health. Secondly, the relationship of immigrants to the social welfare system was also taken into account. This was an area of particular interest, in that the Danish welfare system supported a number of unemployed people through social security payments (as opposed to unemployment benefits), and these were people who might later have a formal relationship to the labour market. A third area studied was one which has a very real, if less clear cut, relationship to employment status: crime.
Furthermore, attempts were made in the data collection process to cover a number of aspects of social relevance which were slightly more difficult to measure. Among these aspects were perceptions and experiences of relationships between different population groups, including discrimination towards immigrants in Denmark and opinions concerning how open the country should be to continued immigration.
Finally, the study had the aim of determining the economic consequences of immigration for Denmark, including the effects on the Danish welfare system of redistribution of wealth through public finances.
2.2.2. The questionnaire survey
The first source of new knowledge about immigrants and second generation immigrants was a questionnaire survey – referred to below as the main survey – which was based on 3,615 interviews conducted between November 1998 and July 1999 among non-Western immigrants and second generation immigrants of eight different nationalities (Nielsen and Pedersen, 2000). Respondents were selected from among immigrants and second generation immigrants between the ages of 16 and 70 who had been resident in Denmark for at least two years. The eight national groups – people from the former Yugoslavia, Iran, Lebanon, Pakistan, Poland, Somalia, Turkey and Vietnam – were the largest groups of non-Western immigrants in the Danish population at that time. People from these countries accounted for 66% of the non-Western immigrants and second generation immigrants living in Denmark. As mentioned previously, Poles have been categorised as Western immigrants since 1 January 2005 as a result of the accession of Poland to the EU in 2004.
The interviews were conducted by bilingual interviewers, so that respondents had the choice of being interviewed either in Danish, or in the language of their national group (or English). The use of bilingual interviewers meant that it was possible to assess the respondents’ Danish language proficiency.
Interviewers were recruited through advertisements at various educational institutions in the Copenhagen area, advertisements on the Internet, contact with schools of interpreting, and contacts with interviewers already permanently employed at Statistics Denmark. Approximately 75 applicants for the posts were interviewed, and 28 of these were selected, providing at least two interviewers per national group. The interviewers were then involved in the process of translating the questionnaire into the relevant languages. Some of the translations were actually made by the interviewers themselves, and the remainder by external consultants. The translated versions of the questionnaire were then given to all the interviewers for their comments, and the forms revised in the light of these.
The respondents were all sent a letter in advance that explained about the survey and informed them that they would be contacted for a telephone interview in the near future. At the outset, an attempt was made to obtain telephone interviews with all the selected respondents. However, this proved to be impossible, as it was often difficult to obtain the necessary telephone numbers. It was therefore necessary to supplement the telephone interviews with visits in person in order to obtain a sufficiently high response rate for each of the eight nationality groups. For example, it was possible to obtain telephone numbers for only 62% of the Somalis in the sample.
Where it was possible to carry out telephone interviews, the CATI method (Computer Assisted Telephone Interviewing) was used; interviewers read out the questions from their computer screens and entered the responses as they were given.
Table 2.1. Respondents in the main survey distributed by interview language and national origin. Percent.
Former Yugo-slavia
Iran Leb-anon Pakis-tan Poland Som-alia Turkey Viet-nam All Own language1 2 75.3 58.0 82.4 42.1 58.9 96.3 78.0 48.2 65.5 Danish 24.7 42.0 17.6 57.9 41.1 3.7 22.0 51.8 34.5 Total 100.0 100.0 100.0 100.0 100.0 100.0 100.0 100.0 100.0 --- Number of respondents--- 489 410 421 430 438 410 565 452 3,615
1Respondents’ own language was defined as: for the former Yugoslavia: Serbo-Croat; for Iran: Persian (Farsi); for Lebanon: Arabic; for Pakistan: Urdu/Punjabi; for Poland: Polish; for Somalia: Somali; for Turkey: Turkish; and for Vietnam: Vietnamese.
2Two people, one from the former Yugoslavia and one from Pakistan, were interviewed in English. Source: Rockwool Foundation Research Unit interview surveys of 1999 conducted among immigrants and second generation immigrants in Denmark.
In the case of interviews conducted at the place of residence, interviewers brought a laptop computer and similarly read the questions direct from the screen. This meant that the interview format remained consistent whatever language was used. The telephone interviews took an average of around 25 minutes each, but for technical reasons it was not possible for Statistics Denmark to record interview times for interviews conducted in person.
As can be seen from Table 2.1, the majority of the interviews were conducted in the respondents’ own languages. However, the proportions of interviews conducted in Danish varied significantly from one national group to another. The largest proportion to be interviewed in Danish was among Pakistani respondents. The lowest proportion was among the Somalis: only 3.7% were interviewed in Danish.
Using the Danish Civil Registration Number system, information about the respondents in the sample from a number of different official registers containing data on, for example, gender, age, education, income, employment, social security payments, criminal record and use of the health services was linked to the interview responses. The whole survey was, however, conducted on the basis of anonymised data, so that no individual could be identified.
The Danish Civil Register was introduced in 1968 and contains information on all residents of Denmark, including name, address, gender and marital status. Each person in the register is allocated a 10-digit identification number. The Register is constantly kept up to date through the entry of live births, deaths, immigration and emigration, marriages and divorces. This means that there is a precise census of the Danish population available in electronic form at any time. In addition, there are a number of registers, covering various aspects of life such as education, work, income, unemployment, crime, and use of the social services, which use the Civil Registration Numbers of the individuals entered in the register. By using the Civil Registration Numbers, then, it is possible to combine information about a given individual from a variety of registers.
The main results of the survey are presented in statistical format in Table 2.2, displayed by country of origin. As can be seen from the table, the response rate varied considerably from country to country, from 46.4% for Somalia to 63.6% for Vietnam. The overall response rate for the survey was 57.8%, meaning that interviews were not obtained for 42.2% of the selected random sample. In comparison with other equivalent surveys conducted by means of interviews with immigrant groups, a response rate of 57.8% seems to be the norm (Togeby, 1999; Gulløy et al., 1997).
Given the fairly considerable non-completion rate, it is difficult to estimate the extent to which non-completion influenced the degree to which the respondents could be said to be a representative sample of the non-Western immigrant and second generation immigrant populations from the eight selected countries. In principle, we would wish to determine whether the responses to any given question (the dependent variables) were distributed in a manner equivalent to the distribution that would have been obtained if the whole population of immigrants and second generation immigrants from the eight countries had been asked the question. Since this is in the nature of things an impossibility, a check was instead made of how the respondents in the sample were distributed according to the main background variables (the independent variables) such as gender, age, geographical distribution and personal income. If these independent variables were distributed for the people who completed interviews consistently with the distribution of the same variables for the whole of the population in question, there would be reason to assume that the respondents in the sample did not differ substantially in their responses from those the entire population would have given.
A comparison of the sample and of the whole population of immigrants and second generation immigrants from the eight countries showed approximately the same distribution with regard to gender, age, marital status, labour market status and income. Deviations were found in certain variables, for example an under-representation of single people and people from the Copenhagen area in the sample, and a slight over-representation of wage earners.
Table 2.2. Response rates etc. of the main survey.
Total random sample size
Interviews conducted Not completed Completion rate Refusalrate1
Tele-phone
Visit Total
Re-fused1 Other Total
--- Number of persons--- --- percentage --- Former Yugoslavia 837 463 26 489 87 261 348 58.4 14.1 Iran 712 328 82 410 48 254 302 57.7 11.8 Lebanon 711 340 81 421 40 250 290 59.2 9.7 Pakistan 709 333 97 430 32 247 279 60.6 8.0 Poland 710 425 13 438 61 211 272 61.7 11.8 Somalia 884 363 47 410 54 420 474 46.4 11.5 Turkey 983 456 109 565 75 343 418 57.5 12.8 Vietnam 711 420 32 452 31 228 259 63.6 5.9 Total 6,257 3,128 487 3,615 428 2,214 2,642 57.8 10.9
1 Based on telephone interviews only.
Source: Rockwool Foundation Research Unit interview surveys of 1999 conducted among immigrants and second generation immigrants in Denmark.
In the group of 428 people categorised as having refused to be interviewed, only just over 50% actually refused, while the rest of the group could not be interviewed because of changes of address or language problems.
Table 2.2 above shows how many interviews were completed, and how large the sample was for each of the eight immigrant groups. The relative sizes of the samples were determined primarily on the basis of expectations – in part based on the experience from a survey in Norway (Gulløy et al., 1997) – of how large a completion rate could be expected for each group. This meant that the sizes of the samples were not proportionate to the sizes of the eight populations within the immigrant population as a whole. We are thus dealing with a stratified sample with eight strata. When results are reported for the whole sample in the following, the sample from each country is therefore weighted with its proportion in the entire population.
In many of the tables in the book, a special weighting is used with respect to gender and age for each of the immigrant groups. In order to be better able to compare the analyses for the immigrant groups with corresponding analyses for Danes, the immigrant groups were weighted by gender and age so that the