c
3D SCENE AND OBJECT PARSING FROM A SINGLE IMAGE
BY
CHUHANG ZOU
DISSERTATION
Submitted in partial fulfillment of the requirements for the degree of Doctor of Philosophy in Computer Science
in the Graduate College of the
University of Illinois at Urbana-Champaign, 2019
Urbana, Illinois Doctoral Committee:
Associate Professor Derek Hoiem, Chair Professor David Forsyth
Assistant Professor Alexander Schwing Dr. Alex Colburn, Amazon
ABSTRACT
The term 3D parsing refers to the process of segmenting and labeling the 3D space into expres-sive categories of voxels, point clouds or surfaces. Humans can effortlessly perceive the 3D scene and the unseen part of an object from a single image with a limited field of view. In the same sense, a robot that is designed to execute a few human-like actions should be able to infer the 3D visual world, from a single snapshot of a 2D sensor such as a camera, or a 2.5D sensor such as a Kinect depth equipment. In this thesis, we focus on 3D scene and object parsing from a single image, aiming to produce a 3D parse that is able to support applications like robotics and navigation.
Our goal is to produce an expressive 3D parse : e.g. , what is it, where is it, how can humans move and interact with it. Inferring such a 3D parse from a single image is not trivial. The main challenges are: the unknown separation of layout surfaces and objects; the high degree of occlusions and the diverse classes of objects in the cluttered scene; how to represent 3D object geometry in a way that can be predicted from noisy or partial observations, and can help assist reasoning like contact, support and extent. In this thesis, we put forward the hypothesis and prove in experiments, that a data-driven approach is able to directly produce a complete 3D recovery from 2D partial observations. Moreover, we show that by imposing constraints of 3D patterns and priors into the learned model ( e.g. , layout surfaces are flat and orthogonal to adjacent surfaces, support height can reveal the full extent of an occluded object, 2D complete silhouettes can guide reconstructions beyond partial foreground occlusions, and a shape can be decomposed into a set of simple parts), we are able to obtain a more accurate reconstruction of the scene and a structural representation of the object.
We present our approaches at different levels of detail, from a rough layout level to a more complex scene level and finally to the most detailed object level. We start by estimating the 3D room layout from a single RGB image, proposing an approach that generalizes across panoramas and perspective images, cuboid layouts and more general layouts (e.g. , “L”-shape room). We then make use of an additional depth image, explore at the scene level to recover the complete 3D scene with layouts and all objects jointly. At the object level, we propose to recover each 3D object with robustness to possible partial foreground occlusions. Finally, we represent each 3D object as a 3D composite of sets of primitives, recurrently parsing each shape into primitives given a single depth view. We demonstrate the efficacy of each proposed approach with extensive experiments both quantitatively and qualitatively on public datasets.
ACKNOWLEDGMENTS
First of all, I would like to thank my Ph.D. advisor Professor Derek Hoiem. Thanks for your continuous support of my research, especially when I was trying to work on something you didn’t believe in (and it always turned out that you’re right). Thanks for your patience, especially when I met obstacles in my research, or when it took longer time for me to understand your great point of view. I could not have imagined having a better advisor for my Ph.D. study. I’ve learned a lot from your sharp critics on research, your moderate ways of getting along with others not only in the research community but also in daily life.
I would also like to thank my Ph.D. committee members: to Professor David Forsyth, thanks for kindly offering vision lunch every week! I really admire your passion for research, your unique but inspiring research perspectives. I believe you’re the only CS Professor I know who is a tea expert. To Professor Alexander Schwing, though it was only a short time working with you, I really enjoyed talking to you and I felt honored to have you join our CVPR workshop organizer team! To Dr. Alex Colburn, I believe that the popularity of our proposed LayoutNet demonstrates the great cooperation between us.
I am grateful to my family members. Though living overseas, my parents always try their best to express their love and support to me through FaceTime and WeChat. My father, who is always busy in weekdays, often chooses to call me in weekends early in the morning to talk about his research and ideas or just random things. He never explicitly expresses his concerns for me, but be there and say nothing (alright I know you just don’t know what to say to encourage me properly). My mom spends more time with me. She shares tips to keep me healthy and always reminds me to be on time for everything. Sometimes we might have intense arguments. But I know that’s caused by some of my still existing immature characteristics (well most of us want to act like a child when we are with our family right? ). I hope My grandma is always happy. I like the piano melody she plays, which makes us calm. Also to my dear grandpa, although it’s still a long journey for me to keep up with your academic achievements (or maybe I never thought I could, I don’t want to compare myself with my elder generations but admire them), I hope my current performance will make you feel honored. I want to thank my boyfriend Dr. Yijun Li, who is also my precious family member. I feel lucky to have your support and encouragement during the last two years of my Ph.D. study – the most important and busiest period. I always know that you’re there aside and you are also working hard to achieve a similar goal to mine.
I would like to express my gratitude to my labmates of the University of Illinois at Urbana-Champaign (UIUC) vision group, and to my friends who have supported me along the way.
With a special mention to Zhizhong Li (I caught a lot of your snacks, they’re too sweet), Tan-may Gupta (please don’t say that the maple squash soup we tried in Boston tastes good), Aditya Deshpande (happy wedding!), Jae Yong Lee (your Chinese pronunciation is good), Rajbir Kataria (gentleman), Theerasit Issaranon (nice working with you), and to Daniel McKee, Mariya Vasileva, Unnat Jain, Aiyu Cui, Jeffrey Zhang, Anand Bhattad, and past graduates: P. Daphne Tsatsoulis, Saurabh Singh, Qieyun Dai, Kevin Shih, Joseph Degol, Arun Mallya, Bryan Plummer, Liwei Wang. Oh dear can I just make special thanks to everyone named on the UIUC vision webpage? It was fantastic to have the opportunity to work with you all. On becoming the “elder generation” of UIUC visionaries (to be honest I will never admit this), I hope the young generations can enjoy their research in this great lab.
I am also grateful to the Professors and collaborators who have appeared in my Ph.D. life: Pro-fessors Svetlana Lazebnik, Steve Lavelle, Doctors Qi Shan, Ersin Yumer, Jimei Yang and Duygu Ceylan.
And finally, thanks again for all your encouragement and support. As a summary, I shall say, with you all, my Ph.D. life becomes sparkling.
TABLE OF CONTENTS
CHAPTER 1 INTRODUCTION . . . 1
1.1 Overview . . . 1
1.2 Contributions . . . 3
1.3 Dissertation Outline . . . 6
CHAPTER 2 LITERATURE REVIEW . . . 7
2.1 Single Image 3D Reconstruction . . . 7
2.2 3D Layout from a Single Image . . . 8
2.3 3D Scene Parsing from a Single Image . . . 9
2.4 3D Object Parsing . . . 10
2.5 Relation to Our Work . . . 11
CHAPTER 3 MANHATTAN ROOM LAYOUT FROM A SINGLE RGB IMAGE . . . 14
3.1 Introduction . . . 14
3.2 Approach . . . 15
3.3 Manhattan Layout Optimization . . . 19
3.4 Extensions . . . 20
3.5 Experiment . . . 21
3.6 LayoutNet v2 . . . 27
3.7 Conclusion . . . 32
CHAPTER 4 COMPLETE 3D SCENE PARSING FROM A SINGLE RGBD IMAGE . . . 33
4.1 Introduction . . . 33
4.2 Detailed 3D Annotations for Indoor Scenes . . . 36
4.3 Approach . . . 39
4.4 Experiment . . . 45
4.5 Discussions . . . 57
4.6 Conclusion . . . 58
CHAPTER 5 SILHOUETTE GROUNDED POINT CLOUD RECONSTRUCTION BEYOND OCCLUSION . . . 59
5.1 Introduction . . . 59
5.2 Silhouette Grounded Point Cloud Reconstruction . . . 61
5.3 Reconstruction of Occluded Objects . . . 64
5.4 Experiment . . . 66
CHAPTER 6 GENERATING SHAPE PRIMITIVES WITH RECURRENT NEURAL
NETWORKS . . . 75
6.1 Introduction . . . 75
6.2 Fitting Primitives from Point Clouds . . . 77
6.3 3D-PRNN: 3D Primitive Recurrent Neural Networks . . . 80
6.4 Experiments and Discussions . . . 84
6.5 Conclusion . . . 89
CHAPTER 7 CONCLUSION AND FUTURE WORK . . . 91
7.1 Summary . . . 91
7.2 Future Work . . . 91
7.3 Conclusion . . . 93
CHAPTER 1: INTRODUCTION
1.1 OVERVIEW
Humans are able to perceive the 3D world from a single view. When we see a photo of the Vermeer’s music lesson in Figure 1.1, we know the 3D location of layouts such as walls, ceiling and floor, as well as the 3D shape of objects such as piano and painting. We can infer the spatial relationship between layouts and objects, e.g. , the piano is on the floor, near the back wall. We can also infer the 3D occupancy and free space inside the room. We are able to reason about the complete 3D shape of layouts and objects even they are partially occluded, e.g. , we know the complete shape of the piano, as shown in Figure 1.1, although the piano is partially occluded by the woman in front.
2D photo: Vermeer’s music lesson 3D perception
Figure 1.1: Illustrations. Humans can effortlessly understand the 3D scene from a 2D photo, and are able to infer the unseen parts of objects. Images are adopted from [1].
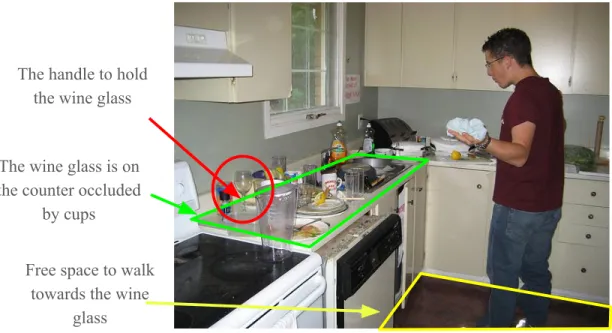
This inspires us to build up a vision system that is able to understand the 3D world from a single image, which is highly desirable in the scenarios of robotics and navigation. For example, in Figure 1.2, the cute robot is instructed to help pick up the wine glass in the messy kitchen. The limited free space in the kitchen prevents the robot from a complete 3D scan of the scene, and the robot would rather choose to rely on the 3D inference from a limited field of view, e.g. , a single snapshot of the kitchen. In response to the request, as illustrated in Figure 1.3, the robot first localizes the position of the wine glass in the kitchen, estimates free space in front and moves towards it, finds the handle of the wine glass and poses a correct hand gesture to pick it up. Those successive actions require the robot to be able to infer the physical shapes of objects, surfaces, and
Yes Sir!
Hey robot can you help pick up
the wine glass?
Figure 1.2: The cute robot is instructed to help pick up the wine glass on the counter in the messy kitchen.
the scene layout extent from sensors. Moreover, the robot should be able to understand what is in the scene and what could be done, and produce an expressive 3D parse that could support reasoning like support (e.g. , this table supports that mug) and interactions with humans or robots (e.g. , this is the chair seat that humans can sit on).
In this thesis, we aim to design a vision system that is able to infer the 3D visual world, from a single snapshot of a 2D sensor such as a camera, or a 2.5D sensor such as a Kinect depth equip-ment. However, inferring such a 3D parse from a single image is not always trivial. Generally, we face challenges in three folds: (1) how to infer the 3D room extent when the separation of layout surfaces and objects is unknown; (2) how to parse out the diverse set of objects, given the high degree of occlusions in cluttered scene; (3) how to represent 3D object geometry in a way that can be predicted from noisy or partial observations, and can help assist reasoning like contact, support and extent.
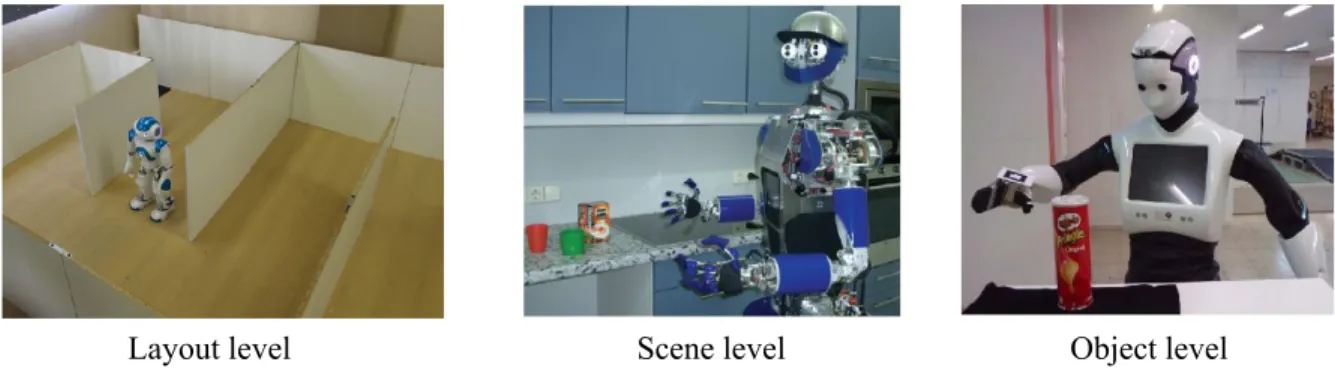
Instead of solving the whole task in one time, we explore the task at different levels of details, as shown in Figure 1.4. We start from the layout level to a more complex scene level and finally to the most detailed object level. At layout level, in order to infer the full extent of the scene, we estimate the 3D room layout and separate it from the foreground objects. Then, at the scene level, we jointly parse out the 3D extent of all objects and layouts in the scene, to localize every object and reason free space inside. At the object level, we reconstruct a complete 3D shape with robustness to possible partial foreground occlusions. Moreover, we further parse the object into
The wine glass is on the counter occluded
by cups
Free space to walk towards the wine
glass
The handle to hold the wine glass
Figure 1.3: To pick up the wine glass, given a single image, the robot needs to localize the wine glass occluded by plates and cups on the counter, identify free space in front and move towards the counter, then find the glass handle to pick it up. Those successive actions require 3D scene and object parsing from a single image.
structural and compact representations (primitives) to support the functional interactions such as grasping and manipulation. We propose, at each level, an approach with proved efficacy based on extensive experiments both qualitatively and quantitatively on public datasets.
1.2 CONTRIBUTIONS
We present contributions of our approaches of 3D scene and object parsing at different levels of details: the layout level, the scene level and the object level. Details are as follows.
3D scene layout from a single RGB image.The first problem to be solved in 3D scene parsing is to estimate the 3D extent of background room layout: what’s the scope of the scene? How high is the ceiling? How far are the walls? In 1999, Coughlan and Yuille [5] summarized the indoor scene statistics as “Manhattan world” assumptions: scenes were built on a Cartesian grid, as in indoor all walls are at right angles to each other and perpendicular to the floor. This representation makes up the loss of 3D geometry due to occlusions from objects in the scene, and is sparse and compact in representation that can speed up the reconstruction process. We propose LayoutNet [6], a more general RGB image to Manhattan layout algorithm that is suitable for both perspective and panoramic images. Our system compares well in speed and accuracy for panoramic images and
Layout level Scene level Object level
Figure 1.4: Three levels of details of 3D scene and object parsing from a single image. At layout level (left), we aim to parse out 3D layouts of wall, ceiling and floor to understand the full extent of the scene. At a more complex scene level (middle), we aim to have a complete 3D parse of all objects and the layouts in the scene, in order to localize objects and infer free space. At the most detailed object level (right), we aim to recover a complete 3D parse of objects with robustness to possible foreground occlusions, and decompose each object into a structural and functional representation for applications like robot grasping and manipulations. Images are adopted from [2, 3, 4]
achieves the second best (at the time of writing) for perspective images, while also being the fastest. We demonstrate gains from using precomputed vanishing point cues, geometric constraints, and post-process optimization, indicating that deep network approaches still benefit from explicit geo-metric cues and constraints. We also show that adding an objective to directly regress 3D layout parameters leads to better predictions of the boundaries and corners that are used to solve for the final predicted layout. Moreover, we extend the annotations for the Stanford 2D-3D dataset [7], providing room layout annotations that can be used in future work. Experiments on three evalua-tion metrics and two dataset show that these differences improve results. We further show notable improvements upon LayoutNet, noted as LayoutNet v2, by using better image feature encoder, refined training details and gradient ascent based post refinement step (Chapter 3). Our LayoutNet v2 achieves the state-of-the-art for cuboid room layout estimation.
Complete 3D scene parsing from a single RGBD image. Our next step is to jointly recover 3D objects and room layouts in the scene. We aim to parse both the visible and occluded portions of the scene and all observable objects, producing acomplete 3D parse. Such a scene interpretation is useful for navigation and free space reasoning, but difficult to produce due to the well-known challenge of segmentation, the high degree of occlusion, and the diversity of objects in indoor scenes. We choose to work with RGBD images so that we can focus on designing and inferring a useful representation, without immediately struggling with the added difficulty of interpreting geometry of visible surfaces. We model the extent of objects with CAD-like 3D shapes and the layout of orthogonal walls as planar surfaces that conform to a Manhattan structure. To obtain
a dataset suitable for our experiments, we refine the NYUd v2 dataset with detailed 3D shape annotations for all the objects in each image. The labeling achieves a better representation of both ground truth object shape and whole scene depth. We propose an approach to recover a 3D model of room layout and objects from an RGBD image, arguably producing the most detailed and complete 3D scene parses to date [8]. We take a data-driven approach, generating sets of potential object regions, matching to regions in training images, and transferring and aligning associated 3D models while encouraging fit to observations and overall consistency. We also investigate impact of support estimation on scene parsing. We hypothesize, and confirm in experiments, that support height information will help most for interpreting occluded objects because the full extent of an occluded object can be inferred from support height (Chapter 4).
Robust 3D object reconstruction beyond occlusion. One major challenge in 3D object recon-struction is to infer the complete shape geometry from partial foreground occlusion. Occlusion frequently occurs in natural scenes: e.g. , we often see an image of a sofa occluded by a table in front and a dining table partially occluded by a vase on top. Key challenges are the unknown
existence andextent of an occluding region from limited view point. We propose a method to reconstruct the complete 3D shape of an object (represented by a set of point clouds) from a single RGB image, with robustness to occlusion. First, we propose a framework that predicts 3D point clouds from a single RGB image. We demonstrate performance gains by using a 2D re-projection loss on multiple synthetic views and a surface-based point cloud refinement step. Our approach achieves the state-of-the-art. We then extend our approach by predicting complete silhouettes for robustness to occlusion in real scenes. We propose a silhouette completion network that achieves the state-of-the-art. We show improvements for reconstruction of non-occluded and partially oc-cluded objects. Experiments demonstrate the efficacy of our approach both quantitatively and qualitatively on a real scene dataset (Chapter 5).
Primitive-based 3D Object Parsing. We explore the structural and functional representation of 3D objects, in order to support applications such as robot grasping and manipulation. Inspired by the nature of human perception of 3D shapes as a collection of simple parts, we explore such an abstract shape representation based on primitives. Compared with the common voxel-based representation, primitives are much morecompactin parameterization and are holisticin simpli-fying the reasoning about properties like stability and connectedness. One of the challenges of primitive-based 3D object modeling is to accommodate variable number of primitives within the object class they are trained for. We propose 3D-PRNN [9]: a generative recurrent neural network that reconstructs 3D shapes as sequences of primitives given a single depth image. We also pro-pose an efficient method to fit primitives from point clouds based on Gaussian-fields and energy minimization. Our primitive representation provides enough training samples for 3D-PRNN in 3D reconstruction (Chapter 6).
1.3 DISSERTATION OUTLINE
We present our literature review of 3D scene and object parsing from a single image in Chapter 2. We introduce in Chapter 3, 4, 5 and 6 our propsoed approaches. Chapter 3 presents LayoutNet, a convolution neural network based method that predicts room layout from a single image that generalizes across panoramas and perspective images, cuboid layouts and more general layouts (e.g. , L-shape room). We also improve upon LayoutNet and present LayoutNet v2 with notable performance boost. Chapter 4 presents our approach of complete scene parsing from an RGBD image. Chapter 5 presents our solution to reconstruct 3D object with robustness to possible partial foreground occlusion. Chapter 6 presents 3D-PRNN, a generative recurrent neural network that parses an object as a composition of primitives to infer its structural and functional characteristics. Finally, in Chapter 7, we come to our conclusions and discuss a few directions of future work.
CHAPTER 2: LITERATURE REVIEW
2.1 SINGLE IMAGE 3D RECONSTRUCTION
In 1963, Larry Roberts defended his Ph.D. thesis at MIT to extract 3D information from 2D line drawings [10]. Roberts put forward the “Blocks World” (polyhedra) hypothesis to model the 3D structure of objects and scenes. For decades, based on the blocks world assumption, researchers have proposed various methods to improve the performance of single image 3D reconstruction.
In 1999, Coughlan and Yuille [5] summarized the indoor scene statistics as “Manhattan world” assumptions: scenes were built on a Cartesian grid, as in indoor all walls are at right angles to each other and perpendicular to the floor. This representation makes up the loss of 3D geometry due to occlusions from objects in the scene, and is sparse and compact in representation that can speed up the reconstruction process. Manhattan world assumptions have inspired researchers to perceive the 3D indoor scene as a “box world”: both layouts and objects can be abstracted as oriented cuboids, inferring the rough 3D shape as well as the accurate 3D location and pose of objects and layouts, as shown in Figure 2.1. This can be applied for the task of 3D object detection [11], 3D scene reconstruction [12, 13, 14], and inferring of the free space and occupancy in the 3D scene [15, 16].
(a) (b)
Figure 2.1: Illustration of (a) utilizing the Manhattan world assumptions to estimate scene orien-tations and (b) the “box in the box” concept of 3D scene and object parsing from a single image. Images are adopted from [5, 13, 11].
More recent approaches continue to follow the concept of the “Manhattan world” assumptions and the “Blocks World” hypothesis, and attempt to solve 3D scene and object parsing from a single image at three different levels of details: layout level, scene level and object level. We discuss related work at each level of detail as follows.
2.2 3D LAYOUT FROM A SINGLE IMAGE
Single-view room layout estimation has been an active topic of research for the past decades. Delageet al. [17] fit floor/wall boundaries in a perspective image taken by a level camera to create a 3D model under “Manhattan world” assumptions [5]. A special case is the cuboid model, in which four walls, ceiling, and floor enclose the room. Lee et al. [18] produce Orientation Maps, generate layout hypotheses based on detected line segments, and select a best-fitting layout from among them. Hedau et al. [15] recover cuboid layouts by solving for three vanishing points, sampling layouts consistent with those vanishing points, and selecting the best layout based on edge and Geometric Context [19] consistencies. Subsequent works follow a similar approach, with improvements to layout generation [12, 20, 21], features for scoring layouts [20, 21], and incorporation of object hypotheses [11, 22, 23, 24, 25] or other context. The most recent methods train deep network features to classify pixels into layout surfaces like walls and ceiling [26, 27], boundaries [28], corners [29], or a combination [30].
(a) (b)
(c)
Figure 2.2: 3D geometric cues for single image layout reconstruction: (a) line (boundary) cues [28]; (b) corner cues [29]; (c) Manhattan layout assumptions (special case as a cuboid) for a single panorama [31]. Images are adopted from the cited paper.
Nearly all of these works aim to produce cuboid-shaped layouts from perspective RGB images. A few works also operate on panoramic images [31, 32, 33] or RGBD images [34, 14, 35, 36]. Methods also exist to recover axis-aligned, piecewise-planar models of interiors from large collec-tions of images [37, 38] or laser scans [39], benefiting from more complete scene information with fewer occlusion. Rent3D [40] takes advantage of a known floor plan.
2.3 3D SCENE PARSING FROM A SINGLE IMAGE
The term 3D scene parsing refers to the process of recovering the layout and shape of surfaces and objects in a scene. 3D scene parsing from a single image is a foundational problem in com-puter vision. One major challenge is to cope with the huge diversity of layouts and objects under heavy occlusion, due to the complexity of natural scenes. Previous approaches utilize contextual relations and physical constraints to recover cuboid representations of layouts and objects from a single RGB image [25, 41, 42, 43], or from a single RGBD image [44]. However, cuboids do not provide good shape approximations to chairs, tables, sofas, and many other common objects. Therefore, researchers proposed approaches to fit CAD-like models to depicted objects. Song and Xiao [45] search for chairs, beds, toilets, sofas, and tables by sliding 3D windows and enumerating all possible poses. Songet al.then extend the method to detect a larger variety of classes [46] with CNN-based approach and interprets semantic voxel representations from a single depth map [47]. Izadinia et al. [27] infer the CAD models of layouts pieces and objects via render-and-match. Huanget al. [48] further improve the performance by involving latent human context – affordance and the functionality of the arrangement of the room.
(a)
(c) (d)
(b)
Figure 2.3: Approaches for 3D scene parsing from a single image: cuboid layouts and objects recovery from (a) a single RGBD image [42] or (b) a single RGB image [43]; using CAD-like or mesh models to fit 3D objects and layouts from a single image [27, 48] as in (c) and (d). Images are adopted from the cited papers.
In addition, object height priors have shown to be crucial geometric cues for better object de-tection [49, 50, 51, 45, 52, 53]. Denget al. [54] apply height above ground to distinguish objects. Guo and Hoiem [55] localize the height and full extent of support surfaces from one RGBD image.
2.4 3D OBJECT PARSING
Many robotics and graphics applications require 3D shape interpretations from sensory data. For example, picking up a cup or moving a chair all rely on at least a vague idea of object position, shape, contact and connectedness. This can be attempted given an RGB image [56, 57, 58, 59, 60, 61, 62, 63, 64], a depth image [65, 66, 67, 68] or both [52, 69, 70]. Recent approaches mainly either focus on part- and object-based retrieval from large repositories [27, 71, 52, 66, 63, 72, 73], deformations from meshes [74, 75, 56] or a direct voxelized volumetric prediction via convolu-tion neural networks [57, 61, 76, 64]. A better model fitting includes part deformaconvolu-tion [77] and symmetry [78]. Wuet al.present preliminary results on automatic shape completion from depth by classifying hidden voxels with a deep network [67]. Wuet al.reconstruct shapes based on predicted skeletons [57].
Seeing beyond occlusions. Occlusions have long been an obstacle in both single-view and multi-view reconstruction. Solutions have been proposed to recover portions of surfaces from single views,e.g. with synthetic apertures [79, 80], or to otherwise improve robustness of matching and completion functions from multiple views [81, 82, 83]. Other work decompose a scene into layered depth maps from RGBD [36] or video [84] and then seek to complete the occluded portions of the maps. But errors in layered segmentation can severely degrade the recovery of the occluded region. Learning-based approaches [85, 86, 87] have posed recovery from occlusion as a 2D semantic segmentation completion task. Ehsaniet al. [86] propose to complete the silhouette and color/texture of an occluded object.
Point clouds based 3D object representations. We explore 3D shape representations as a set of point clouds, which is flexible and easy to transform. Qi et al. [88] propose a novel deep net architecture suitable for consuming unordered point sets in 3D; Fanet al. [89] propose to generate point clouds from a single RGB image using generative models. More recent approaches improve point set reconstruction performance by learning representative latent features [90] or by imposing constraints of geometric appearance in multiple views [91].
Primitive-based 3D object representations. We also explore shape representations as aggre-gations of primitives that has the benefit for lower computational and storage cost. Biederman, in the early 1980s, popularized the idea of representing shapes as a collection of components or primitives called “geons” [94], and early computer vision algorithms attempted to recover object-centered 3D volumetric primitives from single images [95]. have long been popular in psychol-ogy [94], interactive graphics [96] or shape completion from point clouds [97, 98, 99]. In the case that shapes often have canonical parts like planes or boxes and efficient solution for large data is required, primitives are used in reconstructions of urban and architectural scenes [100, 101, 102, 103].
(a)
(c) (d)
(b)
Figure 2.4: 3D object parsing and object representations: Given an RGB image, approaches ex-plore to recover the complete shape represented by (a) 3D voxels [92], (b) a 3D mesh [56] or (c) 3D surfaces [59]; objects can also be decomposed into primitives (oriented cuboids) from a 3D volume as in (d) [93]. Images are adopted from the cited papers.
2.5 RELATION TO OUR WORK
We discuss the relationship between the previous approaches and our work at three levels of details: layout level, scene level and object level.
2.5.1 Layout level
At the layout level, our work is most similar in goal to PanoContext [31] and in approach to RoomNet [29]. PanoContext extends the frameworks designed for perspective images to panora-mas, estimating vanishing points, generating hypotheses, and scoring hypotheses according to Ori-entation Maps, Geometric Context, and object hypotheses. To compute these features, PanoCon-text first projects the panoramic image into multiple overlapping perspective images, and then combines the feature maps back into a panoramic image. Our approach is more direct: after align-ing the panoramic image based on vanishalign-ing points, our system uses a deep network to predict boundaries and corners directly on the panoramic image. In this regard, we are similar to Room-Net, which uses a deep network to directly predict layout corners in perspective images, as well as a label that indicates which corners are visible. Our method differs from RoomNet in several ways. Our method applies to panoramic images. Our method also differs in the alignment step (RoomNet performs none) and in our multitask prediction of boundaries, corners, and 3D cuboid parameters. Our final inference is constrained to produce a Manhattan 3D layout. RoomNet uses an RNN to refine 2D corner position predictions, but those predictions might not be consistent
with any 3D cuboid layout. Our experiments show that all of these differences improve results. More generally, we propose the first method, to our knowledge, that applies to both perspective and panoramic images. We also show that our method extends easily to non-cuboid Manhattan layouts. Thus, our method is arguably the most general and effective approach to date for indoor layout estimation from a single RGB image. Moreover, our approach simplifies reconstruction by estimating layout directly on a single RGB equirectangular panorama: our final output is a sparse and compact planar Manhattan layout parameterized by each wall’s distance to camera, height, and the layout rotation.
2.5.2 Scene level
The most related work that recovers complete models from scene is proposed by Zhang et al. [31], where they predict 3D bounding boxes of the room and all major objects inside, together with their semantic categories from an RGB 360◦ full-view panorama. Different from Zhang et al.: we interpret whole-room3D context with detailed 3D shapes and layout planes; our input is a single image, which has limited field of view; and we make use of depth information, which eases the difficulty of interpreting geometry of visible surfaces.
Different from the existing methods that try to recover detailed shape for cuboid layouts and the main furniture in the scene, our approach finds a detailed shape for any object and layout in the scene from a single RGBD image. Our approach is efficient and light-weight compared with ScanNet [104], which utilizes RGB-D video dataset to annotate instance-level semantic segmen-tations, since our model operates on single images instead of videos. Moreover, our detailed shape prediction can be utilized as an refining tool for existing dataset with 3D bounding box ground truth.
Our approach also relates to parsing [105, 106] of RGBD images and generation of object-like regions [107, 108, 109]. We propose to generate object-like regions and retrieve their related 3D shape via region transfer, which is inspired by the SuperParsing method of Tighe and Lazebnik [110]. Similar ideas have also been used in other modalities: Karschet al. [111] transfer depth, Guo and Hoiem [112] transfer polygons of background regions, Yamaguchi et al. [113] transfer clothing items. Exemplar-based 3D modeling is also employed by Satkin and Hebert [114] to transfer 3D geometry and object labels from entire scenes.
2.5.3 Object level
One major challenge in 3D object parsing is to infer the complete 3D shape with robustness to partial foreground occlusions. Most of the approaches of 3D object parsing from a single image
are applied to non-occluded objects with clean backgrounds and no occlusions, which may prevent their application to natural images. Sun et al. [115] conduct experiments on real images from Pix3D, a large-scale dataset with aligned ground-truth 3D shapes, but do not consider the problem of occlusion. We are concerned with predicting shape of objects in natural scenes, which may be partly occluded. Our approach improves the state-of-the-art for object point set generation, and is extended to reconstruct beyond occlusion with the guidance of completed silhouettes. That is, We go further to try to predict the complete 3D shape of the occluded object.
Another major challenge in 3D object parsing is to have a functional and structural represen-tation of objects for applications such as robot grasping. Recently, more compact and parametric representations in the form of template objects [57], and set of cuboid primitives [93] have been introduced. These representations, however, require non trivial effort to accommodate variable number of configurations within the object class they are trained for. This is mainly because of their single feed-forward design, which implicitly forces the prediction of a discrete number of variables at the same time. Different from previous approaches, we propose to sequentially generates primitives. Our approach is inspired by Graves’ work [116] to sequentially generate parameterized handwriting strokes and the PixelRNN approach [117] to model natural images as sequentially generated pixels. To produce parameterized 3D primitives (oriented cuboids), we customize the RNN to encode explicit geometric constraints of symmetry and rotation. For ex-ample, separately predicting whether a primitive should rotate along each axis and by how much improves results over more simply predicting rotation values, since many objects consist of several (unrotated) cuboids.
CHAPTER 3: MANHATTAN ROOM LAYOUT FROM A SINGLE RGB IMAGE
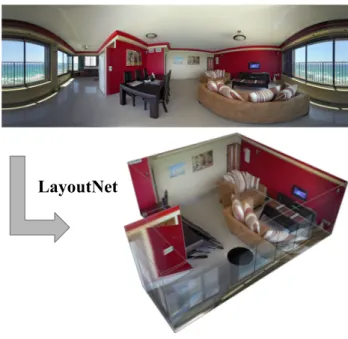
LayoutNet
Figure 3.1: Illustration. Our LayoutNet predicts a non-cuboid room layout from a single panorama under equirectangular projection.
The first problem to be solved in 3D scene parsing is to estimate the extent of room layout: whats the scope of the room? How high is the ceiling? How far are the walls? In this chapter, we propose an al-gorithm to predict room layout from a sin-gle image that generalizes across panora-mas and perspective images, cuboid lay-outs and more general laylay-outs (e.g. , “L”-shape room). Our method operates di-rectly on the panoramic image, rather than decomposing into perspective images as do recent works. Our network architec-ture is similar to that of RoomNet [29], but we show improvements due to aligning the image based on vanishing points, pre-dicting multiple layout elements (corners, boundaries, size and translation), and fit-ting a constrained Manhattan layout to the resulting predictions. Our method
com-pares well in speed and accuracy to other existing work on panoramas, achieves among the best accuracy for perspective images, and can handle both cuboid-shaped and more general Manhattan layouts.
3.1 INTRODUCTION
Estimating the 3D layout of a room from one image is an important goal, with applications such as robotics and augmented reality. The room layout specifies the positions, orientations, and heights of the walls, relative to the camera center. The layout can be represented as a set of projected corner positions or boundaries, or as a 3D mesh. Existing works apply to special cases of the problem, such as predicting cuboid-shaped layouts from perspective images or from panoramic images.
... Input Panorama Manhattan Lines Boundary Map (m E) Corner Map (mC) 512 × 1024 × 3 512 × 1024 × 1
3D Layout Parameter Regressor (for training only)
1 × 6 vector 512 × 1024 × 3 ... ... Manhattan Layout Optimizer ...
Figure 3.2:Overview.Our LayoutNet follows the encoder-decoder strategy. The network input is a concatenation of a single RGB panorama and Manhattan line map. The network jointly predicts layout boundaries and corner positions. The 3D layout parameter loss encourages predictions that maximize accuracy. The final prediction is a Manhattan constrained layout reconstruction.
indoor scene from a single perspective or panoramic image (Figure. 3.1). Our method compares well in speed and accuracy on panoramas and is among the best on perspective images. Our method also generalizes to non-cuboid Manhattan layouts, such as “L”-shaped rooms.
Our LayoutNet approach operates in three steps (Figure 3.2). First, our system analyzes the vanishing points and aligns the image to be level with the floor (Chapter 3.2.1). This alignment ensures that wall-wall boundaries are vertical lines and substantially reduces error according to our experiments. In the second step, corner (layout junctions) and boundary probability maps are pre-dicted directly on the image using a CNN with an encoder-decoder structure and skip connections (Chapter 3.2.2). Corners and boundaries each provide a complete representation of room layout. We find that jointly predicting them in a single network leads to better estimation. Finally, the 3D layout parameters are optimized to fit the predicted corners and boundaries (Cfhapter 3.3). The final 3D layout loss from our optimization process is difficult to back-propagate through the net-work, but direct regression of the 3D parameters during training serves as an effective substitute, encouraging predictions that maximize accuracy of the end result.
3.2 APPROACH
3.2.1 Panoramic image alignment
Given the input as a panorama that covers a360◦horizontal field of view, we first align the image by estimating the floor plane direction under spherical projection, rotate the scene, and re-project it to the 2D equirectangular projection. Similar to Zhanget al.’s approach [31], we extract long line
segments using the Line Segment Detector (LSD) [118] in each overlapped perspective view, then compute the vanishing points using the Hough Transform. This alignment step eases our network training. The detected candidate Manhattan line segments also provide additional input features that improve the performance, as shown in Chapter 3.5.
3.2.2 Network design
An overview of the LayoutNet network is illustrated in Figure 3.2. The network follows an encoder-decoder strategy.
Deep panorama encoder. The input is a 6-channel feature map: the concatenation of single RGB panorama with resolution of 512 ×1024 (or 512 × 512 for perspective images) and the Manhattan line feature map lying on three orthogonal vanishing directions using the alignment method in Chapter 3.2.1. The encoder contains7convolution layers with kernel size of3×3. Each convolution is followed by a ReLU operation and a max pooling layer with the down-sampling factor of2. The first convolution contains 32 features, and we double size after each convolution. This deep structure ensures a better feature learning from high resolution images and help ease the decoding step. We tried Batch Normalization after each convolution layer but observe lower accuracy. We also explored an alternative structure that applies a separate encoder for the input image and the Manhattan lines, but observe no increase in performance compared with our current simpler design.
2D layout decoder The decoder consists of two branches as shown in Figure 3.2. The top branch, the layout boundary map (mE) predictor, decodes the bottleneck feature into the 2D
feature map with the same resolution as the input. mE is a 3-channel probability prediction of
wall-wall, ceiling-wall and wall-floor boundary on the panorama, for both visible and occluded boundaries. The boundary predictor contains7layers of nearest neighbor up-sampling operation, each followed by a convolution layer with kernel size of 3 ×3, and the feature size is halved through layers from2048. The final layer is a Sigmoid operation. We add skip connections to each convolution layer following the spirit of the U-Net structure [119], in order to prevent shifting of predictions results from the up-sampling step. The lower branch, the 2D layout corner map (mC)
predictor, follows the same structure as the boundary map predictor and additionally receives skip connections from the top branch for each convolution layer. This stems from the intuition that lay-out boundaries imply corner positions, especially for the case when a corner is occluded. We show in our experiments (Chapter 3.5) that the joint prediction helps improve the accuracy of the both maps, leading to a better 3D reconstruction result. We experimented with fully convolutional lay-ers [120] instead of the up-sampling plus convolutions structure, but observed worse performance with checkerboard artifacts.
3D layout regressorThe function to map from 2D corners and boundaries to 3D layout eters is simple mathematically, but difficult to learn. So we train a regressor for 3D layout param-eters with the purpose of producing better corners and boundaries, rather than for its own sake. As shown in Figure 3.2, the 3D regressor gets as input the concatenation of the two predicted 2D maps and predicts the parameters of the 3D layout. We parameterize the layout with 6 parameters, assuming the ground plane is aligned on thex−zaxis: widthsw, lengthsl, heightsh, translation
T = (tx, tz)and rotationrθ on thex−z plane. The regressor follows an encoder structure with
7 layers of convolution with kernel size 3× 3, each followed by a ReLU operation and a max pooling layer with the down sampling factor of 2. The convolution feature size doubles through layers from the input 4 feature channel. The next four fully-connected layers have sizes of 1024, 256, 64, and 6, with ReLU in between. The output1×6feature vectord ={sw, sl, sh, tx, tz, rθ} is our predicted 3D cuboid parameter. Note that the regressor outputs the parameters of the 3D layout that can be projected back to the 2D image, presenting an end-to-end prediction approach. We observed that the 3D regressor is not accurate (with corner error of 3.36% in the PanoContext dataset compared with other results in Table 3.1), but including it in the loss objective tends to slightly improve the predictions of the network. The direct 3D regressor fails due to the fact that small position shifts in 2D can have a large difference in the 3D shape, making the network hard to train.
Loss function.The overall loss function of the network is:
L(mE,mC,d) = −α 1 n X p∈mE ˆ plogp+ (1−pˆ) log(1−p) −β1 n X q∈mC ˆ qlogq+ (1−qˆ) log(1−q)+τkd−dˆk2 (3.1)
HeremE is the probability that each image pixel is on the boundary between two walls;mC is the
probability that each image pixel is on a corner; d are the regressed cuboid parameters which have ground truthdˆ;pandqare pixel probabilities of edge and corner with ground truth values ofpˆand
ˆ
q, respectively. The loss is the summation over the binary cross entropy error of the predicted pixel probability inmE andmC compared with ground truth, plus the Euclidean distance of regressed
3D cuboid parametersdto the ground truthdˆ. Note that the RoomNet approach [29] uses L2 loss for corner prediction. We discuss the performance using two different losses in Chapter 3.5. α, β
andτ are the weights for each loss term. In our experiment, we setα=β = 1andτ = 0.01. Training details. Our LayoutNet predicts pixel probabilities for corners and boundaries and regresses the 3D layout parameters. We find that joint training from a randomly initialized net-work sometimes fails to converge. Instead, we train each sub-netnet-work separately and then jointly
train them together. For the 2D layout prediction network, we first train on the layout boundary prediction task to initialize the parameters of the network. For the 3D layout regressor, we first train the network with ground truth layout boundaries and corners as input, and then connect it with the 2D layout decoder and train the whole network end-to-end.
The input Manhattan line map is a 3 channel 0-1 tensor. We normalize each of the 3D cuboid parameter into zero mean and standard deviation across training samples. We use ADAM [121] to update network parameters with a learning rate ofe−4,α = 0.95and =e−6. The batch size for training the 2D layout prediction network is 5 and changes to 20 for training the 3D regressor. The whole end-to-end training uses a batch size of 20.
Ground truth smoothing. Our target 2D boundary and corner map is a binary map with a thin curve or point on the image. This makes training more difficult. For example, if the network predicts the corner position slightly off the ground truth, a huge penalty will be incurred. Instead, we dilate the ground truth boundary and corner map with a factor of 4 and then smooth the image with a Gaussian kernel of20×20. Note that even after smoothing, the target image still contains ˜95% zero values, so we re-weight the back propagated gradients of the background pixels by multiplying with0.2.
Data augmentation. We use horizontal rotation, left-right flipping and luminance change to augment the training samples. The horizontal rotation varies from 0o − 360o. The luminance varies withγ values between 0.5-2. For perspective images, we apply±10◦ rotation on the image plane.
Algorithm 3.13D layout optimization
1: Given panoramaI, layout corner predictionmC, and boundary predictionmE; 2: Initialize 3D layoutL0 based on Eq. 3.2;
3: Ebest =Score(L0)by Eq. 3.3,Lbest=L0; 4: fori= 1 :wallNumdo
5: Sample candidate layoutsLi by varying wall positionwiin 3D, fix other wall positions;
6: forj = 1 :|Li|do
7: Sample candidate LayoutsLij by varying floor and ceiling position in 3D;
8: Rank the best scored LayoutLB ∈ {Lij}based on Eq. 3.3;
9: ifEbest< Score(LB)then
10: Ebest =Score(LB),Lbest =LB;
11: Updatewi fromLbest, fix it for following sampling returnLbest
3.3 MANHATTAN LAYOUT OPTIMIZATION
The initial 2D corner predictions are obtained from the corner probability maps that our network outputs. First, the responses are summed across rows, to get a summed response for each column. Then, local maxima are found in the column responses, with distance between local maxima of at least 20 pixels. Finally, the two largest peaks are found along the selected columns. These 2D corners might not satisfy Manhattan constraints, so we perform optimization to refine the estimates.
Given the predicted corner positions, we can directly recover the camera position and 3D layout, up to a scale and translation, by assuming that bottom corners are on the same ground plane and that the top corners are directly above the bottom ones. We can further constrain the layout shape to be Manhattan, so that intersecting walls are perpendicular,e.g. , like a cuboid or “L”-shape in a top-down view. For panoramic images, the Manhattan constraints can be easily incorporated, by utilizing the characteristic that the columns of the panorama correspond to rotation angles of the camera. We parameterize the layout coordinates in the top-down view as a vector of 2D points Lv = {v1 = (0,0),v2 = (x1, y1), . . . ,vN = (xN, yN)}. v1 resolves the translation
ambiguity, and |v1 −v2| = 1 sets the scale. Because the layout is assumed to be Manhattan,
neighboring vertices will share one coordinate value: y1 =y0 = 0, x2 =x1, y3 =y2. . ., reducing
the number of free parameters toN −2. We denote the camera position asvc = {xc, yc}, where
0 ≤ xc ≤ max{xN, xN ∈ Lv}and0 ≤ yc ≤ max{yN, yN ∈ Lv}since the camera position is
within the layout extent. We recover the camera positionvc ={xc, yc}andLv by minimizing the
following energy function inspired by Farinet al. [122]:
E(Lv,vc) = X
i,j
kβ(vi,vj)−α(vi,vj)k2, i=j−1,0≤i≤N −1 (3.2)
Wherevi,vj are a pair of neighboring vertices, andβ(vi,vj) =arccos
vi−vc·vj−vc
kvi−vckkvj−vck is the
rota-tion angle betweenvi andvj centered at the cameravc in top-down view. α(vi,vj)denotes the
horizontal distance (number of pixels) between vi andvj projected on the panorama (visualized
as a pair of vertical axis aligned corners on the same wall-wall boundary) under rectangular pro-jection, divided by the overall length of the panorama. The energy function is derived from the observation that the length (horizontal dimension) of the panorama is equal to the summation of the rotation angles of the camera between all neighboring wall-wall boundaries in top-down view, resulting in a total of 360 degrees. Note that theL2minimization in Eq. 3.2 also applies to general Manhattan layouts withN >3. We use L-BFGS [123] to solve for Eq. 3.2 efficiently.
We initialize the ceiling level as the average (mean) of 3D upper-corner heights, and then opti-mize for a better fitting room layout, relying on both corner and boundary information using the
following score to evaluate 3D layout candidateL:
Score(L) =wjunc
X
lc∈C
logPcorner(lc) +wceil
X le∈Le max pe∈le logPceil(pe) +wf loor X lf∈Lf max pf∈lf logPfloor(pf) (3.3)
whereC denotes the 2D projected corner positions ofL. The cardinality of Lis #walls×2. We connect the nearby corners on the image to obtain Le which is the set of projected wall-ceiling boundaries, andLf is the set of projected wall-floor boundaries (each with cardinality of #walls).
Pcorner(·)denotes the pixel-wise probability value on the predictedmC. Pceil(·)andPfloor(·)denote
the probability onmE. The 2nd and 3rd term take the maximum value of the pixel’s log likelihood
response in each boundaryle ∈Leandlf ∈Lf. wjunc,wceilandwf loorare the term weights, we set to 1.0, 0.5 and 1.0 respectively using grid search. This weighting conforms with the observation that wall-floor corners are often occluded, and the predicted boundaries could help improve the layout reconstruction. We find that adding wall-wall boundaries in the scoring function helps less, since the vertical pairs of predicted corners already reveals the wall-wall boundaries information.
Directly optimizing Eq. 3.3 is computationally expensive, since we penalize on 2D projections but not direct 3D properties. In this case, we instead sample candidate layout shapes and select the best scoring result based on Eq. 3.3. We use line search to prune the candidate numbers to speed up the optimization. Algorithm 3.1 demonstrates the procedure. In each step, we sample candidate layouts by shifting one of the wall position within ±%10 of its distance to the camera center. Each candidate’s ceiling and floor level is then optimized based on the same sampling strategy and scored based on Eq. 3.3. Once we find the best scored layout by moving one of the walls, we fix this wall position, move to the next wall and perform the sampling again. We start from the least confident wall based on our boundary predictions. In total,∼1000layout candidates are sampled. The optimization step spends less then 30 sec for each image and produces better 3D layouts as demonstrated in Chapter 3.5.
3.4 EXTENSIONS
With small modifications, our network, originally designed to predict cuboid layouts from panoramas, can also predict more general Manhattan layouts from panoramas and cuboid-layouts from perspective images.
General Manhattan layouts. To enable more general layouts, we include training examples that have more than four walls visible (e.g. , “L”-shaped rooms), which applies to about 10% of
examples. We then determine whether to generate four or six walls by thresholding the score of the sixth strongest wall-wall boundary. Specifically, the average probability along the sixth strongest column of the corner map is at least 0.05. In other words, if there is evidence for more than four walls, our system generates additional walls; otherwise it generates four. Since the available test sets do not have many examples with more than four walls, we show qualitative results with our additional captured samples in Chapter 3.5.2.
Note that there will be multiple solutions given non-cuboid layout when solving Eq. 3.2. We experimented with predicting a concave/convex label as part of the corner map prediction to obtain single solution, but observed degraded 2D prediction. We thus enumerate all possible shapes (e.g. , for room with six walls, there will be six variations) and choose the one with the best score. We found this heuristic search to be efficient as it searches in a small discrete set. We do not train with the 3D parameter regressor for the non-cuboid layout.
Perspective images. When predicting on perspective images, we skip the alignment and opti-mization steps, instead directly predicting corners and boundaries on the image. We also do not use the 3D regressor branch. The network predicts a 3-channel boundary layout map with ceiling-wall, wall-wall and wall-floor boundaries, and the corner map has eight channels for each possible cor-ner. Since perspective images have smaller fields of view and the number of visible corners varies, we add a small decoding branch that predicts the room layout type, similar to RoomNet [29]. The predictor has 4 fully-connected (fc) layers with 1024, 256, 64 and 11 nodes, with ReLU operations in between. The predicted layout type then determines which corners are detected, and the cor-ners are localized as the most probable positions in the corner maps. We use cross entropy loss to jointly train the layout boundary and corner predictors. To ease training, similar to the procedure in Chapter 3.2.2, we first train the boundary/corner predictors, and then add the type predictor branch and train all components together.
3.5 EXPERIMENT
We implement our LayoutNet with Torch and test on a single NVIDIA Titan X GPU. The layout optimization is implemented with Matlab R2015a and is performed on Linux machine with Intel Xeon 3.5G Hz in CPU mode.
We demonstrate the effectiveness of our approach on the following tasks: (1) predict 3D cuboid layout from a single panorama, (2) estimate 3D non-cuboid Manhattan layout from a single panorama, and (3) estimate layout from a single perspective image. We train only on the training split of each public dataset and tune the hyper-parameters on the validation set. We report results on the test set. Our final corner/boundary prediction from the LayoutNet is averaged over results with input
PanoContext Ours PanoContext Ours
PanoContext Ours PanoContext Ours
PanoContext Ours Ours
PanoContext LayoutNet PanoContext LayoutNet
Ours
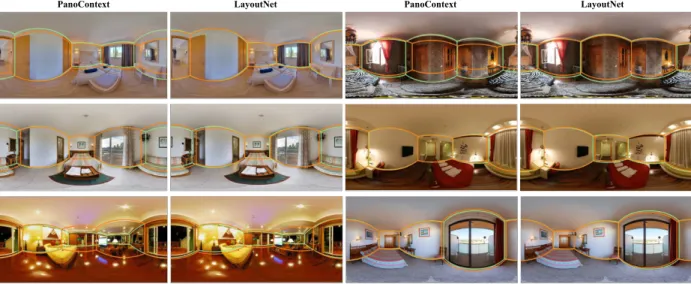
Figure 3.3:Qualitative results (randomly sampled) for cuboid layout prediction on PanoCon-text dataset. We show both our method’s performance (even columns) and the state-of-the-art [31] (odd columns). Each image consists predicted layout from given method (orange lines) and ground truth layout (green lines).
of the original panoramas/images and the left-right flipped ones.
3.5.1 Cuboid layout for panorama
We evaluate our approach on three standard metrics: (1) 3D intersection over union (IoU), calculated between our predicted 3D layout and the ground truth and averaged across all images; (2)Corner error, theL2distance between predicted room corner and the ground truth, normalized by the image diagonal and averaged across all images; (3) Pixel error, the pixel-wise accuracy between the layout and the ground truth, averaged across all images.
We perform our method using the same hyper-parameter on the following two datasets.
PanoContext datasetThe PanoContext dataset [31] contains 500annotated cuboid layouts of indoor environments such as bedrooms and living rooms. Since there is no existing validation set, we carefully split 10% validation images from the training samples so that similar rooms do not appear in the training split. Table 3.1 shows the quantitative comparison of our method, denoted as “ours full (corner+boundary+3D)”, compared with the state-of-the-art cuboid layout estima-tion by Zhang et al. [31], denoted as “PanoContext”. Note that PanoContext incorporates object detection as a factor for layout estimation. Our LayoutNet directly recovers layouts and outper-forms the state-of-the-art on all the three metrics. Figure 3.3 shows the qualitative comparison. Our approach presents better localization of layout boundaries, especially for a better estimate on
Method 3D IoU (%) Corner error (%) Pixel error (%) PanoContext [31] 67.23 1.60 4.55 ours (corner) 73.16 1.08 4.10 ours (corner+boundary) 73.26 1.07 3.31
ours full (corner+boundary+3D) 74.48 1.06 3.34
ours w/o alignment 69.91 1.44 4.39
ours w/o cuboid constraint 72.56 1.12 3.39
ours w/o layout optimization 73.25 1.08 3.37
ours w/L2loss 73.55 1.12 3.43
ours full w/ Stnfd. 2D-3D data 75.12 1.02 3.18
Table 3.1: Quantitative results on cuboid layout estimation from panorama using PanoContext dataset [31]. We compare the PanoContext method, and include an ablation analysis on a variety of configurations of our method. Bold numbers indicate the best performance when training on PanoContext data.
Method 3D IoU (%) Corner
error (%)
Pixel error (%)
ours (corner) 72.50 1.27 3.44
ours (corner+boundary) 75.26 1.03 2.68
ours full (corner+boundary+3D) 75.39 1.01 2.70
ours w/o alignment 68.56 1.56 3.70
ours w/o cuboid constraint 74.13 1.08 2.87
ours w/o layout optimization 74.47 1.07 2.92
ours w/L2loss 76.33 1.04 2.70
ours full w/ PanoContext data 77.51 0.92 2.42
Table 3.2: Evaluation on our labeled Stanford 2D-3D annotation dataset. We evaluate our Layout-Net approach with various configurations for ablation study. Bold numbers indicate best perfor-mance when training only on Stanford 2D-3D training set.
occluded boundaries, and is much faster in time as shown in Table 3.3.
Our labeled Stanford 2D-3D annotation datasetThe dataset contains 1413 equirectangular RGB panorama collected in 6 large-scale indoor environment including office and classrooms and open space like corridors. Since the dataset does not contain applicable layout annotations, we extend the annotations with carefully labeled 3D cuboid shape layout, providing571RGB panora-mas with room layout annotations. We evaluate our LayoutNet quantitatively in Table 3.2 and qualitatively in Figure 3.4. Although the Stanford 2D-3D annotation dataset is more challenging with smaller vertical field of view (FOV) and more occlusions on the wall-floor boundaries, our LayoutNet recovers the 3D layouts well.
Ablation study. We show, in Table 3.1 and Table 3.2, the performance given the different con-figurations of our approach: (1) with only room corner prediction, denoted as “ours (corner)”;
PanoContext Ours PanoContext Ours
PanoContext Ours PanoContext Ours
PanoContext Ours PanoContext Ours
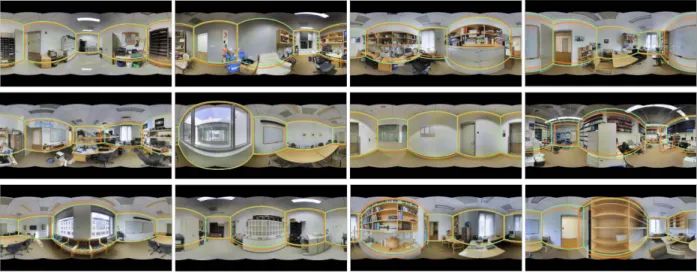
Figure 3.4: Qualitative results (randomly sampled) for cuboid layout prediction on the Stan-ford 2D-3D annotation dataset. This dataset is more challenging than the PanoContext dataset, due to a smaller vertical field of view and more occlusion. We show our method’s predicted lay-out (orange lines) compared with the ground truth laylay-out (green lines).
Method Average CPU time (s)
PanoContext [31] >300
ours full (corner+boundary+3D) 44.73
ours w/o alignment 31.00
ours w/o cuboid constraint 13.75
ours w/o layout optimization 14.23
Table 3.3: Average CPU time for each method. We evaluate the methods on the PanoContext dataset [31] using Matlab on Linux machine with an Intel Xeon 3.5G Hz (6 cores).
(2) joint prediction of corner and boundary, denoted as “ours (corner+boundary)”; (3) our full ap-proach with 3D layout loss, denoted as “ours full (corner+boundary+3D)”; (4) our full apap-proach trained on a combined dataset; (5) our full approach without alignment step; (6) our full approach without cuboid constraint; (7) our full approach without layout optimization step; and 8) our full approach usingL2loss for boundary/corner prediction instead of cross entropy loss. Our exper-iments show that the full approach that incorporates all configurations performs better across all the metrics. Using cross entropy loss appears to have a better performance than using L2. Train-ing with 3D regressor has a small impact, which is the part of the reason we do not use it for perspective images. Table 3.3 shows the average runtimes for different configurations.
Comparison to other approaches:We compare with Yanget al. [32] based on their depth dis-tribution metric. We directly run our full cuboid layout prediction (deep net trained on PanoContext + optimization) on 88 indoor panoramas collected by Yanget al..
Method L2 dist cosine dist
Yanget al. [32] 27.02 4.27
Ours 18.51 5.85
Table 3.4: Depth distribution error compared with Yanget al. [32].
As shown in Table 3.4, our approach outper-forms Yang et al. in L2 distance and is slightly worse in cosine distance. Another approach, Pano2CAD [33], has not made their source code available and has no evaluation on layout, mak-ing direct comparison difficult. For time con-sumption, Yang et al. report to be less than 1 minute, Pano2CAD takes 30s to process one
room. One forward pass of LayoutNet takes 39ms. In CPU mode (w/o parallel for loop) us-ing Matlab R2015a, our cuboid constraint takes 0.52s, alignment 13.73s, and layout optimization 30.5s.
3.5.2 Non-cuboid layout for panorama
Figure 3.5: Qualitative results for non-cuboid layout prediction. We show our method’s pre-dicted layout (orange lines). Best viewed in color.
Figure 3.5 shows qualitative results of our approach to reconstruct non-cuboid Manhattan layouts from single panorama. Due to the lim-ited number of non-cuboid room layouts in the existing datasets, we captured several images using a Ricoh Theta-S 360◦ camera. Our ap-proach is able to predict 3D room layouts with complex shape that are difficult for existing methods.
3.5.3 Perspective images
We use the same experimental setting as in [26, 29]. We train our modified approach to jointly predict room type on the training split of the LSUN layout estimation challenge. We do not train on the validation split. Our method
takes 39ms (25 FPS) to process a perspective image, faster than the 52ms (19 FPS) of RoomNet basic [29] or 168ms (6 FPS) of RoomNet recurrent, under the same hardware configuration. More-over, our method is generalized across both panorama and perspective images, and can predict both cuboid shape and non-cuboid shape room from single panorama.
Input RGB LayoutNet boundary LayoutNet corner LayoutNet result Input RGB LayoutNet boundary LayoutNet corner LayoutNet result
Figure 3.6: Qualitative results for perspective images. We show the input RGB image, our predicted boundary/corner map and the final estimated layout (orange lines) compared with ground truth (green lines). Best viewed in color.
Method Pixel Error (%)
Schwinget al. [12] 12.8
Del Peroet al. [24] 12.7
Dasguptaet al. [26] 9.73
LayoutNet (ours) 9.69
RoomNet recurrent 3-iter [29] 8.36
Table 3.5: Performance on Hedau dataset [15]. We show the top 5 results, LayoutNet ranks second to RoomNet recurrent 3-iter in Pixel Error (%).
Our method ranks second among the methods. Table 3.6 shows our performance compared with the state-of-the-art on the LSUN dataset. Our method ranks second in Keypoint Error (%) and ranks third in Pixel Error (%). We also report results of the RoomNet basic approach [29] that does not apply recurrent refinement, which is closer in design to our approach. The lower ac-curacy in pixel error mainly results from our simplified room keypoint representation. Different from RoomNet [29] that assumes all keypoints are distinguished across different room types, our LayoutNet directly predicts the 8 keypoints, and selects among them based on the room type to produce the final prediction. Moreover, we do not apply layout optimization step as explained in this chapter that incorporate predicted boundary probability to the perspective image task. Fig-ure 3.6 shows qualitative results on the LSUN validation split. FailFig-ure cases include room type prediction error (last row, right column) and heavy occlusion from limited field of view (last row, left column).
Method Keypoint Error (%) Pixel Error (%)
Hedauet al. [15] 15.48 24.23
Mallyaet al. [28] 11.02 16.71
Dasguptaet al. [26] 8.20 10.63
LayoutNet (ours) 7.63 11.96
RoomNet recurrent 3-iter [29] 6.30 9.86
RoomNet basic [29] 6.95 10.46
Table 3.6: Performance on LSUN dataset. LayoutNet ranks second comparing with RoomNet recurrent 3-iter in Keypoint Error (%) and ranks third in Pixel Error (%). We also report the RoomNet basic approach that does not apply recurrent refinement step, which is closer in design to our approach.
3.6 LAYOUTNET V2
So far, we’ve discussed our LayoutNet approach that combines neural network based pixel-wise predictions and a post optimization step to produced Manhattan layouts. More recent ap-proaches [124, 125, 126] for single 360 panorama 3D layout reconstruction also build upon this framework, and all show promising results.
In this section, we show our own improvements over the original LayoutNet in three folds: (1) a better image encoder to capture room corners and boundaries; (2) refined implementation details that incorporate new data augmentations like random stretching [126] and (3) a more efficient gradient ascent based optimization instead of sampling based optimization. We call the improved version “LayoutNet v2”, which, at the time of writing, achieves the state-of-the-art.
3.6.1 Improvements upon LayoutNet
ResNet based network architecture. Instead of using a vanilla convolution and up-sampling based image encoder as in the original LayoutNet, we use ResNet [127] as our image encoder. The decoder remains as a two-branch architecture that jointly produces a corner map and a boundary map of the same resolution as the input RGB image. Both two branch consist 5 up-sampling layers, each with a convolution layer (kernel size3×3) and a ReLU operation afterwards. We also add the same skip links as the original LayoutNet architecture. We exclude the 3D box parameter regressor branch as we observed no significant performance changes, but the training time was increased.
Refined implementation details. We experiment with ResNet-18, ResNet-34 and ResNet-50 image encoders respectively. The encoder outputs a bottleneck feature size of 1024. We use pre-trained ResNet on ImageNet to initialize the encoder. During training, we use the same opti-mization method and hyper-parameters like learning rate as the original LayoutNet. The training
Method 3D IoU (%) Corner error (%) Pixel error (%) LayoutNet 75.12 1.02 3.18 LayoutNet v2 (ResNet-18) 84.13 0.65 1.92 LayoutNet v2 (ResNet-34) 85.02 0.63 1.79 LayoutNet v2 (ResNet-50) 82.44 0.75 2.22
Table 3.7: Quantitative results on cuboid layout estimation from a single 360 panorama using PanoContext dataset [31]. All methods are trained with extra data from Stnfd. 2D-3D dataset. We show our LayoutNet v2 performance with three ResNet encoders respectively.
scheme differs slightly: we first train the layout boundary prediction branch, then fix the weights of boundary branch and train the corner prediction branch, and finally we train the whole network end-to-end. We slightly decrease the dilation factor to 3 for ground truth smoothing, making the ground truth corner/boundary pixel be the peak response after a Gaussian smooth of σ = 20. Despite the data augmentations used in the original LayoutNet, we change image intensity with a minimum intensity ranges between 0-127 and a fixed maximum intensity of 255. We also add color jittering to each RGB channel independently by multiplying a factor ranges in 0.8-1.2. Moreover, we perform random stretching introduced by Sunet al. [126] with stretching factorskx = 1and
kz = 2. Each augmentation parameter is uniformly and randomly sampled from the defined range. To avoid the unstable learning of the batch normalization layer in ResNet encoder due to smaller batch size, we freeze the parameters of the batch normalization layer when training end-to-end.
Gradient ascent optimization. Our original LayoutNet’s post optimization step (Chapter 3.3) is sampling based, with is time consuming and is constrained to the pre-defined sampling space. We instead use stochastic gradient ascent [128] to search for local optimum of the cost function1.
Moreover, we use the revised Equ. 3.3 that computes the average response across layout lines instead of the maximum response.
Score(L) = wjunc 1 |C| X lc∈C Pcorner(lc) +wceil 1 |Le| X le∈Le Pceil(le) +wf loor 1 |Lf| X lf∈Lf Pfloor(lf) (3.4)
We setwjunc=wceil =wfloor= 1.
3.6.2 Experiment
To verify the efficacy of our proposed LayoutNet v2, we (1) first conduct ablation study to verify the performance improvement of each modification to the original LayoutNet, then (2) compare 1We use the SGD based optimization implemented by Sun (with different loss term weights):

![Figure 2.2: 3D geometric cues for single image layout reconstruction: (a) line (boundary) cues [28]; (b) corner cues [29]; (c) Manhattan layout assumptions (special case as a cuboid) for a single panorama [31]](https://thumb-us.123doks.com/thumbv2/123dok_us/1286512.2672671/16.918.190.735.485.729/figure-geometric-reconstruction-boundary-manhattan-assumptions-special-panorama.webp)
![Figure 2.3: Approaches for 3D scene parsing from a single image: cuboid layouts and objects recovery from (a) a single RGBD image [42] or (b) a single RGB image [43]; using CAD-like or mesh models to fit 3D objects and layouts from a single image [27, 48]](https://thumb-us.123doks.com/thumbv2/123dok_us/1286512.2672671/17.918.149.770.544.827/figure-approaches-parsing-layouts-objects-recovery-objects-layouts.webp)
![Figure 2.4: 3D object parsing and object representations: Given an RGB image, approaches ex- ex-plore to recover the complete shape represented by (a) 3D voxels [92], (b) a 3D mesh [56] or (c) 3D surfaces [59]; objects can also be decomposed into primitive](https://thumb-us.123doks.com/thumbv2/123dok_us/1286512.2672671/19.918.220.696.118.342/figure-representations-approaches-complete-represented-surfaces-decomposed-primitive.webp)