© 2017, IRJET | Impact Factor value: 6.171 | ISO 9001:2008 Certified Journal | Page 924
Stabilisation of Black Cotton Soil by utilising Controlled Low Strength
Material (CLSM)
Mithun Sagar P
1, Skanda Kumar B.N
2, Manjunatha S
3, Guruswamy J
41PG Student, Department of Civil Engineering, SKSJTI, K.R. Circle, Bengaluru-560001, Karnataka, India. 2Assistant Professor, Centre for Incubation Innovation Research and Consultancy (CIIRC),
Jyothy Institute of Technology, Bangalore-560082.
3Assistant Professor, Department of Civil Engineering,SKSJTI, K.R. Circle, Bengaluru-560001, Karnataka, India. 4Research Scholar, Department of Civil Engineering, Jain University, Bengaluru-560069, Karnataka, India. ---***---ABSTRACT:This paper presents the stabilisation of Black
Cotton Soil and is done by Controlled Low Strength Material (CLSM) which contains Fly ash, M-Sand, Effluent Treatment Plant (ETP) sludge, Cement with proper blending. CLSM is prepared by following the guidelines of ACI 229 R-99. ACI 229R-99 have proposed a mix proportioning system. Based on trial and error method, materials are blended until appropriate qualities are attained. In this paper the Black Cotton Soil was tested for Specific gravity test, Liquid limit test, Plastic limit test, and California bearing test. The total moulds prepared were 12. Among 12 moulds, 6 moulds were tested as un-soaked specimens and 6 moulds were tested as soaked specimens. From the California bearing test it is observed that the strength of the Black Cotton Soil is increased with the increase of CLSM proportions.
KEY-WORDS: Black Cotton Soil, stabilisation, Controlled Low Strength Material (CLSM), Fly ash, M-Sand, Effluent Treatment Plant (ETP) sludge, Cement, ACI 229 R-99, Specific gravity test, Liquid limit test, Plastic limit test, and California bearing test.
1.INTRODUCTION
1.1 Introduction to Black Cotton Soil:
It is among the significant soil accumulation of India. It swells significantly and becomes adhesive in monsoon. Under such situations, it is almost impossible to work on such soil and hence have been discovered to be most troublesome from engineering consideration. However, in the summer season, the water content vaporises, the soil dwindles and is faced with wide and sound cracks, often 12 to 16-centimetre wide and up to one meter deep. This enables oxygenation of the soil to remarkable depths and the soil has extraordinary fertility.
1.2 Stabilisation of black cotton soil:
It is a technique and it is listed as required engineering properties. It is a method of adding admixture like CLSM and it increases load bearing capability and shear quality of the
soil. Stabilized soil materials give the required engineering qualities of the soil.
An important reason of stabilisation is the activity of increase the stability or quality of soil. Stabilization process decreases the construction and maintenance cost by utilising neighbouring available substances. In a road construction we should use the neighbouring available material for sub grade use and made it as an economic construction. Various types of soil show different properties even in same stretch. The properties soil is distinguished by conducting various laboratory tests.
2.OBJECTIVE OF THIS PAPER
In the current research work stabilisation of Black cotton soil is completed by using CLSM mixture. This paper contains the stabilisation of Black cotton soil and is carried by using CLSM mixture by replacing the Black cotton soil with Controlled Low Strength Material (CLSM) by 10%, 20%, 30%, 40%, 50% respectively and California Bearing Ratio (CBR) test is done to find out the load bearing quality of the soil. The total of 12 moulds were prepared. 6 moulds were tested as un soaked specimens and 6 moulds were tested as soaked specimens.
3.MIX PROPORTIONING OF CLSM USED
STEP 1: Selection of volume of water and fly ash quantity.
Water quantity = 500 kg/m3. The water quantity was arrived
on the base of trial and error. Initial mix was prepared with the water quantity of 300kg/m3 and the workability
achieved by this mix was tested to be unsatisfactory. Thus, water quantity was increased by 50 kg/m3 until a
satisfactory workability was achieved.
Fly Ash = 500 kg/m3.ACI-229R-99 specifies the extent of fly
ash between 0 to 1200 kg/m3 for class F fly ash. Based on
this the intermediate values from 400 kg/m3 to 800 kg/m3
were selected. Fly ash content more than 600 kg/m3 resulted
© 2017, IRJET | Impact Factor value: 6.171 | ISO 9001:2008 Certified Journal | Page 925
decrement in the strength of the material. Thus 500 kg/m3 of
fly ash material was selected.
Cement = 114 kg/m3. As per ACI-229R-99, cement content
varies from 30 kg/m3 to 120 kg/m3 in CLSM. Based on this,
cement content was varied between 30 kg/m3 to 120 kg/m3
and 114 kg/m3 was selected for the experiment.
STEP 2: Calculation of Cement content and Sludge content.
Sludge = 5 %
Sludge content was varied as follows: 0 %, 5 %, 10 % and 15% of cement and 5% of sludge is selected for this experiment. Mix proportioning has been done by partial substitution of OPC and fly ash by CETP sludge individually.
CRITERIA: Replacing Cement Sludge= (5/100) *120= 6 kg/m3.
Cement= (120-6) =114 kg/m3.
STEP 3: Calculation of Fine aggregates.
Volume of Cement = (114/3.4) *(1/1000) =0.033 Volume of water = (500/1000) =0.5
Volume of fly-ash = (500/2.1) *(1/1000) =0.238 Volume of Sludge = (6/2.186) *(1/1000) =0.002 Total volume = 0.033+0.5+0.238+0.0027 =0.7731 Volume of fine aggregates = 1-0.7731 = 0.2270 Mass of fine aggregates = 0.2270*1000*2.78 = 632.06
STEP 4: Mix Proportions
Water = 500 kg/m3.Cement = 114 kg/m3.
Fine aggregates = 632.06 kg/m3.
Fly-ash = 500 kg/m3.Sludge = 6 kg/m3.
4. TESTS CONDUCTED AND RESULTS OBTAINED
[image:2.595.328.536.189.343.2]The basic tests conducted for plain Black cotton soil and the result obtained were as follows
Table 4.1Test Results of Black Cotton Soil
Then the Black cotton soil was blended with CLSM mix proportion and California bearing ratio (CBR) test conducted for 12 specimens of various blends. The CBR results are as follows
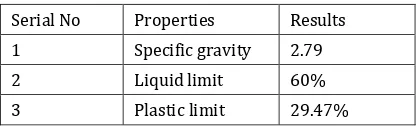
4.1CBR with 0%CLSM (UNSOAKED)
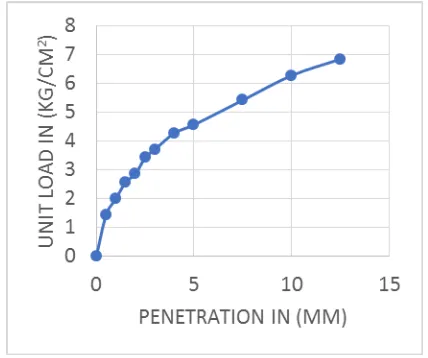
The first specimen has 100% of Black Cotton Soil and 0% CLSM. The specimen is experimented as an un soaked specimen at the day itself of specimen prepared. The method of compaction is dynamic compaction and specimen is re moulded specimen. Proving ring calibration factor is =5.6, Surcharged weight applied is = 5 kg.
0 1 2 3 4 5 6
0 5 10 15
U
N
IT
LO
A
D
(
K
G
/C
M
2)
[image:2.595.55.264.624.687.2]PENETRATION IN (MM)
Figure 4.1 CBR values for 100% black cotton soil and 0% CLSM (un soaked)
CALCULATION
To calculate unit load for 2.5 mm and 5 mm on crushing stones the table shown can be used.
Penetration of
plunger(mm) Standard load(Kg) Unit load(Kg/cm2)
2.5 1370 70
5 2055 105
CBR % at 2.5 mm penetration is,
= (Corrected unit load at 2.5 mm penetration/standard unit load at 2.5 mm penetration) *100
= (2.281/70) *100 =3.285
CBR % at 5 mm penetration is,
= (Corrected unit load at 5 mm penetration/standard unit load at 5 mm penetration) *100
= (3.422/105) *100 =3.259
4.2CBR with 10% CLSM (UNSOAKED)
The second specimen has 90% of Black Cotton Soil and 10% CLSM. The specimen is tested as an un soaked specimen at the day itself of specimen prepared. The type of compaction is dynamic compaction and specimen is re moulded specimen.
Serial No Properties Results
1 Specific gravity 2.79
2 Liquid limit 60%
© 2017, IRJET | Impact Factor value: 6.171 | ISO 9001:2008 Certified Journal | Page 926
Figure 4.2 CBR values for 90% black cotton soil and 10% CLSM (un soaked)
CALCULATION
CBR % at 2.5 mm penetration is,
= (Corrected unit load at 2.5 mm penetration/standard unit load at 2.5 mm penetration) *100
= (2.566/70) *100 =3.665
CBR % at 5 mm penetration is,
= (Corrected unit load at 5 mm penetration/standard unit load at 5 mm penetration) *100
= (3.707/105) *100 =3.530
4.3CBR with 20% CLSM (UNSOAKED)
The third specimen has 80% of Black Cotton Soil and 20% CLSM. The specimen is tested as an un soaked specimen at the day itself of specimen prepared. The type of compaction is dynamic compaction and specimen is re moulded specimen.
Figure 4.3 CBR values for 80% black cotton soil and 20% CLSM (un soaked)
CALCULATION
CBR % at 2.5 mm penetration is,
= (Corrected unit load at 2.5 mm penetration/standard unit load at 2.5 mm penetration) *100
= (2.852/70) *100 =4.074
CBR % at 5 mm penetration is,
= (Corrected unit load at 5 mm penetration/standard unit load at 5 mm penetration) *100
= (3.992/105) *100 =3.801
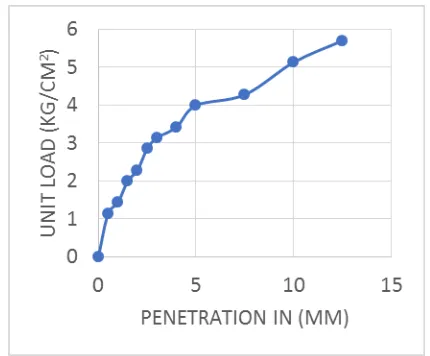
4.4CBR with 30% CLSM (UNSOAKED)
[image:3.595.323.540.334.506.2]The fourth specimen has 70% of Black Cotton Soil and 30% CLSM. The specimen is tested as an un soaked specimen at the day itself of specimen prepared. The type of compaction is dynamic compaction and specimen is re moulded specimen.
Figure 4.4 CBR values for 70% black cotton soil and 30% CLSM (un soaked)
CALCULATION
CBR % at 2.5 mm penetration is,
= (Corrected unit load at 2.5 mm penetration/standard unit load at 2.5 mm penetration) *100
= (3.137/70) *100 =4.481
CBR % at 5 mm penetration is,
= (Corrected unit load at 5 mm penetration/standard unit load at 5 mm penetration) *100
= (4.278/105) *100 =4.074
4.5 CBR with 40% CLSM (UNSOAKED)
[image:3.595.53.268.542.720.2]© 2017, IRJET | Impact Factor value: 6.171 | ISO 9001:2008 Certified Journal | Page 927
Figure 4.5 CBR values for 60% black cotton soil and 40% CLSM (un soaked)
CALCULATION
CBR % at 2.5 mm penetration is,
= (Corrected unit load at 2.5 mm penetration/standard unit load at 2.5 mm penetration) *100
= (3.422/70) *100 =4.888
CBR % at 5 mm penetration is,
= (Corrected unit load at 5 mm penetration/standard unit load at 5 mm penetration) *100
= (4.848/105) *100 =4.617
4.6CBR with 50% CLSM (UNSOAKED)
The sixth specimen has 50% of Black Cotton Soil and 50% CLSM. The specimen is tested as an un soaked specimen at the day itself of specimen prepared. The type of compaction is dynamic compaction and specimen is re moulded specimen.
Figure 4.6 CBR values for 50% black cotton soil and 50% CLSM (un soaked)
CALCULATION
CBR % at 2.5 mm penetration is,
= (Corrected unit load at 2.5 mm penetration/standard unit load at 2.5 mm penetration) *100
= (3.707/70) *100 =5.295
CBR % at 5 mm penetration is,
= (Corrected unit load at 5 mm penetration/standard unit load at 5 mm penetration) *100
= (5.133/105) *100 =4.888
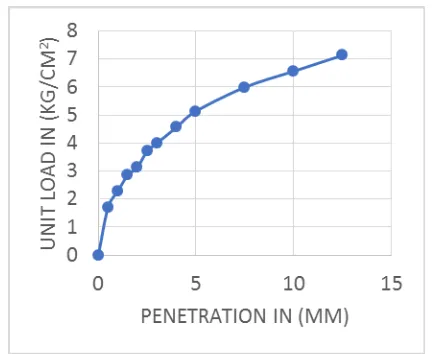
4.7 CBR with 0% CLSM (SOAKED)
[image:4.595.324.540.323.481.2]The seventh specimen has 100% of Black Cotton Soil and 0% CLSM. The specimen is tested as soaked specimen after 96 hours of specimen prepared. The type of compaction is dynamic compaction and specimen is re moulded specimen.
Figure 4.7 CBR values for 100% black cotton soil and 0% CLSM (soaked)
CALCULATION
CBR % at 2.5 mm penetration is,
= (Corrected unit load at 2.5 mm penetration/standard unit load at 2.5 mm penetration) *100
= (1.711/70) *100 =2.444 CBR % at 5 mm penetration is,
= (Corrected unit load at 5 mm penetration/standard unit load at 5 mm penetration) *100
= (2.566/105) *100 =2.443
4.8 CBR with 10% CLSM (SOAKED)
[image:4.595.53.269.552.729.2]© 2017, IRJET | Impact Factor value: 6.171 | ISO 9001:2008 Certified Journal | Page 928
Figure 4.8 CBR values for 90% black cotton soil and 10% CLSM (soaked)
CALCULATION
CBR % at 2.5 mm penetration is,
= (Corrected unit load at 2.5 mm penetration/standard unit load at 2.5 mm penetration) *100
= (1.996/70) *100 =2.851
CBR % at 5 mm penetration is,
= (Corrected unit load at 5 mm penetration/standard unit load at 5 mm penetration) *100
= (2.852/105) *100 =2.716
4.9CBR with 20% CLSM (SOAKED)
The ninth specimen has 80% of Black Cotton Soil and 20% CLSM. The specimen is tested as soaked specimen after 96 hours of specimen prepared. The type of compaction is dynamic compaction and specimen is re moulded specimen.
Figure 4.9 CBR values for 80% black cotton soil and 20% CLSM (soaked)
CALCULATION
CBR % at 2.5 mm penetration is,
= (Corrected unit load at 2.5 mm penetration/standard unit load at 2.5 mm penetration) *100
= (2.281/70) *100 =3.258
CBR % at 5 mm penetration is,
= (Corrected unit load at 5 mm penetration/standard unit load at 5 mm penetration) *100
= (3.137/105) *100 =2.987
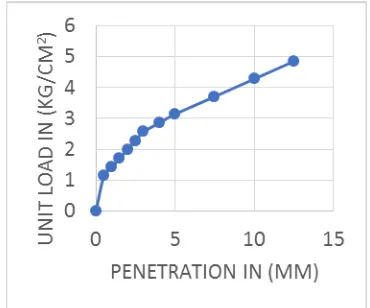
4.9CBR with 30% CLSM (SOAKED)
[image:5.595.324.539.249.410.2]The tenth specimen has 70% of Black Cotton Soil and 30% CLSM. The specimen is tested as soaked specimen after 96 hours of specimen prepared. The type of compaction is dynamic compaction and specimen is re moulded specimen.
Figure 4.10 CBR values for 70% black cotton soil and 30% CLSM (soaked)
CALCULATION
CBR % at 2.5 mm penetration is,
= (Corrected unit load at 2.5 mm penetration/standard unit load at 2.5 mm penetration) *100
= (2.852/70) *100 =4.074
CBR % at 5 mm penetration is,
= (Corrected unit load at 5 mm penetration/standard unit load at 5 mm penetration) *100
= (3.992/105) *100 =3.801
4.10 CBR with 40% CLSM (SOAKED)
[image:5.595.68.253.513.667.2]© 2017, IRJET | Impact Factor value: 6.171 | ISO 9001:2008 Certified Journal | Page 929 Figure 4.11 CBR values for 60% black cotton soil and 40%
CLSM (soaked)
CALCULATION
CBR % at 2.5 mm penetration is,
= (Corrected unit load at 2.5 mm penetration/standard unit load at 2.5 mm penetration) *100
= (3.137/70) *100 =4.481
CBR % at 5 mm penetration is,
= (Corrected unit load at 5 mm penetration/standard unit load at 5 mm penetration) *100
= (4.278/105) *100 =4.074
4.11 CBR with 50% CLSM (SOAKED)
[image:6.595.54.272.62.250.2]The twelfth specimen has 50% of Black Cotton Soil and 50% CLSM. The specimen is tested as soaked specimen after 96 hours of specimen prepared. The type of compaction is dynamic compaction and specimen is re moulded specimen.
Figure 4.12 CBR values for 50% black cotton soil and 50% CLSM (soaked)
CALCULATION
CBR % at 2.5 mm penetration is,
= (Corrected unit load at 2.5 mm penetration/standard unit load at 2.5 mm penetration) *100
= (3.422/70) *100 =4.888
CBR % at 5 mm penetration is,
= (Corrected unit load at 5 mm penetration/standard unit load at 5 mm penetration) *100
= (4.563/105) *100 =4.345
Comparison of CBR values obtained with different percentages of CLSM
[image:6.595.54.268.538.717.2]The tables 4.2, 4.3 shows the comparison of the California bearing ratio of black cotton soil stabilised with different percentage of CLSM for un soaked and soaked conditions respectively.
Table 4.2 Comparison of un soaked CBR values obtained with different percentages of CLSM
Discussion: From the table it is evident that there is a substantial increase in CBR values with the increase in percentage of CLSM. However, there is a decrease in percentage of increase in CBR values with increase in percentage of additive.
Table 4.3 Comparison of soaked CBR values obtained with different percentages of CLSM
Serial
No % of CLSM CBR value Increase in CBR value
1 0 2.444 -
2 10 2.851 16.653
3 20 3.258 14.275
4 30 4.074 25.046
5 40 4.481 9.990
6 50 4.888 9.0827
Discussion: From the table it is evident that there is a substantial increase in CBR values with the increase in percentage of CLSM. However, there is a decrease in percentage of increase in CBR values with increase in percentage of additive.
Serial
No CLSM % of value CBR Increase in CBR value
1 0 3.285 -
2 10 3.665 11.56
3 20 4.074 11.159
4 30 4.481 9.990
5 40 4.488 8.904
© 2017, IRJET | Impact Factor value: 6.171 | ISO 9001:2008 Certified Journal | Page 930 5. CONCLUSION
In the application part of CLSM, the CLSM is blended with Black cotton soil and California bearing ratio (CBR) experiment was done to find out the bearing capacity of the mixture.
When CLSM mixture were blended with Black cotton soil, experiment shows a major increment in the bearing capacity and strength of the compound.
The mixture of CLSM and Black Cotton Soil can be utilised to increment the bearing capacity of the soil, CLSM also behaves as a stabilising agent and the price of pavement construction is also decreased significantly.
6. REFERENCES
1) Brajesh Mishra International Journal of Science and Research (IJSR) Volume 4 Issue 11, November 2015. “A Study on Engineering Behaviour of Black Cotton Soil and its Stabilization by Use of Lime’’.
2) Kavish S. Mehta, Rutvij J. Sonecha, Parth D. Daxini, Parth B. Ratanpara, Kapilani S. Gaikwad Int. Journal of Engineering Research and Applications. Vol. 4, Issue 5(Version 3), May 2014. “Analysis of Engineering Properties of Black Cotton Soil & Stabilization using by Lime’’.
3) Pankaj R. Modak, Prakash B. Nangare, Sanjay D. Nagrale, Ravindra D. Nalawade, Vivek S. Chavhan International Journal ofEngineering and Innovative Technology (IJEIT) Volume 1, Issue 5, May 2012. “Stabilisation of Black Cotton Soil Using Admixtures’’.
4) Udayashankar D. Hakari, S.C. Puranik [Global Journal of researches in engineering Civil and Structural engineering] Volume 12 Issue 2 Version 1.0 February 2012 “Stabilisation of Black Cotton Soils Using Fly Ash, Hubballi-Dharwad Municipal Corporation Area, Karnataka, India’’.
5) V. Ramesh Babu, K. Niveditha, Dr. B. Ramesh Babu [International Journal of Civil Engineering and Technology (IJCIET) Volume 7, Issue 2, March-April 2016, pp. 341–351]. “Stabilization of Black Cotton Soil with Sand and Cement as a Subgrade Pavement’’.
6) Amruta A. Badge, Lobhesh N. Muley, Kunal R. Raul [IJIET, volume 5 issue 2 April 2015] “Quality Assessment for Stabilization of Black Cotton Soil by Using Lime’’.
7) Sujit Kawade, Mahendra Mapari, Mr. Shreedhar Sharanappa [International Journal of Innovative Research in Advanced Engineering (IJIRAE)]. Volume1 Issue 5 (June 2014). “Stabilization of Black Cotton Soil with Lime and Geo-grid’’.