http://dx.doi.org/10.4236/jsea.2014.711084
Usability Experiments to Evaluate
UML/SysML-Based Model Driven Software
Engineering Notations for Logic Control
in Manufacturing Automation
Birgit Vogel-Heuser
Institute of Automation and Information Systems, Technische Universität München, Munich, Germany Email: [email protected]
Received 26 August 2014; revised 20 September 2014; accepted 15 October 2014
Copyright © 2014 by author and Scientific Research Publishing Inc.
This work is licensed under the Creative Commons Attribution International License (CC BY).
http://creativecommons.org/licenses/by/4.0/
Abstract
Many industrial companies and researchers are looking for more efficient model driven engi- neering approaches (MDE) in software engineering of manufacturing automation systems (MS) especially for logic control programming, but are uncertain about the applicability and effort needed to implement those approaches in comparison to classical Programmable Logic Controller (PLC) programming with IEC 61131-3. The paper summarizes results of usability experiments eva- luating UML and SysML as software engineering notations for a MDE applied in the domain of manufacturing systems. Modeling MS needs to cover the domain specific characteristics, i.e. hy- brid process, real time requirements and communication requirements. In addition the paper presents factors, constraint and practical experience for the development of further usability ex- periments. The paper gives examples of notational expressiveness and weaknesses of UML and SysML. The appendix delivers detailed master models, representing the correct best suited model, and evaluation schemes of the experiment, which is helpful if setting up own empirical experi- ments.
Keywords
Manufacturing Automation Software, Programming Environment, Software Engineering, User Interface Human Factors
1. Introduction
in the languages of the IEC 61131-3 standard [2]. Since the proportion of system functionality that is realized by software is increasing [3], concepts for supporting automation engineers in handling software complexity are strongly required. Furthermore, spatially distributed MSs tend to result in a spatial distribution of software [4]-[6], i.e. networked automation systems (NAS). One key challenge of manufacturing automation companies in high wage countries is to increase efficiency, effectiveness and quality in design of software engineering for MS to shorten engineering and start-up time and ease maintenance. To reach this goal, model driven software engineering (MDE) including code generation is a promising systematic approach [1]. A variety of different mo- deling notations (general and domain specific ones) were developed and defined by academia and/or tool sup- pliers during the last decades to improve efficiency and effectiveness and to increase software quality in manu- facturing automation, e.g. Vyatkin [7]-[9], Fantuzzi, et al. [10]-[12], Thramboulidis, et al. [3] [13] [14], Vogel- Heuser, et al. [15] [16] or Estévez, et al. [17] [18].
Many industrial companies and researchers are looking for more efficient MDE in software engineering of MS, but are uncertain about the applicability and effort including training and reengineering of component libra- ries and workflow needed to implement those approaches in their companies. In the last decade many new ap- proaches, e.g. notations as UML and SysML and tools to support these approaches were developed and pre- sented to industry, to improve software quality and efficiency as well as maintainability and evolution including more or less the typical requirements as real time, communication and partially hybrid process characteristics or networked automation systems. The challenge for manufacturing automation companies is to find the most ap- propriate MDE approach fitting to the companies’ particular requirements, e.g. market requirements, customer relation (what to get from the customer and what to deliver), workflow requirements, qualification of personnel, budget and so forth. Consultants try to bridge this gap and support automation companies specifying their re- quirements and evaluating available approaches and/or tools. In a next step a beta-test may be conducted which is always short in time and delayed by higher prioritized “real” projects. Often poor usability of tools, missing features or missing modular and flexible training units lead to a rejection of a MDE approach [19], which would be applicable and beneficial if systematically selected and introduced. But the risk to spend too much time of experienced application engineers for evaluating a probably inappropriate notation and/or tool is often estimated as too high to allow a systematic and exhaustive evaluation.
To overcome this drawback and enable selecting the best notation which fits well to a company’s needs, this paper provides a discussion of different ways for usability evaluation in Section 2 including usability evaluation methods and procedures that are well-established and have successfully been applied for decades, e.g. in the au- tomotive domain [20] and in nuclear safety research [21]. In the following Section 3, aspects and rules to be considered when designing experiments are investigated in detail. These proposed aspects are exemplified by a variety of experiments conducted in the last decade on usability of software engineering in MS presented in (Section 4). The paper closes with a summary and discussion in Section 5 and 6, respectively. The appendix gives three examples of the evaluation of subjects’ models. Appendix A shows subjects’ models from the first experiments highlighting the difficulties in understanding class as a structural mechanism to foster modularity and reuse using UML 1.4. Appendix B shows an example of subject’s UML model (Evaluation scheme E1) compared to a master model also highlighting the calculation of the later used complexity measure WMC. Ap-pendix C explains the different abstraction mechanism between subjects’ solution and master model.
2. Methods in Usability Evaluation
investigate the applicability of a notation but to identify which notations might be relevant and/or to gain first qualitative results on weaknesses and drawbacks. A major advantage of focus groups compared to individual in- terviews is a more natural atmosphere that ideally leads to increased talkativeness and openness of the partici- pants [24]. An example of a focus group evaluation is given in [25]. In contrast, individual interviews are easier to perform (especially with busy industrial experts), as the persons can be questioned at different times and dif- ferent places, i.e. no common appointment has to be found. Mostly, a very limited number of experts is available for evaluation, and consequently, a representative quantitative opinion cannot be gathered. However, an evalua- tion by experts, as for example described in [26], can act as a beta-test of a prototypical tool indicating the opi- nion trend. The same challenge occurs with case studies testing industrial experts and/or researchers as e.g. de- scribed in [27] and [28]. In both studies, a significant small group of participants were observed during courses on programming in accordance to the IEC 61499 compared to IEC 61131-3 standard and an Object Oriented approach. Conclusions based on observed aspects can only serve as indicators. Consequently, experiments with a higher number of subjects are required to gain objective, detailed and quantitative results for specific research questions. The in depth investigation of research questions like the applicability of novel modeling notations or programming paradigms presuppose that test persons get familiar with the novel notation or paradigm. The in- troduction of the required knowledge is very time-consuming and consequently not applicable for a large num- ber of experts, i.e. minimum 15 - 20 per compared notation, required for significant, objective results. Further- more, the comparability of results of different experts with different previous knowledge is very difficult to han- dle. Thus, such research questions (e.g. the usefulness of a certain new notation) can only be quantified with la- boratory experiments, where comparable testing conditions can be created and where, due to the sheer number of tested subjects (plus respective grouping), their individual characteristics and preferences can be considered. Such relevant testing conditions and constraints which have to be considered during experimental design are discussed in detail in the following section. Furthermore, their relationship to usability and how to quantify ex-perimental results in order to deduce quantifiable usability results is presented.
3. Factors for Experimental Design in MS
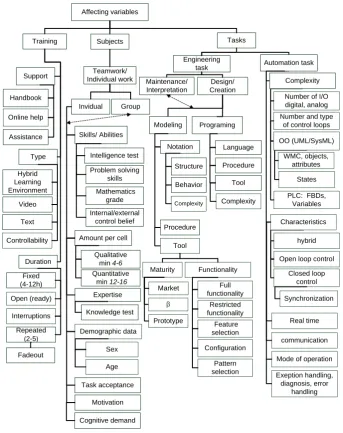
Patig [29] [30] and Gemino and Wand [31] present results of various experiments on the usability of modeling notations in requirement engineering and classical software engineering introducing relevant factors for suc- cessful experimental design. Following an experimental approach the experimental design needs to be fixed ad first, choosing the constraints of the experiment, the so called affecting variables (Figure 1), i.e. the process to be controlled, the engineering task as well as the duration of the whole experiment depending on the temporary availability of the subjects and the subjects themselves. These affecting variables are described in Section 3.1. Hereafter we discuss the affected variables or usability requirements for experimental design in Section 3.2, showing the measures to evaluate the different notational approaches. Thereby, we draw both on [29] [30] and [31] as well as our earlier reflections [32]. On that basis, we adapted and enlarged the extent of variables with focus on the specific requirements in design and maintenance of MS.
3.1. Overview of Affecting Variables
According to the best of the authors’ knowledge, the main three influencing factors seem to be (1) the task, (2) the preceding training and (3) the tested subjects (Figure 1). Because subjects’ attendance for training and expe- riment is a prerequisite, duration is not only a training constraint but also a constraint for the whole experiment including the performances of the engineering task. For experiments with students or apprentices two days is most promising from an organizational point of view.
3.1.1. Task
To describe the requirements from the technical process point of view the automation task is introduced and se- parated from the engineering task performed by an application engineer using notations and tools.
1) Automation Task
Affecting variables
Training Subjects Tasks
Support Type Duration Handbook Online help Assistance Hybrid Learning Environment Video Text Fixed (4-12h) Open (ready) Interruptions Repeated
(2-5)
Fadeout
Teamwork/ Individual work
Skills/ Abilities
Amount per cell
Demographic data Task acceptance Expertise Motivation Intelligence test Qualitative min 4-6 Quantitative
min 12-16
Sex Age Knowledge test Problem solving skills Mathematics grade Internal/external control belief Cognitive demand Engineering task Maintenance/ Interpretation Design/ Creation
Number of I/O digital, analog
PLC: FBDs, Variables Modeling Programing Language Procedure Tool Notation Procedure Tool Structure Behavior Maturity Functionality Market Prototype Restricted functionality Feature selection Configuration Pattern selection Group Invidual
Open loop control
Closed loop control Synchronization Complexity Complexity β Controllability Complexity Full functionality Automation task Characteristics Real time communication hybrid
Mode of operation
Exeption handling, diagnosis, error
handling Number and type
of control loops
WMC, objects, attributes
[image:4.595.141.485.83.517.2]States OO (UML/SysML)
Figure 1. Affecting variables (dashed lines show dependencies between group and substruc-ture and maintenance/interpretation and substrucsubstruc-ture).
automation task with adjusted complexity the subjects can cope within the limited time frame of the experiment and the required training.
As measure for complexity of an automation task, the number of inputs and outputs (I/O) is a familiar metric in cost estimation during preparation of an offer distinguishing between analog (closed loop) and digital (logic design) inputs and estimating the complexity of the closed loop control with a factor (see column “automation task”). However, it is far too simple to reduce the complexity of an automation tasks to the number of I/Os be- cause the automation task itself involves even more complexity. To derive the complexity of the automation task, it is necessary to describe the automation task itself with a notation. Therefore, then notational influence may lead to different complexity measure for the same control task. In the following measures for control task com- plexity correlated to the chosen notation are introduced.
plexity as well as Lee and Hsu [36], who converted the programs in question into Boolean expressions by using if-then transformations and, afterwards, rated the programs’ complexity by comparing the calculated values.
For applying an object-oriented notion for describing the automation task, Chidamber and Kemerer developed a set of metrics of OO design [37], e.g. weighted methods per class (WMC) which is a measure for class com- plexity used in this paper (see column control complexity inTable 1): in order to calculate the WMC of a pro- gram, the cyclomatic complexity measure of each method is summed up for all classes, cf. [38]. When applying classical IEC 61131-3 code to describe an automation task, the number of FBDs and their instances in case of IEC 61131-3 are a familiar measure [39].
Besides those metrics which rely on the description of the automation task for deriving its complexity, also its characteristics like the type of control loop, i.e. logic control, closed loop control (with synchronization) or a technical process requiring both, called hybrid in the following can be taken into account. Furthermore require- ments on automation systems, which have to be fulfilled are introduced: real time requirements, communication requirements between different controllers, and networked automation systems (NAS) as a class of systems with real time and communications requirements because the code and functionality is distributed onto different au- tomation devices.
Besides the regular machine control function, diagnosis, exception handling, visualization and other functio- nality need to be developed. “In fact, industry folklore suggests that approximately 90% of the overall control logic is used for exception handling” [40]. During the last years, the authors’ team analyzed real PLC code from several MS companies and realized that 6% - 10% of the lines of code are dealing with diagnosis and safety [41]. As a consequence, the mode of operation (EN 13128 [42]: auto, hand, manual etc.) as well as diagnosis includ- ing error handling (according to [38] and [41]) are typical automation tasks which provide another possible clas- sification.
2) Engineering Task
The category engineering task describes the task to be solved by the human in the experiment, e.g. model (UML, SysML) or program (IEC Code) to control the automation task. Gemino und Wand [31] distinguish two types of human tasks in automation and control:
• design and creation versus
• understanding and analysis (being typical for maintenance tasks in MS).
For both types of tasks, it must be between modeling and programming (dashed lines inFigure 1). Moreover, maturity and functionality of tool support have to be considered as influencing factors. As tool classification three maturity levels and four different functionality types are proposed. Because the comparison of different notations in MDE is focused in this paper the modeling notation as such and its measures should be discussed in more detail.
The notation needs to fulfill the requirements given by the automation task, the life cycle model and the engi- neering task allowing modeling structure and behavior. Different modeling notations also possess different complexities. Calculation schemes are proposed by e.g. Recker et al. 2009 [42] and Rossi and Brinkkemper [43]. The expressiveness of this measure is limited to the complexity of the pure notation calculated on the number of its elements.
( )
2 2 2P
M O
C = +R + (1)
With O being the number of object types, R describing the relationship types and P the property types of a method, C(M) is the resulting complexity of a heterogeneous modeling language.
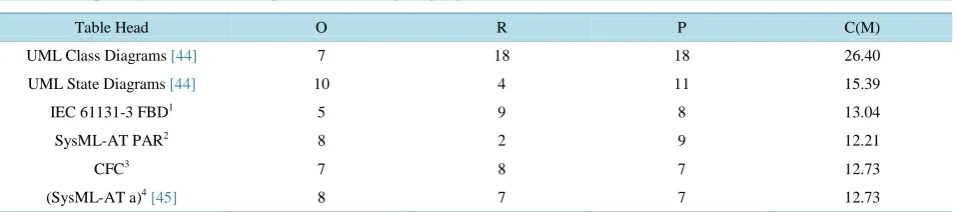
Schalles [44] compared UML activity diagrams for behavioral modeling and UML class diagrams for struc- tural modeling, taking into account the high complexity differences (Table 2).
To allow the comparison of notations’ complexity, the complexity of the later discussed notations is calcu-lated, too. The complexity of the UML class diagram (Table 2) is nearly double compared to IEC 61131-3, SysML- AT (see also [45]) and CFC showing that between the typical MS notations the difference is very small.
3.1.2. Subjects
Subjects’ qualification and experience is essential for the outcome of the experiment. Sierla et al. [28] and Ha- jarnarvis et al. [46] included industrial experts. Sierla introduced teamwork with clearly separated tasks similar to a real project team in industry.
Table 1. Overview of the experiments. Criteria Compared MDE Approaches/ Notations Engineering Support Tool Support Control Task Training Type (Duration h) Subjects’ Qualification; Min. Number per Cell Design Overall Evaluation
Results Results Subjective Questionnaire
Results for Further Notation/Tool Development
O.1
IEC 61131 LL, Petrinet, SIPN, mFSM Lucas and
Tilbury [67], Lucas [68]
N
LL (from manufacturer of test bed) mFSM (paper
and pencil)
Flexible manufacturing test bed Logic Control 30DI/O (n.A.) n.A. LL professional, PN, SIPN, mFSM by students
Estimation of development times based on low level
user operations, and observation of engineers
performing their task LL-405 min PN-1110
min Mfsm-1500 min
n.A.
Schema for estimation of time based on low level user operations
O.2
IEC 61131 LL, Petrinet, SIPN, mFSM Lucas and
Tilbury [33]
N
LL (from manufacturer
of test bed) mFSM (paper and pencil)
Flexible manufacturing test bed Logic Control, DI/O 30 4 scenarios (n.A.)
n.A. LL professional, PN, SIPN, mFSM by students
Number of operations, state variable, modularity,
interconnectness
n.A.
LL small but very interconnected, mFSM most modular,
although largest
O.3
IEC 61499 vs IEC 61131-3 plus design pattern
repo-sitory Strömman
et al. [27]
N, P Market tool, repository Lifter unit Logic Control (-) Presentation of design pattern, repository and FBDs 20 Professional automation designers and researchers
Models analyzed, and written feedback 3
Tape recorded interviews in companies as preparation each
60 min.
Event driven model experience relevant, guidelines for reusable software, environment that fosters collaboration and exchange of information O.4
IEC 61499, IEC 61131, OO Sierla
et al. [28]
N,P
Market tool, adapted 61499
framework, repository
(hyb) Per notation 1 week course for
training incl. experiment All approaches different sequence Set of domain- specific design principles 7 experts different background team work Observations, field notes Interviews after course Further guidelines, design patterns and tool support.
O.5 LL, sequence Hajanarvis [46] N
EC, RS Logix 5000, RS View, market
tool
Turn motors and valves Logic, sequence
change including diagnosis and HMI LL
(1); sequence (1) All approaches different sequence Briefing sheets, questions, tool 45 skilled and 18 unskilled
Performance, Right first time rates, completion time, observation, sid effects of prior experience;
Step logic and EC best results, EC superior for untrained Observations helped to identify problems the participants
prevented from solving the task correctly
Self assed skill test
Observations revealed deficiencies in SFC programming interface E1
UML 1.4 CD vs. ICL vs. PLC S7
[image:6.595.61.539.98.723.2]UML 1.4 not restricted ICL truth table, SFC, idioms Friedrich et al.
[69]-[71]
N
~ p&p structure/behavior (hyb) DI 22, AI 1
DO 13, AO 3, WMC = 45 Modeling (1.5); PLC
programming (1.5)
L (1.5), E (0.75) ppt-slides
BSc 5 (2 in each group) Students in Practice 3 Technicians 3
-
Behavior (19.31 steps from 32 realized p < 0.01)
BSc 20.26, StiP 15.44, Techn. 12.78 (p = 0.02) Error rate: 43.84% (p < 0.01) BSc 53.36%,
StiP 40.26% Techn. 13.64% (p < 0.01)
UML applicability structure 1.33, behavior 3.07 (1 not applicable-5
applicable) ICL (s 1.71; b 3.60) error: novices 48.7%
experts 21.6% p = 0.02
Reduced number of UML diagrams, tool and modeling procedure needed S7 IL, LL,
FBD
E2
UML PA (Instance structure D) vs. UML 2.0 (CD, Component D. Composite Struct. D, Deployment D) Focus: configuration,
deployment Katzke
et al.[72] [73]
N, M, P Prot.
PE p&p structure (hyb, comm) ME: Continuous hydr. Press; switch between pressure and distance control, selection of pattern AI 60, AO 30 WMC = 3, UML (3.81);
UML-PA (2.27)
PE L(3)/E(3) ME: L(3)/ E(-) 1 rep. online-help
BSc Mech. & CS 4th sem. 6
Q+ Restricted
tool
PE: 20 min breaks, Too complex (difficult); ME: time to interpret UML 2.0
t20 = 22:52, SD = 3:14 UML-PA tPA = 13:40,
SD = 4:42 (p ≤ 0.05) Self-assessment/steps UML 2.0 1.78; UML-PA 3.93 (p ≤ 0.10) Errors [42]
~
•Tool flexibility needed •Change between
diagram requires additional time •Communication and deployment support successful E3 UML Embedded SC vs. SFC, focus: error handling and consistency check
of sensor states Witsch et al.
[75] [77]
N
Prot. structure/behavior Cylinder (p&p) error handling: interception of time and erroneous sensor values; movement of
1 cylinder with two sensors DI/O 2(2)
L (1), E (0.75) per notation
BSc Mech. & CS 4th sem. 15
+ Small subtask
SC x̅ 1.92 p/min (x̅ 1.98 p/min with comp. states; x̅ 1.81 without
comp. states); SFC x̅ 1.41 p/min
Subjects using comp. states higher prog.
Experience: r = 0.479, p = 0.033
Error handling beneficial using
UML SC with composite states Tool: side effects:
Continued
E4a
UML CD/SC vs. SC/CD order Vogel-Heuser,
Seidel [78]
N ~
(p&p) structure/ behavior DI/O 13 (DI 9; DO 4), WMC = 11 small group (0.42)
L (3.2) E (0.42)
BSc 2.Sem 41CD/21SC -
no significant differences in terms
of modeling order
Forcing subjects to follow a specific modeling order is
not helpful to improve structural
models; subjects had problems to
create suitable classes from similar objects
E4b BSc 2.Sem
70CD/32SC +
“behavior first” group: x̅ 23.4 p (SD =10.326; SE
= 0.982), Structure first group x̅ 18.4 p (SD = 8.220; SE = 1.825) out of
46 p max. s~: quality structural model bad: “structure first” x̅ 12.26 p
“behavior first” group x̅ 11.14 p, structural quality
of model is independent from modeling order
Post experiment interview and questionnaire to reveal challenges and reasons
for mistakes ~
E5
UML Embedded CD/SC vs. IEC FBD
Vogel-Heuser et al. [63]
N
ß
(p&p) with reuse of buffer,structure/ behavior DI/O 38
(DI 24; DO 14), WMC = 44 (UML)
FBD 64 variables (2.2 + 0.92 quest.)
HLE and HB Fade out (Rep) (6.42) 18 Apprentices 1./2. year ++Strong correlation with abilities
Behavior (p = 0.22) and structure (p = 0.15) not significant; UML: thinking breaks Relatives to abilities (Table 1, 51): grade mathematics: (r = 0.234, p = 0.055);
grade automation: (r = 0.327, p < 0.005) grade mechatronics: (r = 0.327, p < 0.005);
cognitive demand: (r = −0.255, p < 0.05);
previous knowledge: (r = 0.485, p < 0.001)
Frustration levels of UML group signif. higher than FBS group
(p = 0.02), clearness of FBD signif. higher than of UML (p = 0.017)
ease of use for behavior programming UML signif. lower than FBD (p = 0.012), Subjective
quality estimation of UML group matches the factual quality signif.
better than the FBD group (p = 0.025)
Difficulties with abstraction and building correct classes, e.g. cylinder,
relationship CD and SC
CG
E6
SysML-AT Parameter Diagram (PD) vs. CFC vs. IEC
61131-3 ST; Frank, Schütz/Obermeier, Schütz [25] [26]
N ~
Physical laws, structure, Maintenance task, analysis, understanding,
interpret 4 - 5 sub-blocks, 7 - 8 variables, WMC = 5 - 6 (0.167 per notation
+ 0.083 quest.)
L (0.167) E (0.084) per notation 6 BSc. (mech. eng.) All notations different sequence Q Correct solutions PD 68.2% CFC 63.4% ST 64.3% Answers correlated with objective results,
learning effects across notations Adequate method for requirement analysis and architecture design was missing E7
SysML-AT vs. IEC 61131-3Notation + method Frank et al.
[79] [80]
N, M
Prot.
NAS Coking plant structure, hyb, communication, RT: Material sorting, belt synchronization, level
control; DO 3, AI 8; AO 4 WMC = 18, (a) 2,3;
b) 2,6; c) 2,6); all mean times
L (1.5) E (1.5)
15 BSc (mech.eng) ++
CFC x̅ 93.5 (182) points NM x̅ 123.1 (182) points
(p < 0.001)
From NM to NMCP: mental demand and workload: ↓, fear of failure: ↑, fatalistic externality: ↑, NMC worst values: suitability
for task and individualization
(seeTable 3)
Compromise between support and complexity. Difficulties with module abstraction SysML-AT
a) plus characteristics Frank et al. [81]
N, M, C L (2)
E (2) 5 Q+
NM x̅ 97.20 (182) NMC x̅ 116.6 (182)
SysML-AT b) plus pattern Eckert et al. [82]
N, M, C, P L (2.5)
E (2.5) 5 Q-
NMC x̅ 116.6 (182) NMCP x̅ 119.75 (182)
[image:7.595.62.541.532.638.2]Legend: N—notation; Prot—prototype; p&p—pick and place; L—Lecture; Q—only qualitative results; M—method; HB—handbook; (p&p)—part of p&p; E— exercise; er—error rate; ß—Version; A—analogue; I/O—input/output; Rep—repetition; CG—code-gen IEC 61131-3; P—pattern; D—digital; ~—only pencil & paper; C—characteristics; ME/PE—main/pre experiment; HLE—hybrid learning environment.
Table 2. Complexity values for heterogeneous modeling languages.
Table Head O R P C(M)
UML Class Diagrams [44] 7 18 18 26.40 UML State Diagrams [44] 10 4 11 15.39
IEC 61131-3 FBD1 5 9 8 13.04
SysML-AT PAR2 8 2 9 12.21
CFC3 7 8 7 12.73
(SysML-AT a)4 [45] 8 7 7 12.73
competence models, e.g. [47]-[49]. Usually, competencies in this context are understood as abilities, skills, and knowledge—a perspective which is still prominent in most Anglo-American research on competencies. An ex- ample is provided by Curtis [50], who proposed that programming results depend on individual personal factors and mental abilities. His model covers intellectual aptitudes, the knowledge base, cognitive styles, the motiva- tional structure, personality characteristics, and behavioral characteristics. Although Curtis did not empirically test his model, the factors show at least facial validity.
Other approaches for gaining insights into competencies required for different programming approaches or skills analyze interviews from experts in the questioned domain [51] or evaluate programmers’ behavior when performing certain tasks, e.g. programming tasks [52] or debugging tasks [49].
In prior experiments regarding process operators we tried to measure workload using a secondary task (e.g. communication and documentation) as, among others, proposed by Wickens [53], but could not detect signifi- cant effects [54].
Because for statistical significance a minimum of 15 subjects per different notation or approach, are necessary [55], it is obviously impossible to conduct experiments with such a high number of experienced application en- gineers under same conditions.
In ergonomics it is usual to conduct usability experiments in engineering design with students of mechatronics or mechanical engineering because they are future application engineers. Maintenance tasks are performed in Germany mostly by skilled workers, therefore apprentices and technicians are appropriate subjects.
3.1.3. Training
Kim [56] suggests that the complexity of the design task in the training period and the test period should be in- creased stepwise.
As Kim and Lerch [56], Ruocco [52] and others (i.e. [57]-[62]) point out, repetition is essential for learning object orientation. Ruocco decided for a stepped approach when teaching UML throughout a computer science program. He found that the application of UML during a database course and the incorporation of use case dia- grams, sequence diagrams and activity diagrams led to a richer and deeper exposure to UML.
In longitudinal studies, too, teaching beginners or freshmen in computer science or object orientation mostly goes along with repeated training [52] [57]-[62]. For training purposes, the pedagogic methods of repetition and fade-out, i.e. decreasing support by trainer from training step to training step, seem to be suitable (see for more details 63). In case of IEC 611131-3 or UML prior knowledge (see expertise in section subjects) acts as a dis- turbing factor if not equally distributed over subjects. Therefore training is necessary to adapt prior knowledge before conducting the experimental task. Time between training and experiment should be nearly the same for all subjects to avoid time depending differences in results.
3.2. Overview of Affected Variables (Usability Requirements)
In order to perform usability experiments, it is necessary to clarify how usability can be measured (affected va- riables) and which metrics can be used to make quantifiable statements about the advantageousness of the object of research (given by affecting variables).
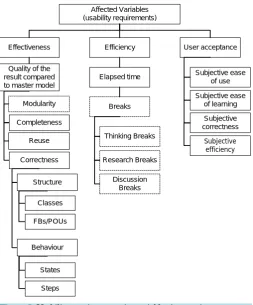
The standard ISO 9241-11 [64] includes studies regarding use efficiency and the satisfaction of the users suggesting the measurement of product’s usability in its context of use. According to this standard concerning usability requirements, the main affected variables, are (1) effectiveness, (2) efficiency and (3) user acceptance
(cp.Figure 2).
Effectiveness, i.e. the quality of the result depends on the completeness and correctness of an engineered so- lution. Efficiency is the effectiveness in relation to the effort to engineer a solution. Both measures analyze the models developed by the subjects during the experiment compared with a so called master model [64].
User satisfaction is the scale to which users are free of interference and their attitude to use a product [64]. Furthermore, the standard ISO 9241-110 contains dialogue principles for human-computer interaction as attri- butes to usability requirements. Those principles are suitability for task, for learning, for individualization, con- formity with user expectations, self-descriptiveness as well as controllability and error tolerance.
3.2.1. Effectiveness-Quality of the Resulting Model, Program
Affected Variables (usability requirements)
User acceptance Efficiency
Effectiveness
Quality of the result compared to master model
Elapsed time
Breaks
Subjective ease of use
Subjective ease of learning
Subjective correctness Completeness
Correctness
Thinking Breaks
Research Breaks
Discussion Breaks Structure
Classes Modularity
Reuse
Steps States Behaviour
FBs/POUs
[image:9.595.187.441.82.388.2]Subjective efficiency
Figure 2. Usability requirements, i.e. variables in experiments.
with the grade of correctness. Bevan (1995) [65] defined effectiveness in a different way as a product of quantity and quality:
(
)
(
goalstask taskgoals)
{ }
[ ]
Grade of completeness N E , D 0;1 , W 0,1
N E
= =
+ =
+
∑
∑
(2)(
)
(
goalsgoals goalsgoals)
{ }
[ ]
N E R
Grade of correctness , D 0;1 , W 0,1
N E
+ −
+
=
∑
= =∑
(3)(With N being the number of nodes, E the number of edges and R the number of errors with index task being the model of the subject and goal being the model of the experts taken as the correct solution in the master model).
Schalles compared only UML structure and behavior diagrams for business process modeling on an abstract level [44]. Applying his approach on MS would fall short. Using different notations modeled solutions are dif- ferent two regarding number of nodes and edges of the correct master model (see Appendix B for an example). As Strömmann [27] already realized often different correct solutions are created by different subjects, which should be evaluated equally good. Moreover, equality of nodes in a class diagram (abstract representation) and nodes and edges in an activity diagram (low level, object related) are rated equally by Schalles. In MS, the cor- rectness of structural model elements (e.g. classes or function blocks) should be measured differently than the correctness of low level behavioral model elements (e.g. correct steps or transitions from one state to another one [63]) due to the different degree of difficulty and ease of change in case of an error. Because IEC 61131-3 FBD is a language without nodes and edges Schalles approach is not feasible.
In accordance with Annett’s proposal of an Hierarchical Task Analysis (HTA) [66] the proposed evaluation scheme counts referring to a top down approach all detailed elements modeled by the subject, allowing similar scores e.g. for a combination of class diagrams and created objects in comparison to structure elements in FBD.
if its solution is logically and syntactically correct. As only correct task solutions, i.e. model elements are counted, it is not necessary to take additional errors into account. This results in the following term:
(
)
( )
solvedgoal[ ]
[ ]
Effectiveness (F) Grade of task completion T , D 0,1
T , W 0,1
= =
∑
= =∑
(4)(With N being the number of tasks). This approach has three main advantages:
First, it can be applied equally for all kinds of notations as long as the given task can be completed with it and there is no restriction as in [65], that only models with fewer nodes and edges than the master model can be evaluated.
Second, the task analysis can be used to select relevant tasks for evaluation and reduce the number of tasks to review, which then can be checked for logical and syntactical correctness, resulting in highly accurate data on task completion.
Third, no negative points for errors have to be used to calculate correctness, as this could manipulate results in an undesired way, e.g. errors lead to negative overall efficiency or errors in one part of the model nullify correct solution of others.
A fully automated analysis of the student’s model compared to the master model is nearly impossible. The difficulty in rating the results of an experiment is comparable to a fair grading of exams by distributing points for correct solutions, but more sophisticated. As a consequence, the development of the correction guidelines for the manual evaluation is required. Points are given by two evaluators independently with a necessary interrater reliability of at least 65%.
3.2.2. Efficiency
Regarding industrial application the time needed to engineer an automation task correctly is one of the most important measures, defined as efficiency in usability evaluation. The efficiency of a notation can be calculated through a combination of effectiveness and time required for execution of a task (ISO 9241-11:1998).
Accoring to Schalles [44], efficiency is defined as:
Efficiency (G) F T
= (5)
(With effectiveness F and time T).
If time is a freely selectable variable, this calculation basically provides a good comparison between notations in terms of effect per time. For the experimental design time may be fixed and restricted to a calculated amount of time with GOMS [67] or pre-experiments similar to an exam or left open for subject’s decision, delivering the modeling results when they feel ready. Fixed timing implies that the effectiveness measure already includes a statement on efficiency.
Nevertheless time should be recorded to allow analysis of modeling performance over time. Automatic sto- rage of the results in short time intervals allow, e.g. all 5 min or 7 min. the analysis of effectiveness per time in a more specific way.
3.2.3. User Acceptance-Subjective Aspects
Another possibly affected variable is the subjects’ acceptance of the used notation (or tool) and the automation task when executing the task. Here, usability questionnaires based on the standard DIN EN ISO 9241 are best practice.
Moreover, aspects as the subjects’ mental workload, control belief or motivation can be elicited (see Section 5, Section 4.7 for details).
For later analysis the affecting and affected variables and their relations will be evaluated to provide results for the comparison of the notation.
4. Selected Usability Studies
as structural and/or behavior modeling task. The automation task’s complexity is given by number and type of I/O, as well as weighted methods of class and number of variables in case of a classical PLC programming ap- proach using IEC 61131-3 FBD. The five related experiments are stronger related to case studies and to indus- trial application.
The seven experiments by the author’s team (4.2 - 4.8) highlight different complex automation tasks and dif- ferent automation systems characteristics as given inTable 1.
4.1. Related Experiments
4.1.1. Experiment O.1 and O.2: Measuring Size and Complexity, Estimation of Development Time
Lucas and Tilbury and Lucas [67] [68] demonstrate how task analysis could be usefully applied for the prelimi- nary assessment of the effectiveness and perhaps even the efficiency of logic control design methodologies. Lu- cas [67] calculated the time to create a simple logic design program on the basis of low level user operations, e.g. keystrokes, mouse clicks and mental operations, for IEC 61131-3 Ladder Logic Diagrams (LL 405 min), Petri Nets (PN 1100 min) and modular Finite State machine logic (mFSM 1500 min) showing the significant differ- ence given by the notation itself. To derive the necessary steps and the used strategies, i.e. copy & paste, manual copy, they observed engineers during the design process and surveyed the time needed. Moreover, Lucas and Tilbury [33] [67] provide a way of comparing the complexity of control logic models respectively code of a simple lab scale MS created with the above mentioned notations plus SIPN by analyzing existing programs. They introduce quantitative measurements of complexity of a piece of code: size (i.e. number of operations and state variables), modularity (number of modules) and connectedness. Additionally, they introduce four typical scenarios for accessibility of data from a programmer’s point of view, i.e. 1) single output debugging (specific questions regarding specific unexpected behavior in the machine), 2) system manipulation (how the user can manipulate the machine to achieve a desired state), 3) desired system behavior (desired behavior of the machine when examining only the schematics and the logic) and 4) unexpected system behavior (system’s response to unexpected events). Because all these questions refer to already existing code they can be categorized to main- tenance tasks. The four notations evaluated are compared regarding the four scenarios showing that Ladder Logic is still most appropriate for the first two but hard for Scenario 3 and 4, whereas Petri net, SIPN and mFSM are rated moderate or easy in Scenario 3, but minor in Scenario 1. LL is the small but very interconnected and mFSM the most modular, although largest program.
4.1.2. Experiment O.3 and O.4: Reusability Strategies
Strömman et al. [27] compared IEC 61499 with IEC 61131-3 in logic control design to foster reuse. Profession- als and researchers act as subjects programming a lifter application during a workshop. The resulting solutions differ totally showing different type of approaches, e.g. reuse of existing ST Code copied into an IEC 61499 frame, reuse of design patter, i.e. a state diagram, a mechatronic approach and classical IEC 61131 function block approach, concluding that guidelines to use IEC 61499 are required as well as an environment that fosters collaboration and exchange of information. The results were gained by model comparison and written feedback. Beforehand interviews were conducted to reveal the relevance of the study. Design approaches are context-de- pendent, i.e. the background of the designers, the existence of legacy software as well as business goals etc.
Based on this experience in experiment E0.4 Sierla et al. [28] organized one courses on IEC 61499 in 2005 to enable twenty practitioners and researchers to propose and negotiate about design alternatives in a team context with recorded interviews. In a second course in 2006 for professionals (3 subjects), researchers (3 subjects) and a standardization worker worked in a team representing the different social groups in a project evaluating the impact of team organization, knowledge integration, and software development method by an interview after the course. The benefit of a modular structure was realized as well as the risk of combining continuous control loops combined with sequential batch control logic. The necessity of shared guidelines, design patterns and tool sup- port was highlighted in more detail especially for batch control systems section.
4.1.3. Experiment O.5: Change of Sequence
modifications for all but EC and incorrect algorithm for SFC and EC. The results are separated according to the participants’ background, i.e. maintenance, planner, programmers and Rockwell personnel compared to the un- trained.
4.2. Experiment E1-Pure UML 1.4 and PLC Programming-Exploratory Study
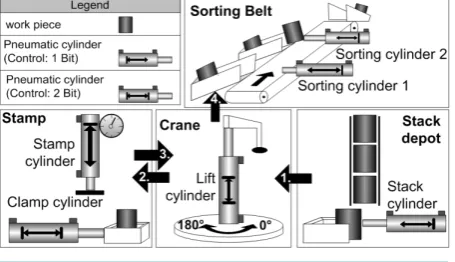
The series of experiment E1 explored the influence of group work compared to individuals, the influence of prior experience in PLC programming and modeling, different qualified subjects, i.e. bachelor students of elec-trical and information engineering with students integrated into companies (StiP) and technicians modeling and programming a pick & place unit [69]-[71] (seeFigure 3).
As affected variables the number of steps realized and their correctness was evaluated compared to a master model. The notations compared are UML, ICL and a control group only using S7 PLC programming languages IL, LL and FBD.
The results regarding quality of the model, i.e. error rates with 43.84% are disappointing. The high impact of qualification level on number of realized steps and errors is significant (seeTable 1, E1 results). The influence of prior knowledge which is in this experiment only based on subjective rating in a questionnaire is evident, too. In this experiment prior knowledge leads to halve the errors. Subjects rate the applicability of both UML and ICL for modeling structural aspects as very poor and for behavior as fair. Comparing groups (2 subjects) with individuals, groups reach a higher number of modeled steps in (23.44 compared to individuals 15.04; p = 0.01), but unfortunately the error rate is not significantly reduced. The experimental results, e.g. the identified errors in the developed models (see 9,Figure B1) are used as input for the further development of UML for MS (E2, E3, E4, E5). The pure models and high error rate reveal an insufficient training and experimental design, but also the weakness of pure UML 1.4 as modeling notation. Subjects claimed a reduced number of diagrams with a clear procedure for UML modeling, a tool to support modeling with integrated code generation, because paper and pencil is not accepted.
4.3. Experiment E2-Deployment Using Pattern and UML-PA
Based on the results of E1 a domain specific language UML-PA was developed with a reduced number of dia- grams and domain specific stereotypes [72]. The research question was to prove the benefit of such a domain specific language under architectural aspects, i.e. regarding deployment of control loops and the related sensors and actuators connected via a field bus. The subjects should identify correct pattern and connect them to model the system from sensors to actuators including its deployment and communication relations. For this reason UML-PA provides ports to model communication interfaces in so called instance structure diagram.
[image:12.595.201.429.579.710.2]The modeling approach using UML-PA and its instance structure diagram is compared with UML 2.0 dia- grams, i.e. class diagram, component diagram, composite structure diagram and deployment diagram. As auto- mation task a simplified real continuous hydraulic press was chosen with 30 control loops to be switched be- tween distance control and pressure control in case of overpressure. Each valve is equipped with a distance sen- sor to measure the valve opening and each control loop with a pressure transmitter. As additional input the press operator sets the set values of the pressure in the cylinder connected to the valve. The controllers output is the set value of the valve position and to the HMI the valve opening.
UML participants checked their results after 1.78 changes and took the results as guidance to find an appro- priate solution, UML-PA subjects checked their solution after 3.9 changes [72] (see also [73] for further infor- mation). The subjects properly analyzed the task and selected the given pattern establishing the required com-munication more efficient with UML-PA compared to UML 2.0 (seeTable 1, E2), which is easy to understand due to the additional effort, i.e. diagram changes, needed in UML 2.0. This idea is included in the SysML-AT approach discussed in E7. The identified breaks and time needed to understand the relation between different diagrams needs to be optimized regarding improvement of MDE (see E5).
Subjects criticized the restricted tool. The restricted tool support encouraged students to follow a trial and er- ror strategy which is unacceptable in a real industrial application.
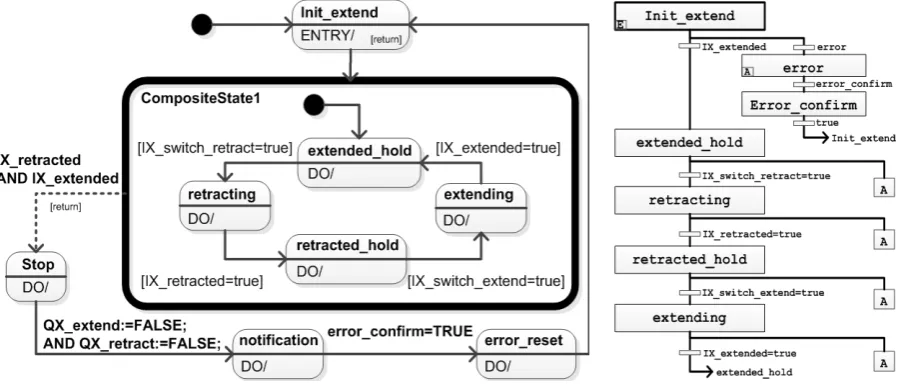
4.4. Experiment E3-Error Handling Using plcUML SC vs. IEC 61131-3-SFC
Fulfilling the requirements from E1, a reduced number of diagrams with tool support and code generation, Witsch and Vogel-Heuser developed a prototypical plcUML editor implementing UML class diagram and state chart in a real IEC 61131-3 run time development with integrated code generation in CoDeSys 3.x [74] [75] (see also [1]). The plcUML diagrams are integrated similar to SFC as additional language transformed internally into a ST language derivate. Yang et al. [76] applied orthogonal regions in UML state charts to model primary sys- tem functions and corresponding traversal features and concurrent behavior. Witsch et al. [74] introduce compo- site states as groups of states allowing to model error behavior for those grouped states. Evaluation with experts showed the strength of the composite states for error handling as well as mode of operation, the focus of expe- riment E3.
The experiment validates that using state charts is more efficient than using classical SFC in IEC 61131 to proof cyclically sensor states regarding inconsistency as well as timing errors in a single moving cylinder, i.e. a cylinder component of the pick &place unit (cylinder inFigure 3). The mean steps programmed per minute us- ing state charts with composite states was 1.98 points/min compared to classical SFC in IEC 61131-3 with 1.41 points/min given the same points for both solutions to be reached [77]. The modeling speed of the SC group was significantly higher than the SFC group even if the SC subjects didn’t use composite states.
The benefit of composite states is evident for error handling (seeFigure 4, left), i.e. in SC the error handling for all states can be handled by one exception transition out of a composite state instead of multiple transitions, i.e. after each activity, error handling activities follow. If an error in the exception handling algorithm is identi- fied or an additional condition needs to be included modifications to the process can be covered in one path in SC, compared to multiple paths in SFC (cf.Figure 4, right).
Subjects using composites states estimate their programming experience higher than those who didn’t use composites states. Many subjects criticized the absence of an automatic placement of elements in the tool, a site effect in the plcUML condition. In this experiment only exception handling was evaluated with a prototypical
[image:13.595.89.538.512.706.2]
tool. A more general design is discussed in Experiment E5 using plcUML with a more mature tool version.
4.5. Experiment E4-Sequence of Structure and Behavior Modeling in Workflow Using UML
with Elaborated Training Concepts
The research question to be answered is, whether subjects can be successfully forced to model structure, when asking them to model structure before behavior or whether behavior first is a good strategy for engineers to achieve proper model quality. Therefore a training concept as well as a subsequent experiment has been devel- oped together with researchers from instruction theory [78].
In a pre-experiment for E4 the main focus was to reveal whether the order of modeling is important for the quality of the model. The assumption was that students start with behavior modeling because it is easier for them, and then run short in time before finishing the structural model.
The pre-experiment was conducted without tool support only with paper and pencil after a training realized by a lecture and exercise in a very large classes (bachelor students 2nd semester mechanical engineering). The sub- jects were split in two groups: one group was told to start with structure modeling, the other with behavior mod- eling.
It showed that 35% of the subjects had problems to create suitable classes from similar objects of a plant in- cluding their attributes, and methods.
Examples of typical errors in the class diagram were (error rate in %):
• Objects were listed in addition to the classes, which inherit from the classes (23%). • Classes were used in which objects of the class occur as attributes (7%).
• Single objects were modeled without classes (5%) [78].
Overall, no significant differences concerning the modeling order could be found, but significant differences with respect to the trainer, as the two groups were trained by different teachers.
In order to eliminate that confounding effect in the main experiment one trainer trained for both groups. In that study, which has not yet been published, a larger sample (102 subjects) has been tested using the same pro- cedure and task as described for the pre-experiment above.
Here, the average participant reached 19.97 out of 46 points, i.e. lacked 26.03 points (SD = 9.1819). Regard- ing the performance measures, the “behavior first” group scored remarkably higher than the “structure first” group: While the participants in the “behavior first” group achieved 23.4 points on average (SD = 10.326; SE = 0.982), the mean value of the “structure first” group was only 18.4 out of 46 points (SD = 8.220; SE = 1.825).
In contrast, the structural modeling performance of the two groups was comparable (T = −0.972, df = 100, p = 0.33): participants in the “structure first” group achieved 12.26 points on average (SD = 5.029; SE = 0.601), while in the “behavior first” group they reached 11.14 points (SD = 6.067; SE = 1.072).
In the “structure first” group, the subjects reached only a mean of 6.14 out of 24 points in behavior modeling (SD = 5.083; SE = 0.607); in the “behavior first” group, however, the average behavior modeling performance was 12.25 points (SD = 6.112; SE = 1.080). This difference is highly significant (T = −5.278, df = 100, p = 0.00). As a result for the next experiments we learned that the class room training was not suitable enough and that forcing students to follow a specific modeling order is not helpful to improve structural models.
4.6. Experiment E5-plcUMLvs IEC 61131-3 FBD with Apprentices Optimizing Training,
Design and Analysis of Results-Exploratory Study
In this experiment the superiority of UML compared to FBD in a design task with a sophisticated training and with repetitive application of the notation, the ß-version of an UML tool (called plcUML), for a complex open loop control task and apprentices as subjects should be demonstrated. To allow further analysis between model- ing results and subjects’ abilities and the development of an individual training fitting to individual abilities in a next step, selected abilities are collected as well as user acceptance.
A hybrid learning environment (HLE), allowing to switching between computer-based and conventional in- structional designs] was developed and implemented. During training the groups repeatedly exercised program- ming and modeling tasks with increasing complexity (named fade out).
Several affecting variables related to abilities were obtained, i.e. grades in mathematics, German, automation, and mechatronics as well as cognitive capabilities, motivation levels, challenge, and workload (single instru- ments are described in [63]). As performance variable the programming/modeling achievement was evaluated. To obtain this value, the developed models/programs were stored (every 5 min) and analyzed manually by two evaluators, who compared them to a master model. The subjects performance was measured as number of cor- rectly modeled or programmed elements and compared with respect to structure, e.g. classes or FBDs on the one hand and behavior, i.e. state charts and FBDs on the other (for details see Appendix A). Unfortunately, the re- sults were disappointing, because an overall significant benefit of plcUML compared to FBD could not be de- tected, but nevertheless interesting results could be found, e.g.
• OO modeling and FBD programming show different relations to variables like cognitive abilities, experience, workload, and knowledge the students’ performance in the plcUML/CD + SC groups seems to be less re- lated to previous knowledge and cognitive abilities than students’ performance in the 61131/FBD groups [63].
• Subjects needed different times for structural modeling using UML/CD vs. FBD (see master model Figure 5). Subjects needed in average 6.22 minutes more time for UML class creation (in comparison to the time needed to create the FB structure. This difference is slightly not significant (ANOVA, F(1, 81) = 3.60, p = 0.06), cf. [63].
On the basis of the unexpected results further analysis of models, modeling process and the relation between model and results as well as subjective results have been conducted. Analyzing the main errors especially the errors in structural model, i.e. classes built:
• 42 subjects out of 44 built classes (including superfluous ones) as part of the structural model; • 23 out of 42 used these classes in their behavioral model;
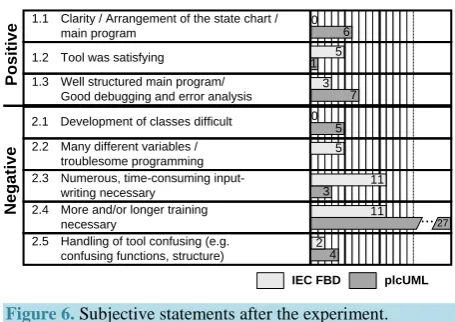
• 31 out of 42 modeled a second cylinder class separating storage cylinder and terminal cylinder, but 14 out of those 31 subjects built the second class identically besides the name, this indicates that they understood the class concept but use another type of abstraction, which is more related to the mechanical structure, i.e. a terminal and a storage cylinder are different instead of the software view in which both cylinders are identical. Analyzing tool and training effects gathered from the subjective rating from questionnaire (Figure 6), 27 subjects of the plcUML grouped asked for additional training. From subjects’ observation and analysis of the time needed, the authors expected the abstraction needed to build classes and the relationship between CD and SC to be the main challenge, because in the UML groups long thinking breaks occur before modeling classes. In the questionnaire only 5 subjects mentioned that development of classes is difficult, which is surprising regard- ing the above mentioned errors in building classes and the thinking breaks.
Regarding tool aspects (item 1.2 positive and item 2.5 negative inFigure 6) the plcUML tool seems to have some more problems.
Further subjective results gained from the questionnaires were: 1) Frustration levels were significantly higher in the UML group compared to the FBD group (p = 0.02); 2) The clearness of FBD was rated significantly higher than of UML (p = 0.017); 3) Behavior programming was rated significantly easier with FBD than with
1 2 3 4 5 6 7 8 9 10 11 12 13 14 15
PROGRAM Mainprogram
VAR_INPUT
Cylinder1:Cylinder; Cylinder2:Cylinder; Cylinder3:Cylinder; Cylinder4:Cylinder; Cylinder5:Cylinder; StorageCylinder1:Cylinder; StorageCylinder2:Cylinder; StorageCylinder3:Cylinder;
END_VAR VAR_OUTPUT
END_VAR
Cylinder
+ extended_actual : BOOL + OnOff_target : BOOL + retracted_actual : BOOL
+ capacitiveSensor_material_available : BOOL
extend() retract()
[image:15.595.178.445.583.694.2]2.1 Development of classes difficult 1.1 Clarity / Arrangement of the state chart /
main program
1 3 0
5
0 5 5
3
4 1.2 Tool was satisfying
1.3 Well structured main program/ Good debugging and error analysis
2.2 Many different variables / troublesome programming 2.3 Numerous, time-consuming
input-writing necessary 2.4 More and/or longer training
necessary
2.5 Handling of tool confusing (e.g. confusing functions, structure)
Positive
Negative
plcUML IEC FBD
7 6
11
27
11
2
[image:16.595.198.426.81.242.2]...
Figure 6. Subjective statements after the experiment.
UML (p = 0.012). And 4) subjective quality estimation and factual quality match far better with UML than with FBD (p = 0.025).
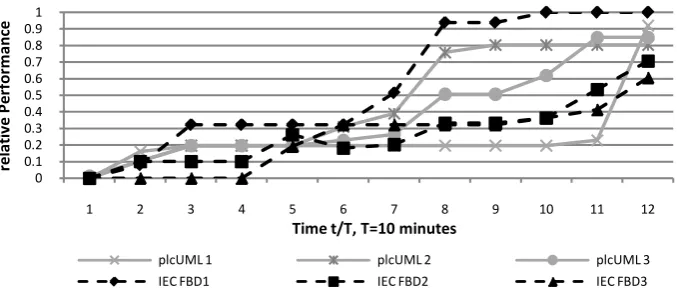
Because of the observed thinking breaks, we analyzed the modeling progress over time (points over time) in a random sample of only three subjects (with similar quality of model) we found differences in plcUML and IEC group, in the plcUML group there is a longer period of time until points referring to the master model are ga- thered and there is a clear ramp in points compared to the more steady increase of points in FBS group (Figure 7).
For further experiments detailed analysis of modeling progress is needed and, therefore, the cycle time of storing data needs to be reduced and a more efficient approach of analyzing subjects’ modeling process over time needs to be developed. Details for the analysis and rating of subjects’ models compared to the master mod- el are given in Appendix A.
Subjects debugged at different times, some at the beginning and others at the end of the experiments with a nearly complete model. The analysis of debugging is necessary to find errors and will be focused in future work.
The design of the experiment including training and data analysis was appropriate delivering detailed rela- tions between abilities and model quality, but revealing still shortcomings of plcUML as notation for apprentices in design tasks. Our assumption is that the necessary abstraction to build classes is too high for this group of subjects. These results fit to the notational complexity of class diagrams of Schalles. Therefore, in further expe- riments technicians and engineers will be included as subjects with a higher level of knowledge and experience in PLC programming. Additionally, different levels of task complexity will be tested.
4.7. Experiment E6-Maintenance Task in Early Phases of Notation Development with
SysML-AT vs. Continuous Function Chart (CFC)
The research question of experiment E6 is how to evaluate three notations in a qualitative way in a very short period of time for training and experiment in an early phase of the development of a notation. E6 evaluates dif- ferent modeling and programming notations (see also [16]), i.e. Parametric diagram (PD) of SysML-AT [26] vs. Continuous Function Chart (CFC) and IEC 61131-3 Structured Text (ST), regarding a maintenance task, i.e. understandability (analysis and interpretation according to [31]) of model contents in a qualitative way. The ex- periment was based on three different simple models of physical laws (about 4 - 5 sub-blocks and 7 - 8 va- riables), with each model described in every considered notation. Because the evaluation should take place in an early design phase and the time needed should be very short, tool support is not applicable. Bachelor students of mechanical engineering worked without a tool after a very short training, passing all three different notations and all three models. The sequence of the notations was permuted for each subject (seeFigure 8) to eliminate learning effects.
Figure 7. Modeling progress over time for 3 subjects of each group.
Figure 8. Experimental design of E6-maintenance task.
the results, in questionnaires that tested the subjective cognitive demand, the subjects rated the PD as the most understandable notation. Furthermore, all of the subjects answered, that they experienced a learning effect re- gardless of the different notations they used.
The results of a focus group that was conducted for additionally evaluating the SysML-AT [25] also indicated that the developed modeling approach is well suited for automation software modeling.
4.8. Experiment E7-Conceptual Engineering of Structural aspects of Distributed
Networked Automation Systems (NAS)
The research question in this experiment is whether additional support in structural modeling of NAS realized with characteristics and pattern is beneficial in the conceptual design or whether the resulting complexity hind-ers the benefit. Besides the instruments regarding user acceptance are more elaborated and should give answhind-ers in more detail in relation to quality of models.
As the results of E5 and E6 show, plcUML and SysML-AT have positive influence on the programming of a PLC. Following Sierla [28] and the difficulties identified for engineering of distributed systems E7 evaluates a SysML-AT based notation and workflow vs. CFC for a high-level design of NAS in MS (see also [16] [45]). The evaluated approach focuses on the overall design of NAS integrating notation SysML-AT being the suc-cessor of plcUML. The SysML-AT based concept contains a workflow procedure referring to a life cycle model (following requirements E1) including communication and real time requirements for a hybrid control task (ex-periment E7 a). Additionally, characteristics (E7 b) and characteristics plus patterns in (E7 c) are compared to the pure notation and workflow procedure. Conditions b and c are only qualitative measures, because of the small group size.
The approach covers the modeling of automation hardware and software as well as of functional and non- functional requirements. From described requirements the functions that need to be implemented can be derived and captured within the same model. Hardware elements like sensors, actuators and nodes and their interfaces and properties are considered within the modeling approach as well. This enables the integration and linking of hardware and software models [79]. The notation is based on the SysML Block and Requirements diagram using ports to represent software and hardware interfaces (Refer also to [80]. Duration of experiment was not re- stricted, but taken as measure (mean given inTable 1, E7).
Characteristics as well as pattern supported subjects in solving the task, i.e. design of the automation concept 0
0.1 0.2 0.3 0.4 0.5 0.6 0.7 0.8 0.91
1 2 3 4 5 6 7 8 9 10 11 12
rel
at
iv
e P
er
fo
rm
an
ce
Time t/T, T=10 minutes
plcUML 1 plcUML 2 plcUML 3
[image:17.595.201.427.255.356.2]of a coking plant including belt synchronization without implementation. Main task of the experiment was to conceptually design a closed loop for speed synchronization which included three belts. This comprised all ne- cessary functions, interfaces and relations to the sensors and actuators. The internal behavior and control algo- rithms were not required, i.e. the structural part of the model needs to be designed. Characteristics detail re- quirements as well as the later design solution including element relations. During the design the comparison of requirement characteristics and solution characteristics help to decide if the solution fits the requirements (cp.
Figure 9).
Additionally patterns, divided into functional and deployment patterns, help to find a solution. Functional patterns include proposals and support the engineer in the development of the functional model. Deployment patterns indicate distribution alternatives of functions and support the engineer in the development of the dep-loyment model [82].
The models subjects stored after finishing the given task were analyzed compared to a master model. The re- sults show major difference between the subjects’ solutions and master model, i.e. experts’ best practice regard- ing module structure. Similar to Sierla [28] different possible solutions were detected, i.e. most subjects chose a functional oriented modeling approach, instead of a mechatronic approach taking modularity, reuse and archi-tectural aspects of NAS into account. The experiment intended that students follow a mechatronic approach, therefore the master model was built realizing the mechatronic paradigm. In further experiments either the me- chatronic approach needs to be integrated into the training or subjects’ mental models need to be collected before- hand.
Nevertheless, the experiments show a significant benefit of SysML-AT compared to CFC (seeTable 1, E7 a to c column results). Regarding notation with life cycle model, i.e. NM subjects gained significant better models compared to CFC (123.1 mean compared to 182 max. points, the best subject gaining 144 points, see appendix C). Using characteristics additionally (NMC), subjects improved their models again. But for those experiments only qualitative results are available due to the limited number of five subjects. Regarding user acceptance measures subjects stated less mental demand using pattern (seeTable 3), i.e. NMCP has lowest mental demand with 10.75 of max 20 points. (the higher the more mental demand). The motivational factor “fear of failure” was most pronounced in the group with patterns and characteristics (NMCP). Furthermore, this group showed high external control beliefs meaning that subjects strongly related the outcome of the results to external circums-tances and high fatalistic externality meaning that success is assessed as depending on fate, fortune, and chance and, however, subjects perceived low mental demand during task performance. In addition, according to usabil-ity aspects, suitabilusabil-ity for task was best evaluated for group with characteristics (NMC). Suitabilusabil-ity for individu-alization of patterns was rated significant lower than both other conditions.
Based on UML-PA and E2 as well as the experiences gained and rules derived for E5 (including task devel-opment, training and tool development) and experimental design in general (see 6) the experimental design of E7 was developed appropriately evaluating also the derived rules (see 6). E7 evaluated the benefit of NM for NAS and hybrid control with real time and communication requirements. Even relations to abilities realized in E5 could be further developed with a more advanced questionnaire. Results reveal more relations to human fac-tors, e.g. mental workload, and usability measures. For further engineering support the challenge is to find a compromise between supports by characteristics and pattern and the approaches’ complexity.
ModelElement
Characteristic CharacterizedEntity
Attribute
SystemElement ElementRelation System
1
*
is characterized by4
is characterized by4
consists of
interacts with4
Table 3. Results of human factors and usability measurement in E7.
Variable
Mean
NM NMC NMCP p
Motivation
Fear of failure 14.26 15.00 23.67 p < 0.05
Control beliefs
Fatalistic externality 45.95 55.20 60.75 p < 0.05
Mental workload
Mental demand 14.28 14.80 10.75 p < 0.05
Attributes for usability requirements
Suitability for task 27.35 30.00 20.75 p < 0.055 Suitability for individualization 26.59 26.00 13.75 p < 0.001
4.9. Summary of the Experiments
All experiments focus on the design phase besides E6, a centralized single PLC as control hardware besides E7 and students as subjects besides E1 and E5.
• E1 was the first experiment exploring the method of usability evaluation in logic design engineering with a single closed loop controller and compared pure UML 1.4 and PLC in a first attempt without the support of an engineering tool and with a large unstructured task.
• E2 focused on a hybrid automation task including communication with the focus to support deployment by simple UML-PA pattern compared to classical UML 2.0 with restricted tool support and a narrow engineer- ing task.
• E3 focuses on error handling comparing plcUML State Chart to Sequential Function Chart (SFC) in IEC us- ing a very simple automation sub-task and a short classical training.
• E4 focuses on SC vs. IEC 61131-3-SFC sequence of structure and behavior modeling in workflow using UML 2.0 with a didactically more elaborated but classically conducted training concepts in smaller sub groups with the goal to increase the quality of the structure model.
• E5 is similar to E1 also an exploratory experiment further developing the method of usability engineering experiments using a real software engineering tool with embedded UML the so called plcUML compared to IEC 61131-3 FBD with apprentices optimizing repetitive training, and exercise, an elaborate training envi- ronment and smaller automation task with reusable sub-process, including also human factors and prior knowledge.
• E6 focuses on a maintenance task in the early phases of notation development with SysML-AT vs. Conti-nuous Function Chart (CFC) to show the benefit of easy and quick sub-experiments in the development pro- cess of the notation.
• E7 Conceptual Engineering of Structural aspects of distributed networked automation systems (NAS) in- cluding a procedure for life cycle support and characteristics for pattern selection and reuse with a detailed analysis of user acceptance including motivation.
In every single description of an experiment the research questions as well as the most important aspects of the experimental design, results and lessons learned regarding usability aspects are discussed as well as results for further development of MDE, i.e. notation, procedure and tool. Most experiments are based on prior experi- ments and notational development resulting from a prior experiment is tested in one of the following experi- ments.
![table, SFC, idioms Friedrich et al. [69]-[71]](https://thumb-us.123doks.com/thumbv2/123dok_us/8132459.797282/6.595.61.539.98.723/table-sfc-idioms-friedrich-et-al.webp)

![Figure 9. Characteristics meta-model [81].](https://thumb-us.123doks.com/thumbv2/123dok_us/8132459.797282/18.595.200.428.566.707/figure-characteristics-meta-model.webp)
