© 2017, IRJET | Impact Factor value: 5.181 | ISO 9001:2008 Certified Journal | Page 1620
NON-LINEAR STATIC PROGRESSIVE COLLAPSE ANALYSIS OF HIGH RISE
R.C.C. STRUCTURE
Rucha Thombare
1, Dr. H. R. Magarpatil
21
Postgraduate student, Structural Engineering department MIT, Pune, Maharashtra.
2Professor, Structural Engineering department, MIT, Pune, Maharashtra.
---***---Abstract -
As per recent developments in construction,the architects required to plan the high rise structures in RCC. Unfortunately due to some reasons such as gas explosion, terrorist attack, fire etc. high rise structures undergoes some major component failure. Because of the failure of major component, sometimes part of the structure or whole structure tend to collapse. In other words this behaviour of structure is called as progressive collapse In this project it is proposed to carry out progressive collapse analysis of 12 storey RC frame building by removing different column one at a time as per the GSA guidelines. Building consists of 6 X 5 bay 3 m in X and Y- direction and designed by Indian code. Structural model of building has been created in ETABS and loads are applied as per GSA guidelines, for evaluation of progressive collapse nonlinear static method of analysis has been used. As per given in GSA, three column removal cases for 1st floor has studied like corner column C1, interior column C43 and exterior column C47. For these cases non linear static analysis has done and joint displacements for three column removal cases are evaluated. Also, PMM ratio and axial force for adjacent columns and bending moments for adjoining beams are evaluated.
Results are obtained that, for progressive collapse of interior column is more critical than other two locations ie. Corner and exterior column.
Key Words
: Progressive Collapse , non linear static analysis, Etabs 2015.1.INTRODUCTION
Progressive collapse is a term now a days used worldwide. progressive collapse phenomenon is initiated by the failure of one or more load carrying members. At the time of failure, to transfer excessive load, structural elements structure will seek alternate load paths. sometimes structure may not be designed to resist additional loadings. Failure of overloaded structural elements will cause further redistribution of loading, this process will continue till the equilibrium is reached. when elements may reached equilibrium already a large part of structure has already collapsed. The resulting overall damage may be disproportionate to the damage in the local region near the lost member.
The American Society of Civil Engineering (ASCE, 2005) is the only mainstream standard which addresses the issue of progressive collapse in some detail. The guidelines for progressive collapse resistant design are noticeable in US Government documents, General Service Administration (GSA, 2003) and Unified Facility Criteria (UFC, 2009). The GSA guidelines have provided a methodology to diminish the progressive collapse potential in structures based on Alternate Path Method (APM). It defines scenarios in which one of the building’s columns is removed and the damaged structure is analyzed to study the system responses. With the current scenario of increasing reasons for disaster like situation at industrial or residential workplace. The main objective of this study is to implement GSA guidelines for RCC structure in three dimensional, which are designed according to Indian standard codes to assess the vulnerability behaviour. The procedure have been carried out is Non Linear Static (NSL) according to the guidelines, and analyzed by using by finite element software Etabs 2015.
2. LITURATURE SURVEY
© 2017, IRJET | Impact Factor value: 5.181 | ISO 9001:2008 Certified Journal | Page 1621 investigates the existing structure’s potential to fail due to
progressive collapse. Author concluded that the existing building is unique because second floor was collapsed at the initial stage of experiment[4]. Authors Yanchao Shi , Zhong-Xian Li , Hong Hao (2010) studied RC structureunder blast loading prone to progressive collapse. A new method for progressive collapse analysis of reinforced concrete (RC) frame structures by considering nonzero initial conditions and initialdamage to adjacent structural members under blast loading is proposed And it is found it gives better prediction[5]. Weifeng Yuan and Kang Hai Tan (2011) to incorporate the pancake type progressive collapse of multistory structure. This paper concludes that the local member failure in a multi-storey structure may lead to a global progressive collapse[6]. In this present study by A.R. Rahai, M. Banazadeh, M.R. SeifyAsghshahr& H. Kazem (2012) progressive collapse in RC structures resulting from both instantaneous and gradual removal of columns is observed[7].Rakshith K G, Radhakrishna (2013) studied RCC structure of 12 story. Paper concludes that, to avoid the progressive failure of beams and columns, caused by failure of particular column, adequate reinforcement is required to limit the DCR within the acceptance criteria[8]. Shefna L Sunamy, Binu P, Dr. Girija K (2014) describes linear static analysis of a multi-storeyed building, authors concludes that seismically designed building having good resisting capacity to progressive collapse[9].Ram Shankar Singh, Yusuf Jamal, Meraj A. Khan (2015) studied five storey reinforced concrete framed structure symmetrical and Unsymmetrical by geometry and conclude that to avoid progressive collapse, adequate reinforcement is required to limit the DCR within the acceptance criteria[10]. authors A. Choubey and M.D. Goel (2015) studied RCC building designed based on Indian standard code of practice is considered and concludes that the effect of transferring the load is more on the nearest member of the removed member and negligible when moved away from removed column[11]. Ram Shankar Singh,Yusuf Jamal, Meraj A. Khan (2015) states that seismically designed building columns have inherent ability to resist progressive collapse. To avoid the progressive failure of beams and columns, caused by failure of particular column, adequate reinforcement is required to limit the DCR within the acceptance criteria[12].
3. MODELLING OF STRUCTURE
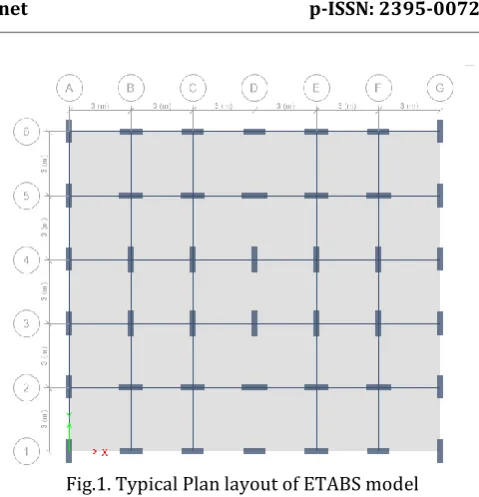
[image:2.595.318.558.67.316.2]To observe the structural behavior of RCC building for progressive collapse it is necessary to build up 3D model by using finite element model, analyse and design that model by using ETABS(15) . Here are some tables related to modeling of structure
Fig.1. Typical Plan layout of ETABS model
TABLE 1.MODELLING DETAILS FOR IRREGULAR STRUCTURE
Sr. no.
Particulars Description
1 Type of Structure
RCC Framed structure
2 Type of Building
Commercial Building
3 Number of stories
G+12
4 Height of Building
42m
5 Spacing in X-Direction
18m
6 Spacing in Y-Direction
15m
7 Material M30, Fe500
8 Thickness of Slab
150mm
9 Codal
Provision
[image:2.595.315.572.364.722.2]© 2017, IRJET | Impact Factor value: 5.181 | ISO 9001:2008 Certified Journal | Page 1622
4. METHODOLOGY
This Study is based on analysis of RCC structure for progressive collapse, Considering Sudden Loss of Column as a design Scenario and considering different locations for sudden loss of column and its effect on progressive collapse. There are many codes and Guideline available worldwide but most of the research work uses the GSA guideline.For this research work, there are various methods to analyse the structures and investigate their response to the progressive collapse phenomenon, we used GSA for further guideline. The aim of this work is to study Progressive Collapse over the sudden loss of a column, to study the Limiting Extent of damage to a localised area and comparative study of collapse as per column locations.
There are many methods to analyse progressive collapse such as linear static analysis, Non linear static analysis, linear dynamic analysis, Non linear dynamic analysis are given as per GSA guidelines. But for our research work we are analysing model for non linear static analysis.
4.1 Non Linear static analysis procedure
Nonlinear static procedure is effective for more than 10 stories structure. For structure which is less than 10 stories. Once the nonlinear model, both materially and geometrically is modeled , the loads are increased with a Dynamic Increase Factor (DIF) by taking into account the inertia effects only. Then column is eliminated and consequent load is applied to the model.
To model, analyze, and evaluate a building, employ a three-dimensional assembly of elements and components. Create one model for framed structure. Apply non linearity conditions and Dynamic Increase Factor. Apply plastic hinges as per ASCE 41 and FEMA. Then apply loadings as per GSA guidelines. Then run non linear analysis and find out results as per our considerations.
4.2 Load Cases for Non Linear static analysis
Case I: Force Control action Quf for linear static G LF = Ω LF [1.2 D + (0.5 L or 0.2 S)] (1)
Where,
G LF = Increased gravity loads for force-controlled actions for Linear Static analysis.
Ω LF = Load increase factor for calculating force-controlled actions for Linear Static analysis; use appropriate value for framed or load-bearing wall structures.
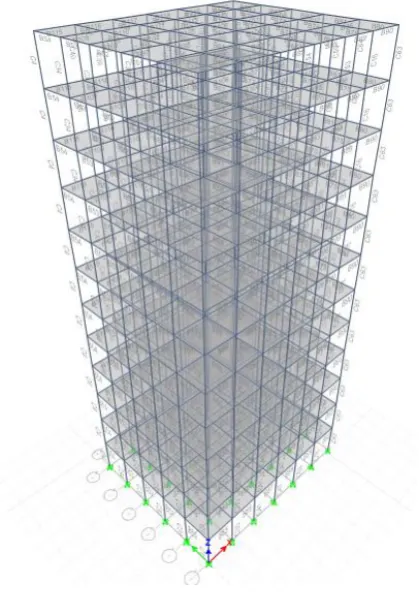
[image:3.595.61.221.106.359.2]Case II: Force Control action Quf for non linear static Apply the following increased
Fig.2 .2D Elevation of ETABS Models
[image:3.595.60.270.411.709.2]© 2017, IRJET | Impact Factor value: 5.181 | ISO 9001:2008 Certified Journal | Page 1623 GN= ΩN [1.2 D + (0.5 L or 0.2 S)] (2)
Where,
GN = Increased gravity loads for Nonlinear Static Analysis
D=Dead load
S= Snow Load
ΩN = Dynamic increase factor for calculating deformation-controlled and force deformation-controlled actions for Nonlinear Static analysis.
Gravity Loads for Floor Areas Away from Removed Column or Wall. Apply the gravity load combination in below Equation to those bays not loaded with GN
G = 1.2D + (0.5 L or 0.2 S) (3)
For those bays not immediately adjacent to the removed element the load combination is the same for both deformation and force- controlled action.
4.3Loading data used for modeling
4.4 Progressive collapse analysis
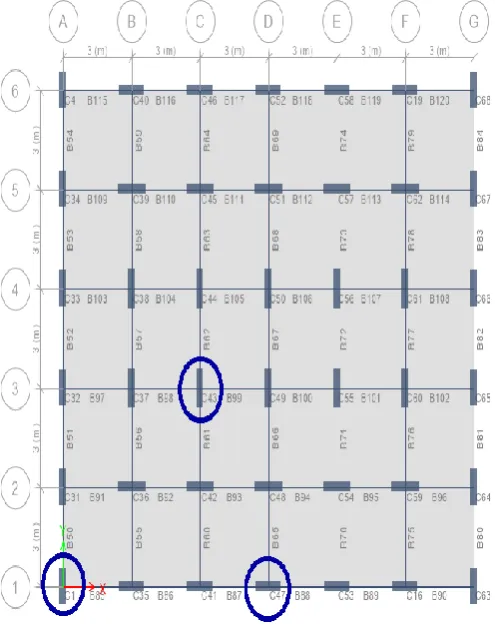
In this analysis, we are considering 3 different cases of column removal. Each of them from 1st story
Case1 : analyzed for sudden loss of corner column C1
Case2 : analyzed for sudden loss of middle column C43
[image:4.595.365.526.133.327.2]Case3 : analyzed for sudden loss of centre column C47
[image:4.595.324.572.379.697.2]Table 2. Loading Data
Fig.4 Detail Description of Model
[image:4.595.45.266.413.653.2]© 2017, IRJET | Impact Factor value: 5.181 | ISO 9001:2008 Certified Journal | Page 1624
5. RESULTS AND DISCUSSION
5.1 RESULTS FOR REMOVAL OF COLUMN C1
Graph. 1. Joint displacement of column C1 Joint displacement of column C1 before column removal was 8mm but due to sudden loss of column C1 and after Non Linear Static Procedure carried out, joint displacement was suddenly increased to 16.2mm due to less load carrying elements carries extra load.
PMM ratio of original structure is in a range of 0.8 to 4 but due to sudden column removal load distributed to nearest member and the PMM ratio is suddenly increases above the removal location max upto 5.54
Graph. 2. PMM ratio For column no C1
From graph 2, PMM ratio or % rebar of original structure is in a range of 0.8 to 3.7. initially column had two supports but due to sudden loss of column it transform into cantilever and PMM ratio (%rebar) minimized to 0.8
.
Graph. 3. PMM ratio For column no C31
Graph. 4. PMM ratio For column no C35
PMM ratio of original structure is in a range of 0.8 to 4 but due to sudden column removal, load distributed to nearest member and the PMM ratio is suddenly increases above the removal location max upto 5.52.
© 2017, IRJET | Impact Factor value: 5.181 | ISO 9001:2008 Certified Journal | Page 1625
5.2 RESULTS FOR REMOVAL OF COLUMN C43
Graph. 10. PMM ratio of column no C43
From graph of PMM ratio or % rebar of original structure is in a range of 0.8 to 3.84. initially column had two supports but due to sudden loss of column is converted into cantilever and PMM ratio (%rebar) minimized to 0.8 for all above stories.
Graph. 11. PMM ratio of column no C37 Graph. 6. BM of beam no. B85
From graph it is observed that after removal of first floor column BM value of B85 changes largely near the column removal location after that effect is neutralized.
Graph. 7. Axial Force of column no C35
Axial force is important factor to check column is safe or not. After removal of column the force taken by this member is transfer to column C35 and C31. Hence axial forces on that column after removal of column C1 is suddenly increased. Values of increased loads are given in graph.7 and 8.
Graph. 8. Axial Force of column no C31
© 2017, IRJET | Impact Factor value: 5.181 | ISO 9001:2008 Certified Journal | Page 1626 Initially PMM ratio of original structure is in a range of 0.8
to 3.16 but due to sudden column removal, load distributed to nearest member and the PMM ratio is suddenly increases above the removal location max upto 5.76.
Graph. 12. PMM ratio of column no C42
PMM ratio of original structure is in a range of 0.8 to 3.67 but due to sudden column removal, load distributed to nearest column and the PMM ratio is suddenly increases above the column removal location max upto 5.76
.
Graph. 14. PMM ratio of Column no. C49
From graph no.14 PMM ratio of original structure is in a range of 0.8 to 3.36 but due to sudden column removal, load distributed to nearest member and the PMM ratio is suddenly increases above the removal location max upto 5.85.
Graph. 15. Bending Moment of beam no. B61 After removal of column C43, adjacent beams transform their form from simply supported to cantilever beams. From above graph, bending moments before removal of column and after removal of column are varies from 15 to 25.15. bending moments are increased after column removal.
Graph. 16. Bending Moment of beam no. B62 Graph. 13. PMM ratio of column no. C44
© 2017, IRJET | Impact Factor value: 5.181 | ISO 9001:2008 Certified Journal | Page 1627 From graph it is observed that after removal of first floor
column BM value of B62 changes largely near the column removal location after that effect is neutralized.
Graph. 17. Bending Moment of beam no. B98 After removal of column C43 it is observed that after removal of first floor column, BM value of B98 changes largely than before.
Graph. 18. BM of beam no B99
After removal of column, simply supported beams act like a cantilever beams. Bending moments increased suddenly after column removal.
Graph. 19. Axial load on column no C37
After removal of column C43 the force taken by the column is transfer to adjacent columns. Hence axial forces on that column after removal of column C43 is suddenly increased.
Graph. 20. Axial load on column no C44
After removal of column C43 the force taken by this member is transfer to adjacent column C37, C44, C42 and C49. Hence axial forces on that column after removal of column C43 was suddenly increased.
Graph. 21. Axial load on column no C42
When column C43 is removed, load on column is distributed to the columns of vicinity. C43 is interior column and surrounded by 4 columns. After removal of column load is transfer to the surrounded columns and axial load on the columns is suddenly increased.
Graph. 22. Axial load on column no C49
© 2017, IRJET | Impact Factor value: 5.181 | ISO 9001:2008 Certified Journal | Page 1628
5.3 RESULTS FOR REMOVAL OF COLUMN C47
Graph. 23. Displacement of column no. C47
Displacement at column C47 is changes after removal of column is considerable. Before removal of column initial displacement was min. 1.2mm and max. 8, after removal of column max displacement is 15.5 mm.
Graph. 24. PMM ratio of column No.C47
From graph of PMM ratio or % rebar of original structure is in a range of 0.8 to 4.37. initially column had two supports but due to sudden loss of column is converted into cantilever and PMM ratio (% rebar) minimized to 0.8 for all above stories.
Graph. 25. PMM ratio of column No.C41
PMM ratio of original structure is in a range of 0.8 to 4.36 but due to sudden column removal, load distributed to nearest column and the PMM ratio is suddenly increases above the column removal location max upto 5.55.
Graph. 26. PMM ratio of column No.C48
From graph no.14 PMM ratio of original structure is in a range of 0.8 to 3.69 but due to sudden column removal, load distributed to nearest member and the PMM ratio is suddenly increases above the removal location max upto 4.1.
Graph. 27. PMM ratio of column No.C53
PMM ratio of original structure is in a range of 0.8 to 4.36 but due to sudden column removal, load distributed to nearest column and the PMM ratio is suddenly increases above the column removal location max upto 5.55.
Graph. 28. Bending Moment of beam no.B65
© 2017, IRJET | Impact Factor value: 5.181 | ISO 9001:2008 Certified Journal | Page 1629
6. SUMMURY AND CONCULSION
In this study we analyze G+12 structure for non linear progressive collapse. Following observations are made.
1.for removal of C1, C43 and C47, joint displacement is larger in C43 ie. at Interior column.
2.PMM ratio (% rebar) is suddenly increasing at interior column location as compare to corner and exterior column locations.
3.BM values of beam are largely increasing at interior column than other two locations because these beams get affected more.
4.Axial forces are increased in locations near to interior column, after removal of exterior column C43.
From this study it is observed that maximum readings are obtained for interior column removal and out of three Graph. 29. Bending Moment of beam no.B87
After removal of column, simply supported beams act like a cantilever beams. Bending moments increased suddenly after column removal. Initially BM is max. 13.3KN-M after removal of column it reaches 17.8KN-M .
Graph. 30. Bending Moment of beam no.B88
After removal of column, simply supported beams act like a cantilever beams. Bending moments increased suddenly after column removal. Initially BM is max. 13.1KN-M after removal of column it reaches 17.89KN-M .
Graph.31. Axial load of column C41
When column C47 is removed, load on column is distributed to the columns of vicinity. C47 is exterior column and surrounded by 3 columns. After removal of column load is transfer to the surrounded columns and axial load on the columns is suddenly
increased.
Graph. 32. Axial load of column C48
After removal of column C47 the force taken by the column is transfer to adjacent columns. Hence axial forces on that column after removal of column C47 is suddenly increased.
Graph. 33. Axial load of column C48
© 2017, IRJET | Impact Factor value: 5.181 | ISO 9001:2008 Certified Journal | Page 1630 locations, middle central location ie. Interior location
(C43) shows the effects of progressive collapse larger that other two cases. And that column location is critical for progressive collapse.
When interior column is failed due to some reasons then building undergoes major collapse than corner or any exterior column.
7.References
[6] Weifeng Yuan and Kang Hai Tan,"Modeling of progressive collapse of a multi-storey structure using a spring-mass-damper system" Structural Engineering and Mechanics, Vol. 37, No. 1 (2011) 79-93
[7] A.R. Rahai, M. Banazadeh, M.R. SeifyAsghshahr& H. Kazem," Progressive Collapse Assessment of RC Structures under Instantaneous and Gradual Removal of Columns" 15 WCEE,LISBOA 2012.
[8] Rakshith K G, Radhakrishna, " Progressive Collapse Analysis Of Reinforced Concrete Framed Structure" IJRET: International Journal of Research in Engineering and Technology,2013.
[9] Shefna L Sunamy, Binu P, Dr. Girija K," Progressive collapse analysis of a reinforced concrete frame building." International journal of civil engineering and technology IJCIET),Volume 5, Issue 12, December (2014), pp. 93-98 (2009)
[10] Ram Shankar Singh, Yusuf Jamal, Meraj A. Khan"Progressive collapse analysis of reinforced concrete symmetrical and unsymmetrical framed structures by Etabs." International Journal of Innovative Research in Advanced Engineering (IJIRAE) ISSN: 2349-2763 Issue 12, Volume 2 (December 2015)
[11] A. Choubey and M.D. Goel, " Progressive collapse analysis of RCC structures", international journal of optimization in civil engineering, Int. J. Optim. Civil Eng., 2016; 6(2):287-301,(2015).
[12] GSA. Progressive collapse analysis and design guidelines for new federal office buildings and major modernization projects. The US General Services Administration; 2013
[13] IS 456: (2000) Plain and reinforced concrete- code of practice, Bureau of Indian Standards, New Delhi.
[14] IS 1893 (Part 1), Indian Standard criteria for Earthquake Resistant Design of structures, Part 1: General Provisions and buildings (Fifth Revision), New Delhi.
[15] ASCE 7-10, Minimum Design Loads for Buildings and Other Structures, American Society of Civil Engineers, 1801 Alexander Bell Drive, Reston, VA 20191-4400.
[16] UFC 4-023-03, Design of Buildings to Resist Progressive Collapse, dated 14 July 2009,including change 2 – 1 June 2003.
[17] FEMA, “World Trade Center Building Performance Study, Federal Emergency Management Agency, Federal Insurance and Mitigation Administration, Report403, 2002(excerpt in ASCE, Civil Engineering, Vol.72, No. 5, May).
[18] Krishna Kant Chaubey, A.B.Pujari, Dr. Venkata Dilip Kumar P, " Progressive Collapse Analysis of Low Rise Steel Frame Structure With and Without Bracing System" IRJET, Jan -2017.
[1] R. Shankar Nair, Ph.D., P. E., S. E., “Progressive Collapse Basic,” Modern Steel Construction, 2004.
[2] Wibowo,H. .andLau,D.T.,"Seismic Progressive Collapse : Qualitative Point of View." Civil Engineering Dimension, Vol. 11, No. 1, March 2009, 8-14.
[3] Bruce R. Ellingwood Robert Smilowitz Donald O. DusenberryDatDuthinh H.S. Lew Nicholas J. Carino ,"Best Practices for Reducing the Potential for Progressive Collapse in Buildings", National Institute Of Standards And Technology, 2007.
[4] HalilSezen (PI) and Kevin A. Giriunas, " Progressive collapse analysis of an existing building" The Ohio State University, May 2009.