http://dx.doi.org/10.4236/wjnst.2015.51002
How to cite this paper: Atajafari, H., Nematollahi, M., Hashemi-Tilehnoee, M. and Rafiee, N. (2015) Validation of RELAP5/ MOD3.2 Code for Flashing-Induced Instabilities in a Single Channel. World Journal of Nuclear Science and Technology, 5, 6- 17. http://dx.doi.org/10.4236/wjnst.2015.51002
Validation of RELAP5/MOD3.2 Code
for Flashing-Induced Instabilities in
a Single Channel
Hamed Atajafari
1*, Mohammadreza Nematollahi
2, Mehdi Hashemi-Tilehnoee
3,
Nasim Rafiee
41Engineering and Manufacturing Division, Iran Sanaat Industrial Group, Shiraz, Iran 2School of Mechanical Engineering, Shiraz University, Shiraz, Iran
3Department of Engineering, Aliabad Katoul Branch, Islamic Azad University, Aliabad Katoul, Iran 4Department of Engineering, Bushehr Branch, Islamic Azad University, Bushehr, Iran
Email: *[email protected]
Received 10 November 2014; revised 5 December 2014; accepted 2 January 2015
Copyright © 2015 by authors and Scientific Research Publishing Inc.
This work is licensed under the Creative Commons Attribution International License (CC BY). http://creativecommons.org/licenses/by/4.0/
Abstract
This paper reports on the modeling and simulation of flashing-induced instabilities in natural- circulation systems, with special emphasis on simplified boiling water reactors (SBWRs). In this work, flashing-induced oscillations have been studied by using an experimental test facility (SIRIUS-N) and RELAP5/MOD3.2 thermal hydraulic code. The behavior of the test facility is inves-tigated for different values of core inlet temperature value. The results of the simulations have been compared qualitatively and quantitatively with experiments. In general, deviations are found between the numerical and experimental results, in spite of the close similarity between the SIRIUS-N facility and the definition of the system in the RELAP code. This result indicates that pre-dictions regarding experimental facility, based on modeled system, should be carefully consi-dered.
Keywords
SBWR, Flashing-Induced Instabilities, Start-Up Condition, RELAP5/MOD3.2, Experimental Test Facility
1. Introduction
In a boiling natural circulation loop like SBWR, a fairly long chimney is installed on the core to increase the
natural circulation flow rate. In such systems, thermo hydraulic stability at low pressure start-up should be esti-mated while considering the flashing induced by the pressure drop in the channel and the chimney due to hy-drostatic head [1]. Several experimental and analytical studies have addressed stability at low pressures of natu-ral-circulation two-phase flow systems. At the Delft University of Technology, the test facility CIRCUS was built to study the start-up stability of a natural circulation BWRs. The design parameters for this facility are based on the Dodewaard reactor [2]. Van Bragt et al. (2002) developed a theoretical flashing model based on the one-dimensional homogeneous equilibrium mixture (HEM) equations. They investigated the stability characte-ristics of the Dutch Dodewaard reactor at low pressure and showed that the size of the instability region in the dimensionless plane decreases as the pressure increases [3].
The Central Research Institute of Electric Power Industry (CRIEPI) in Japan has constructed a low-pressure thermo hydraulic test facility to study the start-up stability of the Simplified Boiling Water Reactor [4]. Ander-sen et al. (1995) reproduced flashing-induced instabilities with TRACG and gained some promising qualitative agreement with the different types of flow oscillations obtained experimentally at CRIEPI test facility. In these cases, it was noted that the amplitude of flow oscillations is always under-estimated, but no systematic quantita-tive comparison is reported. In addition, no unstable region is found at low power, which contradicts the expe-rimental results [5]. Furuya et al. (2005) presented some Stability maps which were obtained in reference to the inlet subcooling and the heat flux at the system pressure. They show that by increasing the inlet temperature, four main types of behavior can be observed. They suggested that such instabilities are flashing-induced density wave oscillations [4].
For numerical simulation of two phase flow instabilities, a 6-equation model can be used, where the two phases are treated as two separated fluids for which mass, momentum and energy balances are solved separately. This type of model is implemented in some of the system codes (RELAP5, ATHLET, TRAC, MONA) and al-lows thermal non-equilibrium and slip to be taken into consideration between the phases. In the present study, an attempt has been made to model SIRUIS-N experimental facility by using RELAP5/MOD3.2 thermal hydraulic code. The objective here is to investigate the existence of flashing-induced instabilities that could occur during start-up of the simplified boiling water reactors. The details of the numerical model are discussed in Section 3. In the following, the simulation results have been compared with the experiments that were carried out, within the framework of the CRIEPI project, on the SIRIUS-N facility [4].
2. The SIRIUS-N Test Facility
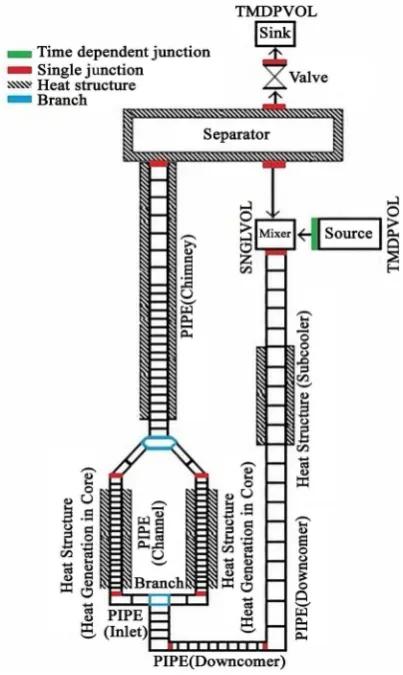
Figure 1 shows a schematic of the test facility SIRIUS-N. The thermal-hydraulic loop consists of two channels, a chimney, an upper-plenum (separator), a condenser, a downcomer, a subcooler, and a preheater. The heated channel length, lc, is 1.7 m and the chimney length, lr, is 5.7 m. A heater pin is installed concentrically in each
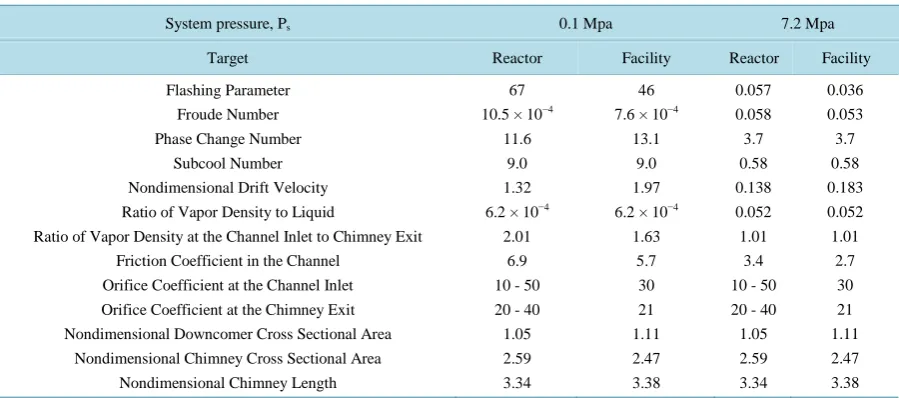
channel. Measurement regions of the differential pressure sensors (R1 - R8) and location for heaters temperature measurements (T) are shown in Figure 1. The thermocouples measuring fluid temperature are type K and 3.2 mm in diameter. Thermocouples measuring heater surface temperature were 0.5 mm in diameter, embedded and silver-brazed in the surface. A system pressure, Ps refers to the vapor pressure in the separator dome. An orifice is inserted into each channel inlet. Its local pressure loss coefficient, Ki is 19. Table 1 summarizes the compari-son of SIRIUS-N facility to the representative natural circulation BWR.
Different experiments were carried out at the SIRIUS-N test facility to study the characteristics of flashing induced flow instabilities. The experiments were performed at low pressures ranging from 0.1 to 0.5 Mpa, with different core powers and core inlet temperatures. During each experiment the core power and the temperature at the inlet of the heated section were kept constant. Within a series of experiments the core inlet temperature was stepwise increased, while the system pressure and core power were kept constant [4].
3. Thermo Hydraulic Model
Thermal hydraulic stability was investigated with RELAP5/Mod3.2. Figure 2 shows a nodding diagram, which describes a flow network of SIRIUS-N facility. Details of the RELAP5 nodalization scheme are discussed in this section.
3.1. Nodalization Scheme for RELAP5 Simulation
Figure 1. Schematic diagram of the SIRIUS thermal hydraulic test facility.
[image:3.595.213.415.369.707.2]Table 1. Comparison of the facility with natural Circulation BWR.
System pressure, Ps 0.1 Mpa 7.2 Mpa
Target Reactor Facility Reactor Facility
Flashing Parameter Froude Number Phase Change Number
Subcool Number Nondimensional Drift Velocity Ratio of Vapor Density to Liquid
Ratio of Vapor Density at the Channel Inlet to Chimney Exit
Friction Coefficient in the Channel Orifice Coefficient at the Channel Inlet Orifice Coefficient at the Chimney Exit
Nondimensional Downcomer Cross Sectional Area Nondimensional Chimney Cross Sectional Area
Nondimensional Chimney Length
67 10.5 × 10⁻⁴
11.6
9.0 1.32 6.2 × 10⁻⁴
2.01 6.9 10 - 50 20 - 40
1.05 2.59 3.34
46 7.6 × 10⁻⁴
13.1
9.0 1.97 6.2 × 10⁻⁴
1.63 5.7 30 21 1.11 2.47 3.38 0.057 0.058 3.7 0.58 0.138 0.052 1.01 3.4 10 - 50 20 - 40
1.05 2.59 3.34 0.036 0.053 3.7 0.58 0.183 0.052 1.01 2.7 30 21 1.11 2.47 3.38
separator, subcooler and downcomer. The heated channels, the chimney and downcomer were modeled as pipe
components. A simple separator model is used for modeling the upper-plenum. The lower part of the separator is modeled as a mixer using a single volume component. A trip valve is used for modeling the steam control valve. A time-dependent junction between the source and the mixer facilitates the control of feed water supply, which is equal to the mass flow rate of steam exiting from the separator to sink. The top of the separator is con-nected to a time dependent volume to maintain the system pressure constant. The degree of subcooling, ΔTsubis
defined on the basis of the system pressure, and can become a negative value at lower parts due to the static head. The heater elements in the core and subcooler are modeled as heat structures. A heat structure is attached in the middle of the downcomer to cool down or heat up the water to set the constant temperature at the channel inlet. For the heaters, stainless steel thermal properties were used in the RELAP model and the power input is through a general power table. The outflow from the two channels merges in a branch component to a path through the chimney section. The flow discharges above the water level in the separator. The heat structures at-tached to the chimney and separator calculate heat loss to the environment and separator, respectively.
3.2. Nodal Sensitivity Studies
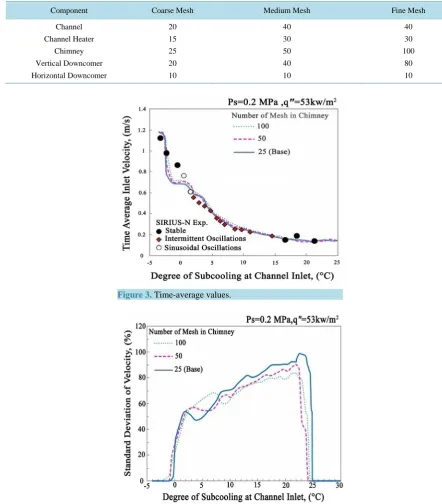
In order to determine the number of nodes a parametric study was carried out to verify the spatial nodding. The spatial mesh size must be adequately small to capture a spatial variation of the void propagation. The size should not, in turn, be too small to induce numerical instability. Table 2 summarizes the number of spatial meshes in the present nodding. In this study three different numbers of meshes in the chimney were investigated parametr-ically: 25 for coarse scheme, 50 for intermediate scheme, and 100 for fine scheme.
Figure 3 and Figure 4 show sensitivity study for the spatial mesh size. Before startup, the separator pressure is kept at a very low pressure (0.2 MPa), and the coolant in the entire loop is kept at an initial temperature of 120˚C (which is very close to the saturation temperature at 0.2 MPa). The initial flow condition is set to zero, and the power input is through a general power table. Figure 3 shows time-average values of liquid velocity at channel inlet. Experimental data are plotted as different symbols classified by the stability: “●” is stable, “○” is sinusoidal oscillations, and “◆” intermittent oscillations. The difference of oscillation mode will be described in the following section.
The time-average inlet velocities of three mesh-size cases coincide with each other. The Figure 4 shows standard deviation of inlet velocity.
Table 2. Number of mesh in sensitivity study.
Component Coarse Mesh Medium Mesh Fine Mesh
Channel Channel Heater
Chimney
Vertical Downcomer Horizontal Downcomer
20 15 25
20 10
40 30 50
40 10
40 30 100
[image:5.595.82.525.100.605.2]80 10
[image:5.595.202.426.372.601.2]Figure 3. Time-average values.
Figure 4. Standard deviations (oscillation amplitude).
4. Results and Discussion
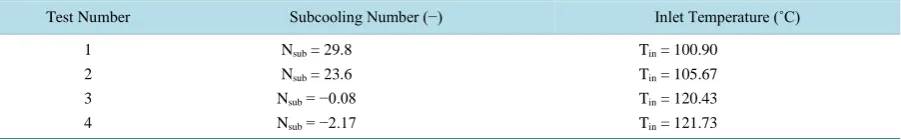
Table 3. Selected experiments from a test series at a pressure of 0.2 Mpa and a core power of 53 kw/m2.
Test Number Subcooling Number (−) Inlet Temperature (˚C)
1 2 3
4
Nsub = 29.8
Nsub = 23.6
Nsub = −0.08
Nsub = −2.17
Tin = 100.90
Tin = 105.67
Tin = 120.43
Tin = 121.73
following sections, all cases will be discussed in more detail.
4.1. Stable Condition at High Subcooling
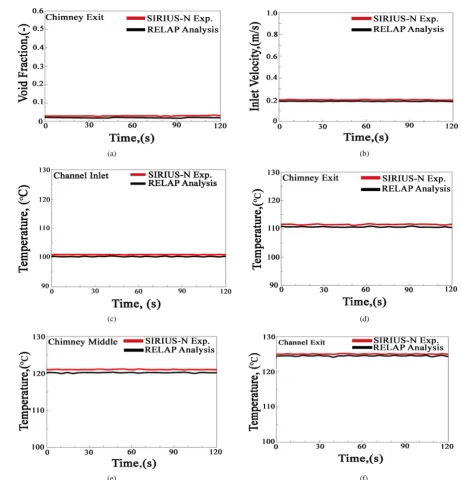
Figure 5 shows a case with high subcooling stable flow circulation which is found at Tin = 100.90˚C. In this case, single phase buoyancy plays a major role. First, cold water enters the channel and is heated in the core sec-tion. The coolant then travels through the chimney secsec-tion. After that, boiling initiates where the water tempera-ture exceeds the local saturation temperatempera-ture. Although void fractions are generated by flashing in the chimney middle and the chimney exit (corresponding to region (R7) and (R8) respectively, see Figure 1), the void frac-tions, temperature and the flow remain unchanged in time [4]. A very good level of agreement is found between the experiments and the numerical simulations in the chimney exit. However, the void fraction in the middle chimney cannot be predicted by RELAP code. The simulation results are compared with the experiments in Figure 5.
4.2. Intermittent but Periodical Oscillations
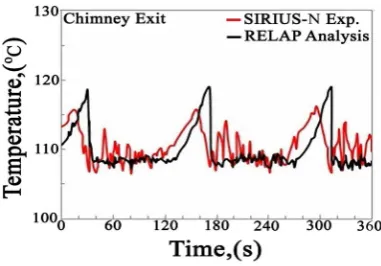
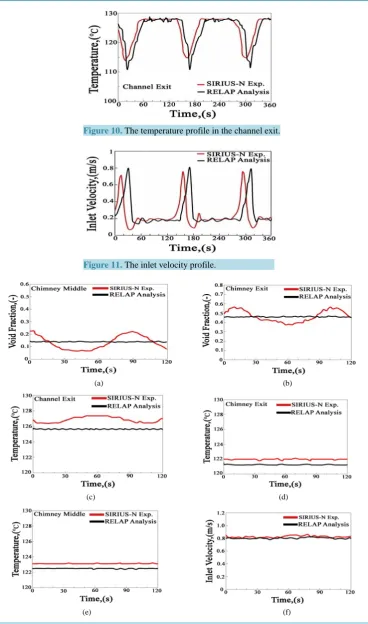
By increasing the coolant, the inlet subcooling the high subcooling stability boundary is crossed. Intermittent oscillations are found for the case with an inlet temperature of Tin = 105.67˚C. This case is characterized by pe-riodical oscillations occurring after a certain dwell time. Vapor is created where the temperature exceeds the lo-cal saturation temperature. Decrease in static head of water immediately promotes further evaporation. This event enhances the flow circulation, allowing the vapor to expand and the effect of vapor compression is thus reduced. Due to the flow increase, the coolant passes the heated section more quickly and, therefore, is heated less. This liquid bulk is not hot enough to vaporize in the chimney; thus the flashing stops. As a result, the driv-ing mechanism is again sdriv-ingle-phase buoyancy and the flow circulation decreases. The decrease in the flow causes the coolant to remain longer in the heated section and consequently the temperature at the chimney inlet starts to increase. Some vapor is thus created by boiling at regions close to the core exit, causing a small second flow increase which disappears soon after entering the chimney. The hot front originated in the heated section travels upwards and when the superheated coolant reaches the outlet chimney, the cycle starts again. Very good agreement is found between the experiments and the numerical simulations for the location of the intermittent oscillations. The comparison results are shown in Figures 6-11.
4.3. Sinusoidal Oscillations
The effect of inlet temperature is investigated at Tin = 120.43˚C. According to the experimental results obtained with CRIEPI, a further increase of the inlet temperature decreases the oscillation period and amplitude, and consequently the wave resembles a sinusoidal curve. In contrast to the intermittent oscillations behavior, in the sinusoidal oscillation case, during the flashing event vapor appears in the core section first. The coolant flow shows a regular behavior with a nonexistent incubation time. In this case, the simulation results show an average void fraction in stability boundary without significant oscillations. The simulation results are presented in Fig-ure 12.
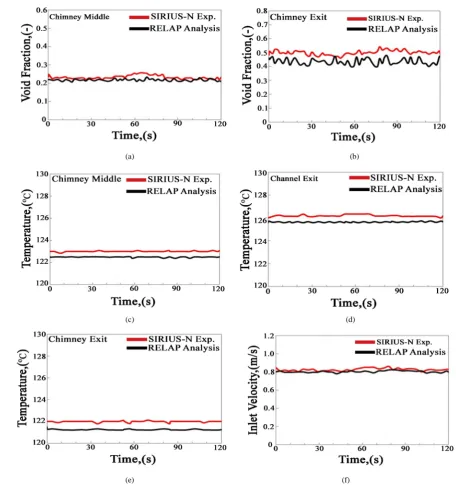
4.4. Stable Condition at Low Subcooling
(a) (b)
(c) (d)
[image:7.595.75.537.80.561.2]
(e) (f)
Figure 5. Stable high subcooling flow circulation. Very low vapor values and a constant temperature profile in the chimney.
the chimney. In this case, numerical simulations show good agreement between the model predictions and the experimental results. The void fraction and the temperature remain unchanged in time and only some minor- fluctuations are observed. The simulation results are shown in Figure 13.
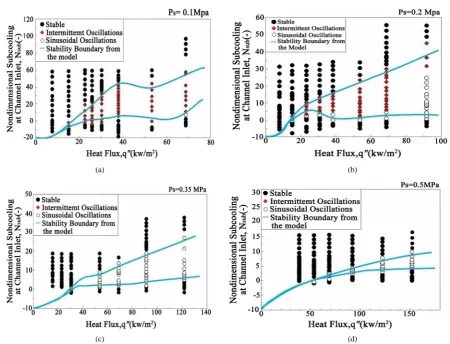
4.5. Stability Map
Figure 6. The void fraction plot in the chimney middle.
Figure 7. The void fraction plot in the chimney exit.
Figure 8.The temperature profile in the chimney middle.
[image:8.595.211.416.411.548.2] [image:8.595.217.408.573.706.2]Figure 10. The temperature profile in the channel exit.
Figure 11. The inlet velocity profile.
(a) (b)
(c) (d)
(e) (f)
[image:9.595.219.408.87.196.2]
(a) (b)
(c) (d)
[image:10.595.81.538.80.566.2]
(e) (f)
Figure 13. Stable two-phase case. This behavior is characterized by stable two-phase buoyancy driven flow.
and the intermittent oscillations in the stability boundary. Therefore, the numerical results show a more stable system than the experimental results.
5. Conclusions
(a) (b)
[image:11.595.87.538.79.423.2]
(c) (d)
Figure 14.Stability maps in reference to heat flux and inlet subcooling. (a) Ps = 0.1 Mpa; (b) Ps = 0.2 Mpa; (c) Ps = 0.35
Mpa; (d) Ps = 0.5 Mp.
study are summarized below.
1) In low and high subcooling conditions, the predictions of thermal hydraulic code show a good agreement between the numerical simulation and the experimental results.
2) For identical startup conditions in the stability boundary, it is evident that the nature of flow oscillation predicted in scaled model and the prototype is not similar in the stability boundary, in the context of the sinu-soidal oscillations and the intermittent oscillations. In the prototype model, the flow behavior in the channel is characterized by regular oscillations, whereas in the scaled model, even for identical conditions, the numerical results remain relatively stable.
3) A large amount of data has been gathered to be used for future benchmarking of RELAP5/MOD3.2 ther-mal hydraulic code. The simulation results are quite challenging as they are not in line with the experimental results. Therefore, considerations of flashing instabilities, based on merely numerical results must be taken into consideration in the stability boundary.
References
[1] Inada, F., Furuya, M. and Yasuo, A. (2000) Thermo-Hydraulic Instability of Boiling Natural Circulation Loop Induced by Flashing (Analytical Consideration). Nuclear Engineering and Design, 200, 187-199.
http://dx.doi.org/10.1016/S0029-5493(99)00334-9
[2] De Kruijf, W.J.M., Van der Hagen, T.H.J.J. and Mudde, R.F. (1999) CIRCUS, a Natural Circulation Two-Phase Flow Facility. Proceeding of the Eurotherm SeminarNo. 63.
Engineer-ing and Design, 215, 87-98. http://dx.doi.org/10.1016/S0029-5493(02)00043-2
[4] Furuya, M., Inada, F. and Van der Hagen, T.H.J.J. (2005) Flashing-Induced Density Wave Oscillations in a Natural Circulation BWR—Mechanism of Instability and Stability Map. Nuclear Engineering and Design, 235, 1557-1559.
http://dx.doi.org/10.1016/j.nucengdes.2005.01.006
[5] Andersen, J.G.M., Inada, F. and Klebanov, L.A. (1995) TRACG Analyses of Flashing Instability during Start-Up.