© 2017, IRJET | Impact Factor value: 5.181 | ISO 9001:2008 Certified Journal | Page 854
Electrocardiogram beat classification using Discrete Wavelet Transform,
higher order statistics and multivariate analysis
Thripurna Thatipelli
1, Padmavathi Kora
21
Assistant Professor, Department of ECE, GRIET, Hyderabad, Telangana, India
2Associate Professor, Department of ECE, GRIET, Hyderabad, Telangana, India
---***---Abstract
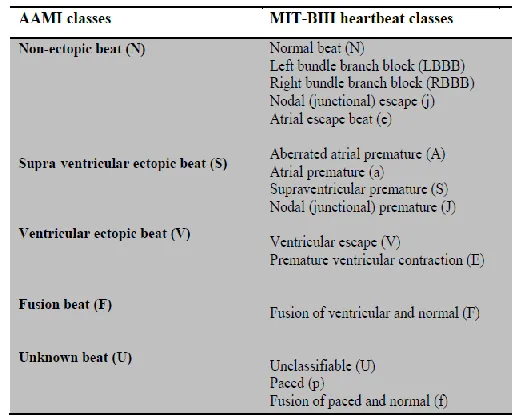
—Arrhythmia is a cardiovascular condition caused by abnormal activities of the heart, Electrocardiogram(ECG) is used to detect heart irregularities. The development of many existing systems has depended on linear features such as Discrete Wavelet Transform(DWT) on ECG data which accomplish high performance on noise-free data. However, higher order statistics and multivariate analysis illustrate the ECG signal more efficiently and achieve good performance under noisy conditions. This paper investigates the representation of DWT and Higher order statistics and multivariate analysis to improve the classification of ECG data. Five types of beat classes of arrhythmia as recommended by the Association for Advancement of Medical Instrumentation are analyzed,: non-ectopic beats (N), supraventricular ectopic beats (S), ventricular ectopic beats (V), fusion beats (F) and unclassifiable and paced beats (U). The representation capability of nonlinear features such as high order statistics(HOS) and cumulants and nonlinear feature reduction methods such as independent component analysis(ICA) are collective with linear features, namely, the principal component analysis(PCA) of discrete wavelet transform coefficients. The obtained features are applied to the classifier, namely, the support vector machine(SVM) . The proposed method is able to perform ECG beat classification using DWT,PCA,HOS and ICA with high accuracy 98.91% percent.Keywords—ECG, DWT,HOS,ICA,PCA.
1. Introduction
An electrocardiogram (ECG) is the non-invasive method used to identify arrhythmias or heart abnormalities. Cardiovascular disease (CVD) has turned out to the main
origins of death in the World. The American Heart
Association expressed that, in 2006, more than 70 million individuals around the globe were determined to have CVD. The basic reasons for CVD are hypertension,
lacking physical exercise, ineffectively adjusted eating regimen, smoking and unusual glucose levels.
Due to the existence of noise and the abnormality of the heartbeat, physicians face complications in the analysis of Arrhythmias[2]. Moreover, visual inspection alone may lead to misdiagnosis or irrelevant detection of arrhythmias. Therefore, the computer aided analysis of ECG data supports physicians to proficiently detect arrhythmia.
There are three main processes in an ECG arrhythmia detection system, namely, feature extraction, feature selection, and classifier construction. The ECG beat classification [1]as per ANSI/AAMI EC57:1998 standard database shown in Table -1.Feature extraction transforms the input data into a set of features and plays an important role in detecting most heart diseases.
[image:1.612.321.577.484.692.2]The proposed method uses Principal Component Analysis with Wavelet Transform coefficients and Higher order statistics with Independent Component Analysis to achieve high accuracy .
© 2017, IRJET | Impact Factor value: 5.181 | ISO 9001:2008 Certified Journal | Page 855
2. Pre Processing
The proposed system adopts different methods for Preprocessing, Feature extraction. The excellence of the ECG Beat classification depends on the accuracy of the detection of each cardiac cycle. Proposed method MIT –
BIH arrhythmia database[5]. In this paper , the pre
processing module is decomposed into three components.
i. De noise ii. QRS Detection iii. Segmentation
The block diagram of proposed System is shown in fig 1.
Pre processing
ECG De noise(DWT)
Signal QRS detection Segmentation
Feature Extraction
SVM DWT+PCA
HOS+ICA
Fig- 1: Block diagram of proposed method
2.1
De-noising
DWT is capable in analyzing non-stationary signals. Wavelet transform method for de noising of ECG signal, Selection of appropriate wavelet and number of decomposition level is very significant in investigation of signals.
The Daubechies D6 (db6) wavelet basis function is
used to de noise the data, with the ECG signals
decomposed to nine levels[3]. The inverse wavelet transform is obtained from the third to the ninth level detail sub-bands to achieve the de noised and smoothed ECGsignal.
2.2
QRS complex detection & Segmentation
QRS complex detected on denoised ECG signal by Pan-Tompkins algorithm. It describes the slope, amplitude and width. The algorithm classified to three steps. First step, the low pass and high pass filters shapes a band pass filter,
which decreases noise in the ECG signal like muscle
noise[4]. In the second step, to recognize QRS complexes from low-frequency ECG components for example the P and T waves, the signal is gone through a differentiator to highlight the high slopes.
The third step is the squaring operation, which places stress on the higher values that are essentially present because of QRS complexes.Smooth ECG signal is obtained by passing squared signal through moving window integrator. After identification of the QRS complex, 99 samples were selected from the left side of the QRS mid-point and 100 samples behind QRS mid-point and the QRS midpoint itself as a segment or beat of 200 samples.
3. Feature Extraction
Wavelet Transform is appropriate to analyze non stationary signals. The feature vectors from the ECG data set created by extracting the Wavelet transform , linear dimensionality reduction technique PCA and Higher order statistics cumulant features with Independent component analysis(ICA)[8].
DWT was applied after ECG signal denoising, QRS complex detection and segmentation, and DWT is used to extract hidden information. The PCA was applied on both the sub-band coefficients of the third level detail and fourth level
detail[6].In total, 12 features (six each from the two
© 2017, IRJET | Impact Factor value: 5.181 | ISO 9001:2008 Certified Journal | Page 856
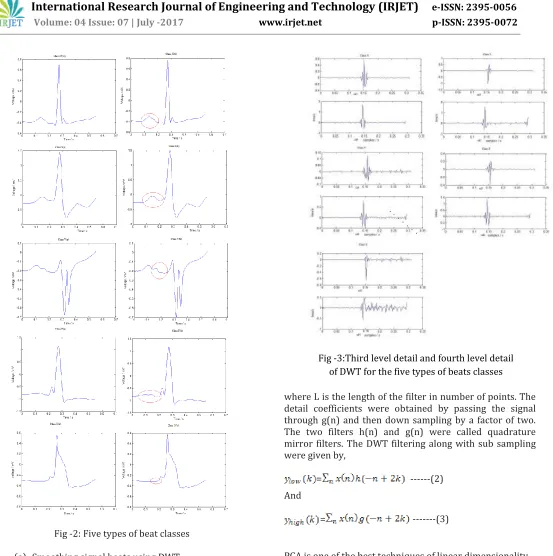
Fig -2: Five types of beat classes
(a) Smoothing signal beats using DWT
(b) Signal beats without using DWT
The ECG signal x(n) is passed through a low pass filter h(n), and then down sampled by a factor of two to attain the approximation coefficients at level one. The high pass filter is resulting from the low pass filter as,
[image:3.612.50.275.92.566.2]g (L-1-n)= h(n)---(1)
Fig -3:Third level detail and fourth level detail of DWT for the five types of beats classes
where L is the length of the filter in number of points. The detail coefficients were obtained by passing the signal through g(n) and then down sampling by a factor of two. The two filters h(n) and g(n) were called quadrature mirror filters. The DWT filtering along with sub sampling were given by,
= ---(2)
And
= ---(3)
PCA is one of the best techniques of linear dimensionality reduction technique for extracting effective features from high dimensions. PCA consists of following 3 phases. Phase 1: Compute covariance matrix from the data as,
C= ( x- ) ---(4)
where is the data matrix, and represents mean vector of x . Phase 2: Compute the array of eigenvectors V and diagonal matrix of eigen values D as
© 2017, IRJET | Impact Factor value: 5.181 | ISO 9001:2008 Certified Journal | Page 857
Phase 3: Sort the eigenvectors in V in descending order of eigen values in D and project the data on these eigenvector directions by taking the inner product between the data matrix and the sorted eigenvector matrix as,
p= ---(6)
PCA was computed on both sub-band coefficients of the third level detail and fourth level detail. In total, 12 features (six each from the two sub-bands) were used for subsequent pattern identification using SVM. Higher order statistics removes Guassian noise[7].ICA involves a multi-variant analysis to reduce a multi-source signal into
additive subcomponents[13].
The feature vector from ECG data is obtained by combining linear and nonlinear features. The combined feature vector is obtained by appending the twelve PCA of DWT features, 16 ICA features and HOS cumulant features[12].
4. Classification
4.1
Support Vector Machines
The SVM classifier for a solitary layer can manage classification problems because of its ability for generalization. It changes over the input vector patterns to higher measurement highlight space through some nonlinear mapping and acquires an ideal isolating hyper-plane which is worked to isolate two classes of tests[9]. In specific, the SVM classifier demonstrates an ideal speculation ability when utilizing the maximal margin principle.
A target work is defined in view of the separations of the class isolating hyper-plane and the enhancement procedure is done .Diverse kernel transformations are utilized to delineate information into high dimensional functions, for example, the quadratic, polynomial and radial basis function (RBF). The performance of the SVM can be influenced by the hyper-parameter (C parameter and the kernel parameter), as these parameters decide the quantity of support vectors and the maximization margin of the SVM.
5. Results
The ECG beat classification using DWT,PCA and Higher order statistics and ICA with the MIT-BIH arrhythmia database. Feature vectors formed with combination of linear and nonlinear methods consisted of 28 features. The feature vectors inputted to the SVM based on Gaussian
kernel . The corresponding overall accuracy of the proposed model were 98.91% respectively.
TABLE-2: Overall accuracy for all ECG beat classes
Featu
res Overall Accuracy (%)
N S V F U
PCA-DWT 88.04% 91.01% 94.19% 92.05% 97.59% 94.5%
ICA-HOS 97.83% 98.85% 99.02% 97.83% 98.90% 96.6%
PCA-DWT + HOS-ICA
98.91% 98.91
% 100% 98.91% 100% 100%
For Calculating accuracy two parameters sensitivity and specificity are calculated using the equations 7 and 8
Specificity =
---(7)
Sensitivity =
---(8)
Accuracy =
---(9)
TABLE - 3: Classification Results
Classifier Sensitivity(%) Specificity(%) Accuracy(%)
SVM 98.91% 97.85% 98.91%
NN 98.51% 98.62% 98.7%
6. Conclusion
© 2017, IRJET | Impact Factor value: 5.181 | ISO 9001:2008 Certified Journal | Page 858
REFERENCES
[1] N. Maglaveras, T. Stamkapoulos, K. Diamantaras, C. Pappas, M.Strintzis, “ECG pattern recognition and classification using nonlinear transformations and neural networks: A review”, Int. J.Med. Inform, vol 52, pp. 191– 208, 1998.
[2] . Padmavathi Kora, K. Sri Rama Krishna; ECG Based Heart Arrhythmia Detection Using Wavelet Coherence and Bat Algorithm" Sensing and Imaging, Springer, Vol 17, no. 1, Jun2016.
[3] S. Osowski, T.H. Linh, “ECG beat recognition using fuzzy hybrid neural network”, IEEE Trans. Biomed. Eng, vol. 48, pp. 1265–1271, 2001.
[4] Padmavathi Kora, and Sri Ramakrishna Kalva, ”Improved Bat algorithm for the detection of myocardial infarction,”SpringerPlus, Springer, vol 4, no. 1, pp. 1-18, Nov 2015.
[5] P. de Chazal, B. G. Celler, R. B. Rei, “Using Wavelet
Coefficients for the Classification of the
Electrocardiogram”, Proceedings of the 22nd Annual EMBS International Conference, July 23-28,2000, Chicago IL. [6] S.Banerjee, M.Mitra “Application of Cross Wavelet Transform for ECG Pattern Analysis and Classification”, IEEE transaction on
Instrumentation and Measurement, Vol.63 ,No.2, pp.326-333,Feb 2014
[7]Padmavathi Kora, K. Sri Rama Krishna, ”Hybrid Firefly
and Particle Swarm Optimization algorithm for the detection of Bundle Branch Block,” International Journal of
Cardiovascular Academy, Elsevier, Dec 2015. [8] “The MIT-BIH Arrhythmia Database,”
http://physionet.ph.biu.ac.il/physiobank/database/mitdb /
[9] Padmavathi Kora, K. Sri Rama Krishna, ”Adaptive Bacterial Forging Optimization for the detection of Bundle Branch Block,” Egyptian Informatics Journal, Elsevier, Vol 17, June 2016.
[10] R.J. Martis, U.R. Acharya, K.M. Mandana, A.K. Ray, C. Chakraborty, Application of principal component analysis to ECG signals for automated diagnosis of cardiac health, Expert Systems with Applications 39 (14) (2012) 11792– 11800.
[11] Padmavathi Kora, and Sri Rama Krishna, “Hybrid
Bacterial Foraging and Particle Swarm Optimization for detecting Bundle Branch Block,” SpringerPlus, Springer, vol 4, no 1, 481,Sep 2015.
[12] R.J. Martis, C. Chakraborty, A.K. Ray, An integrated ECG feature extraction scheme using PCA and wavelet transform, in: IEEE INDICON-2009, 2009, ISBN: 978-1-4244-4859-3/09.