ENERGY EFFICIENT DISTRIBUTED IMAGE
COMPRESSION USING JPEG2000 IN WIRELESS SENSOR
NETWORKS (WSNS)
1
A.KARTHIKEYAN, 2T.SHANKAR, 3V.SRIVIDHYA, 4SURYALOK.SARKAR,4AKANKSHA GUPTE
1Assistant Professor (Sr)., Networking division, SENSE, VIT University, Vellore.
2
Assistant Professor (Sr).,Communication division, SENSE, VIT University, Vellore 3Assistant Professor, Kingston Engineering College Anna University Chennai.
4 M.Tech Communication Engg. II year SENSE, VIT University, Vellore
Email: [email protected], [email protected], [email protected]
ABSTRACT
Restricted computational power, memory limitations, narrow bandwidth and energy supplied present strong limits in sensor nodes are the important points should be considered during the real time transmission of data using wireless sensor networks. Therefore, maximizing network lifetime and minimizing energy consumption are always optimization goals. To reduce the energy consumption of the sensor network during image transmission, an energy efficient image compression scheme is proposed. The image compression scheme reduces the required memory. To address the above mentioned concerns, in this paper, an approach of image transmission in WSNs, taking advantage of JPEG2000 still image compression standard and using MATLAB and C from Jasper. The features provided by JPEG2000 were achieved using techniques such as Discrete Wavelet Transform (DWT) and Embedded Block Coding with Optimized Truncation (EBCOT).Image quality and energy consumption are the two performance parameters should be considered during the image compression and transmission. Simulation results are presented and show that the proposed scheme optimizes network lifetime and reduces significantly the amount of required memory by analyzing the functional influence of each parameter of this distributed image compression algorithm.
Keywords: WSNs; Image compression; Energy conservation; System lifetime; JPEG2000; MATLAB; DCT;JPEG;PSNR
1. INTRODUCTION
Advances in image sensors and wireless communication have enabled the development of low-cost and low power visual multihop wireless networks. A WSN consists of spatially distributed autonomous sensors to monitor physical or environmental conditions, such as temperature, sound, vibration, pressure, humidity, motion or pollutants and to cooperatively pass their data through the network to a main location. The more modern networks are bi-directional, also enabling control of sensor activity. Environmental and habitat monitoring, target tracking and surveillance are important applications of sensor networks. A sensor node might vary in size from that of a shoebox down to the size of a grain of dust. The cost of sensor nodes is ranging from a few to hundreds of dollars, depending on the complexity of the individual sensor nodes. Size and cost constraints on sensor nodes result in corresponding constraints on resources such as energy, memory, computational speed and communications bandwidth.The WSNs are based on small sensor nodes and a sink (fig.1). The main characteristic of
such networks is nodes with scarce resources. These nodes consist of sensing, data processing, and communication components. So, sensor nodes are embedded system witch sense their environment, collect sensed data and transmit it to the sink in an autonomous way using multi-hop communication [1].
Fig.1. Sensor Network Architecture
1.1.Problem Definition
These sensor nodes are battery powered. In these networks, an energy-efficient multi-hop communication routing (MCR) protocol is used to address the problems of lifetime, stability and energy efficiency in the WSNs. MCR protocol is based on dividing the network into dynamic clusters. The cluster-heads election is based on weighted probability. The cluster's nodes communicate with an elected cluster head node by using single hop communication approach, and then the cluster heads communicate the information to the base station via multi-hop communication approach. WSNs present strong limits for the multimedia transfer because of Narrow bandwidth, reduced memory and limited computational capability [4]. They are energized by small and irreplaceable batteries. Under such energy constraint condition, sensor nodes can only transmit a finite number of bits in their lifetime. Consequently, energy consumption and data transmission are always considered together in WSNs. Therefore, this paper focuses on the problem of efficiently compressing and transmitting images in a resource-constrained multi-hop wireless. For image based applications, such as still pictures, stream video, voice, animal sounds and monitoring data, one uses a wireless sensor network whereby the nodes are camera-equipped [1].
1.2.Problem Solution
In this paper, image transmission optimization through WSNs is achieved mainly by the implementation of distributed image compression algorithm embedded in order to reduce the number of transmitted bits, thus reducing the energy consumption. The use of distributed image compression in resource-constrained networks is essential.so the distributed image compression is the solution for the above mentioned problem. In distributed image compression, where nodes compress an image while forwarding it to the destination subject to a specific image quality requirement and optimize network lifetime.
Even if the necessary total energy for the whole system is increased, the energy needed for every node is reduced, which prolongs the network lifetime. This technique is based on the fact that an individual node does not have sufficient computational power to completely compress a large volume of data to meet the application requirements; this is not possible unless the node distributes the computational task among other nodes. In this case, a distributed method to share the processing task is necessary [1].In this paper,
me propose an alternative image transmission approach in WSNs, based on JPEG2000 image compression standard. JPEG2000 provides high resolutions image compression, progressive transmission and scalable image coding features. This approach is based on discrete wavelet transform (DWT) and Embedded Block Coding with Optimized Truncation (EBCOT) which uses a better order of transmission.
Tool used: Matlab in Image Processing
This paper is organized as follows: Section II describes general architecture of a wireless sensor node. Image transmission to WSNs is proposed in section III. Experimental results are shown in Section IV. Finally, section V concludes this work.
2. ARCHITECTURE OF A WIRELESS SENSOR NODE
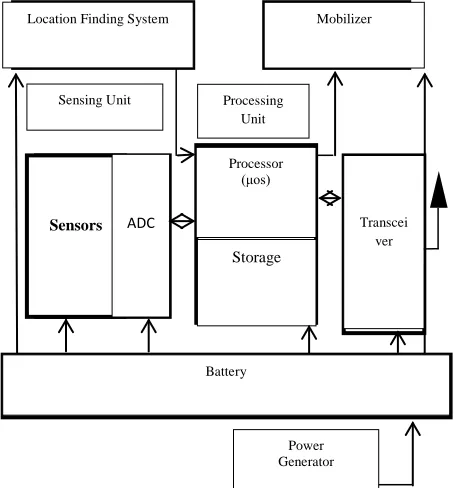
Fig. 2 shows the architecture of a typical wireless Sensor node. It consists of four main components (i) a sensing unit including one or more sensors and an A/D converter for data acquisition (ii) a processing unit including a micro-controller and memory for local data processing (iii) a radio subsystem for wireless data communication (RF unit) and (iv) a power supply unit. Depending on the specific application, sensor nodes may also include additional components which are optional such as a location finding system to determine their
[image:2.612.314.541.472.716.2]Position, a mobilizer to change their location or Configuration.
Fig.2. Architecture Of A Wireless Sensor Node.
Sensors ADC
Processor (μos)
Storage
Transcei ver Location Finding System Mobilizer
Battery
Power Generator Sensing Unit Processing
For wireless multimedia network, sensor nodes are equipped with multimedia devices such as cameras. These devices are smaller, and offer more performances in terms of speed and image quality. Thus such network will have the capability to transmit multimedia data [1]. Image sensing, allocated memory and image processing are the most important requirements of image transmission in WSNs.
3. IMAGE TRANSMISSION IN WSNs
For military application, surveillance, localization, and tracking, the sensor nodes have to sense the environment continuously and report what happens.
Data collected by sensor nodes are usually routed back to a sink node by a multiple-hop communication. Each sensor node has two roles, data gathering and data relaying. In this use a scenario to request image QoSs parameters:
Fig.3. Scenario Used For The Image Request
In this request, QoSs parameters such as Q (bit rate of compressed image) and L (wavelet decomposition level), PSNR, compression ratio, rate etc. are to be specified. The monitor specifies the desired parameters in the image request. In this paper, I took some assumptions such that communication environment is contention-free and error-free, some of the nodes are camera equipped and cluster based routing mechanism.
3.1. Image Processing In WSNS
The radio subsystem is the most power consuming part in sensor node. Reduce transmitted data means save energy. For this, the most evident solution is the image compression. The purpose of image compression is to reduce the number of bits
needed to represent an image by removing the spatial, temporal and spectral redundancies as much as possible. In this paper, the proposed image compression scheme is based on wavelet image transform. The block diagram of JPEG2000 codec shown in below figure.
Fig.4. Functional Block Diagram Of JPEG 2000 Codec
Progressive transmission, progressive quality, reduced allocated memory, minimized energy consumption, and optimized network lifetime are main objectives achieved by this image compressing system.
3.2.Image Compression
3.2.1. Wavelet transform basedsub band coding
It is one of the important imaging techniques with ties to multiresolution analysis. In this, an image is decomposed into a set of bandlimited components called subbands. The decomposition is performed so that the subbands can be reassembled to reconstruct the original image without error because the decomposition and reconstruction are performed by means of digital filters.
It is also referred to as lifting scheme (LS) is more robust under transmission and decoding errors, and also facilitates progressive transmission of images. Wavelet coding schemes are especially suitable for applications where scalability and tolerable degradation are important [1]. DWT is a 2-D separable filtering operation across rows and columns of input image.
The fundamental concept behind wavelet transform is to split up the frequency band of an image and then to code each subband using a coder and bit rate accurately matched to the statistics of the band [2]. Uniform decomposition, octave-band decomposition, and adaptive or wavelet-packet decomposition are the several methods used to decompose an image. Out of
Forward Wavelet
Transform Quantization Entropy Coding
Entropy Decoding De-
Quantization Inverse
Wavelet Transform
Transmitting Sourc
e image
these, octave-band decomposition is most common method used in this paper. This is a non-uniform band splitting method that decomposes the lower frequency part into narrower bands and the high-pass output at each level is left without any further decomposition.
It is described as follows. A Low Pass Filter (LPF) and a High Pass Filter (HPF) are chosen, such that they exactly halve the frequency range of the input signal. First, the LPF is applied for each row of data, thereby getting the low frequency components of the row [2]. The output data contains frequencies only in the first half of the original frequency range because the LPF is a half-band filter. Next the HPF is applied for the same row of data, and similarly the high pass components are separated. The low and high pass components are arranged into a row of output data as illustrated in below figure. This row operation is known as 1D wavelet transforms. Next, the filtering is done for each column of the intermediate output data. This whole procedure including both row and column operations is called a 2D wavelet transform. The resulting 2D array of coefficients contains four bands of data such as LL (low–low), HL (high–low), LH (low– high) and HH (high–high). The LL band can be further decomposed in the same manner, thereby producing even more sub-bands. This can be repeated up to any level, thereby resulting in a pyramidal decomposition.
Fig.5. Illustration Of Wavelet Spectral Decomposition
Fig.6. JPEG2000 Compression Algorithm
3.2.2 Embedded block coding
After the DWT, all the sub-bands are quantized to reduce the precision of the sub-bands and contribute in achieving compression. The quantized DWT coefficients are converted into sign-magnitude represented before entropy encoding. In the Embedded Block Coding method which is used in this each sub-band is divided into small blocks called ‘code blocks’. And then each code block is coded independently from the other ones thus producing an elementary embedded bit-stream. During the coding phase, each code block is decomposed into a number of bit-planes: One sign bit-plane and several magnitude bit-planes. The entropy coder uses EBCOT. EBCOT is a two-tiered coder, where the first tier is a block coder and the second tier is for rate distortion optimization and bit stream formation. Tier I of EBCOT is a context-based adaptive arithmetic encoder. Code blocks are
Fig.7. Block Diagram Of Embedded Block Coding
The AE then encodes each bit according to the adaptively estimated probabilities from its contexts. The outputs of the arithmetic encoder are the sub bitstreams of each compressed code-block data. Also, the rate and distortion information are calculated for each pass for subsequent tier 2 processing, every sub band is partitioned into small blocks called code-blocks. Every code-block is coded independently from the other ones thus producing an elementary embedded bit-stream. Rate-Allocation has the aim of choosing the contributions of each code-block at any resolution level in order to obtain the aimed bitrate by minimizing the distortion. Each bit in a bit plane is encoded in one of the three passes.
I) Significance Propagation Pass 2) Magnitude Refinement Pass 3) Cleanup Pass
Pass I is called as "significant propagation pass." During this, those samples that are currently insignificant, but have at least one immediate significant neighbour are coded first. Clearly, these samples are most likely to become significant. Pass 2 is called a "magnitude-refinement pass." Samples that have become significant in previous bit planes are coded in this pass. The pass 3, is a "clean-up pass." Samples not coded in the first two passes are coded in this pass [3].
3.3.Distributed Task Of Image Compression
The basic idea of this is the distributing the workload of task to several groups of nodes along
the path from the source to the sink. The main problem in the design of this is the data exchange. In this, data is broadcasted to all processors to speed up the execution time which may optimize network lifetime and increase the energy consumption. An example of this using four nodes in each cluster is shown in the below figure.
Fig.8. Example For Data Exchange Of Distributed Task For Image Compression In A Multi-Hop Wireless Network. Here Wavelet Decomposition upto Three
Levels Are Used.
After receiving a query from a source node s, the cluster head c1 selects a set of nodes n1i (i = 1…4) in the cluster which will take part in the distributed tasks then informs source node, the first stage concerns the data partitioning scheme is parallel wavelet transform. The source divides the original image into tile and transmits them to n1i (n11, n12, n13 and n14). Those nodes run 1D-DWT (horizontal decomposition) on their received data then send the intermediate results to c2. After receiving the results, c2 distributes it to the set of nodes n2i (n21, n22, n23 and n24). These nodes process data (vertical decomposition) and send the Level 1 data to the next cluster head c3. The cluster head c3 chooses a part of the LL1 and distributes it to the set of nodes n3i .Those nodes run 1D wavetransform algorithm of LL1 subband then send the intermediate results to c3. After running the second 1D wavelet transform of LL1 sub-band, c3 process
data and send Level 2 data to the next cluster head c4. The cluster head c4 chooses a part of the LL2 and distributes it to the set of nodes n4i. Those nodes run 1D wavelet transform algorithm on their Energy Efficient
Wavelet transform
Quantization
EBCOT
Optimization
Bitstream formation
received data LL2 subband then send the intermediate results back to c4 witch run 1D wavelet transform twice on LL2 sub-band and code the results Level 3 data. This procedure may continue upto c7 and its following nodes until the final compressed image reaches the sink node. After the DWT, all the sub-bands are quantized by a single node (n5i).The other nods are put awake. The quantization represents about 55% of the total process time. Given that the Tier-1 coding represents about 43% of the total process time, the tasks partitioning optimize the network lifetime. After receiving the results, c6 divides quantized sub-bands into a number of smaller code-blocks of equal size and send their processed results to set of nodes n6i (n61, n62, n63 and n64). In these nodes each code-block is entropy encoded independently to produce compressed bitstreams [1].
3.4.System Model
For this, here the 9/7 wavelet transforms implemented through lifting scheme (LS). For each
Sample pixel, low-pass decomposition requires 8 shifts (S) and 8 adds (A) instructions whereas high-pass decomposition requires 2 shift and 4 add. There are two input lines in the architecture, one with all the even samples (x2i) and the other with all the odd samples (x2i+1). In this case, each pixel is read and written twice. Assuming that the input image size is of M×N pixels and that the image is decomposed into p resolution level, then 2D-DWT is iteratively applied p-1 levels. Because of this the image size decreases by a factor of 4 in each transform level, the total computational energy for this process is given below [1].
EDWT(M,N,p) =
M.N.(10.S+12.A+2.Rmem+2.Wmem).
� 1/4^(𝑖 − 1)
𝑝−1
𝑖=1
Where S, A,Rmem, and Wmem represent the energy Consumption for shift, add, read, and write basic 1-byte instructions, respectively [5].
The energy spent in entropy coding per bit is EENT= δ
PSNR (peak signal-to-noise ratio) is one of the parameters that can be used to quantify image quality. PSNR parameter is often used as a benchmark level of similarity between reconstructed image and the original image. Larger PSNR will produce better image quality. It is defined in dB as follows
PSNR = 10* log10 (((2^q-1) ^2)/MSE)
Where q is the number of bits per pixel (bpp) of the raw image, and MSE is the mean-square-error is given below
MSE =
1/M.N∑𝑀−1𝑚=01∑𝑁−1𝑛=0[I(m, n) – î(𝑚, 𝑛) (m, n)]P
2
Where I (m, n) is the pixel values of the original image and î(𝑚, 𝑛) is the pixel values of the reconstructed image.
4. RESULTS
I analyzed the functional influence of the parameters mentioned in the scenario proposed on QoSs requirements on WSNs.
4.1. Process Time Of Sensor Node
In this case, me interested by analyzing the impact of the decomposition levels on the enhancement of the process (execution) time. The execution time upto five decomposition levels using the LS 9/7 is shown in the below figure.
Fig.9. Process Time For 5 Decomposition Levels Of LS 9/7.
I took Lena image with different dimensions as the test image. The process time vary over decomposition levels and then reduced and become almost constant from the third decomposition level. Thus, the most of the image energy is located in LL sub-band. Therefore, an additional decomposition is useless and will waste energy without extracting more details.
4.2.Total Energy Consumption
The energy concentration in the image by successive decomposition levels will allow decreasing the amount of information to be
0 0.5 1 1.5 2 2.5 3 3.5 4 4.5 5
0 5 10 15 20 25 30 35
Decomposition levels
P
ro
c
e
s
s
t
im
e
(
m
s
)
Process time for 5 decomposition levels of LS 9/7
transferred to the destination. The computed quantity is divided by 4 at each decomposition level. This is a main objective to be achieved, since the energy consumption in sensor nodes is proportional to the information quantity being transmitted. As a result, reducing the quantity of transmitted data will extend the topological lifetime of WSNs. From this, a Lena image of 256*256 pixels is used as a test image. We first apply the decomposition in the horizontal direction. Since all even-positioned image pixels are decomposed into the low-pass coefficients and odd positioned image pixels are decomposed into the high-pass coefficients, the total computational energy involved in horizontal decomposition is given below
EH(M,N,p) =
.5.M.N.(10.S+12.A+2.Rmem+2.Wmem).
Fig.10. (A) Original Image (B) Output Image After The First Decomposition Level (C) Output Image
After The Second Decomposition Level (D) Output Image After The Third Decomposition Level (E) Output
Image After The Fourth Decomposition Level (F) Output Image After The Fifth Decomposition Level (G)
Original Image (H) Reconstructed Image
The average energy dissipated by every node is provided in below figure. The energy consumed by the nodes n1i and n2i(i=1….4) to run 1D-DWT is of about 301mJ (by component) and 75mJ to run 1D wavelet transform algorithm of LL1 sub-band (n3i) corresponding to a 75% drop off. While the energy dissipated by every node n4i is of about 18mJ.
Fig.11. Energy CONSUMPTION BY EVERY NODE Distribution OF HIGH-PASS COEFFICIENTS
Below figure shows the distribution of high-pass coefficients after applying two levels wavelet transform to the 256*256 image. I notice that the high-pass coefficients values are very small. Indeed, 75% of the highpass coefficients for level 1 are less than 20. Since the images have a low pass spectrum, the sub-bands transmission from cluster head c4 to the sink must be transmitted with priority in order to save more energy.
Fig.12.Distribution Of High-Pass Coefficients
1 1.5 2 2.5 3 3.5 4
0 50 100 150 200 250 300 350
Nodes (n1i-n4i; i=1...4)
E
ner
gy
(
m
J
)
Computational energy dissipated by every node
0 10 20 30 40 50 60 70 80 90 100
0 10 20 30 40 50 60 70 80
coefficients values
c
oef
fi
c
ient
s
r
at
io (
%
)
Distribution of high-pass coefficients
4.3.PSNR
It is one of the parameters that can be used to quantify image quality. PSNR parameter is often used as a benchmark level of similarity between reconstructed image and the original image. Larger PSNR will produce better image quality. For measuring the image quality in terms of PSNR, I did comparison between JPEG and JPEG 2000 compression methods.In JPEG, first the image is divided into blocks, then applies the transform, then quantization using quantization table, zigzag conversion and at last apply run length coding (RLE).
Parameters JPEG JPEG2000
Transform DCT DWT
Entropy Coding Huffman Arithmetic Coding Pre-Entropy
Coding
RLE EBCOT
[image:8.612.323.519.74.245.2]
Fig.12. Shows PSNR Vs Bitrate Of Lena Image Using JPEG2000
Fig.13. (A) Shows The Original Image (B) Decompressed Image Based On Based On DCT Using
JPEG Compression Method
Bitrate(bpp) PSNR(JPEG) PSNR(JPEG2000)
.125 26.888 36.56
.5 30.9 39.6
2 35.5 43.57
Table Shows Comparison Of PSNR Between JPEG And JPEG2000
Bitrate(bpp)= total size of the compress ima. in bits
Total no. of pixels in input image
5. CONCLUSION AND FUTURE WORK
In this paper, the application of distributed image compression algorithm in WSNs. It offers much flexibility at different decomposition levels. These flexibilities are considered as dynamic parameters during the system to adapt the communication process. I gave more stress for studying on the design and evaluation of distributed scheme depending on the operating parameters such as psnr, process time etc. at different decomposition levels. From the results, we can understand that the proposed scheme reduces required memory, minimize energy consumption and optimize network lifetime. The base idea of this approach is the communication cost of the nodes closer to the destination (more compressed) is smaller than the communication cost of its previous nodes on the path. From this paper, we can understand that JPEG2000 offers more advantages than JPEG such as excellent low bit-rate performance, both lossy and lossless encoding in one algorithm, random code stream access, precise single-pass rate
0 0.2 0.4 0.6 0.8 1 1.2 1.4 1.6
32 34 36 38 40 42 44
Bitrate(bpp)
PSN
R
(d
B)
PSNR vs Bitrate(bpp)
Original image
50 100 150 200 250
50
100
150
200
250
Decompressed JPEG image
50 100 150 200 250
50
100
150
200
[image:8.612.82.293.264.578.2]control, region- of-interest coding and improved error resiliency.
In the future, further research must be focused on multipath routing which may enhance the Performance of distributed image compression and also the impact of wireless link errors.
REFERENCES
[1] Mohsen Nasri, Abdelhamid Helali, Halim Sghaier & Hassen Maaref “Adaptive image transfer for wireless sensor networks (WSNs)” [2] Huaming Wu, Alhussein A. Abouzeid,
“Energy efficient distributed image compression in resource-constrained multihop wireless networks”, Computer Communication (Elsevier) 28 (14) (2005) 1658–1668.
[3] D.Vijendra Babu, Dr.N.R.Alamelu, P.Subramanian, N.Ravikannan, “EBCOT using Energy Efficient Wavelet Transform”, International Conference on Computing, Communication and Networking (lCCCN 2008), 978- 14244-3595- IEEE.
[4] W. Zhang, Z. Deng, G. Wang, L. Wittenburg, Z. Xing,“ Distributed problem solving in sensor networks”, Proceedings of the First International Joint Conference on Autonomous Agents and Multiagent Systems, ACM Press, 2002, pp. 988–989.
[5] Vincent Lecuire, CristianDuran-Faundez, and Nicolas Krommenacker, “Energy-Efficient Transmission of Wavelet-Based Images in Wireless Sensor Networks”, Eurasip journal on Image and Video Processing, 11 pages,2007.
[6] Qin Lu, Wusheng Luo, Jidong Wang, Bo Chen, “Low complexity and energy efficient image compression scheme for wireless sensor
networks”, 1389-1286- 20 Computer
Networks (Elsevier) 52 (2008) 2594–2603. [7] R. Wagner, R. Nowak, and R. Baraniuk,
“Distributed image compression for sensor networks using correspondence analysis and super-resolution”, Proceedings of IEEE International Conference on Image Processing (ICIP), volume 1, pages 597– 600, September 2003.
[8] N. Boulgouris and M. Strintzis, “A family of waveletbased stereo image coders”, IEEE Transactions on Circuits and Systems for Video Technology, 12(10):898–203, October 2002.
[9] Huaming Wu and Alhussein A. Abouzeid, “Energy efficient distributed JPEG2000 image compression in multihop wireless networks”, 4th Workshop on Applications and Services in Wireless Networks (ASWN2004), pages 152– 160, August 2004.
[10] Min Wu and Chang Wen Chen, “Multiple bitstream image transmission over wireless sensor networks”, Proceedings of IEEE Sensors, volume 2, page 727–731, October 2003.
[11] L. Ferrigno, S. Marano, V. Paciello, and A. Pietrosanto, “Balancing computational and transmission power consumption in wireless image sensor networks”, IEEE29 International Conference on Virtual Environments, Human-Computer Interfaces, and Measures Systems (VECIMS 2005), Giardini Naxos, Italy, July 2005. [12] A. Wang. A. Chandrakasan, “Energy efficient
system partitioning for distributed wireless sensor networks”, Proceedings of the International Conference on Acoustics, Speech, and Signal processing (ICASSP-2001), Salt Lake City, Utah, 2001.
[13] S.S. Pradhan, J. Kusuma, K. Ramchandran, “Distributed compression in a dense microsensor network”, IEEE Signal Processing Magazine 19 (2) (2002) 51–60. [14]B. Song, O. Bursalioglu, A. Roy-Chowdhury,
and E.Tuncel. Towards a distributed video compression algorithm, University of
California, Riverside, http://www.dvsp.ee.ucr.edu/