Prediction using Classification Technique for the
Students’ Enrollment Process in Higher Educational
Institutions
Priyanka Saini
Research Scholar, Banasthali University
Ajit Kumar Jain
Asst. Prof., AIM & ACT, Banasthali University
ABSTRACT
In recent years, Indian higher educational institutes grow rapidly. There is more competition between institutes for attracting students to get enrollment in their institutes. The admission process is conducted every year at the institute and it results in the recording of large amounts of data. But, in most of the cases this data is not properly utilized (or analyzed) and results in wastage of what would otherwise be one of the most precious assets of the institutes. By applying the various data mining techniques on this data one can get valuable information and predictions can be done for the betterment of the admission process. This study presents data mining techniques for the enrollment process in MCA stream. These methods will help to improve the overall performance of the admission process at higher educational institutes.
General Terms
Data Mining, Classification, Data Preprocessing, KDD
Keywords
Educational Data Mining, Decision Tree Algorithm (ID3, J48), WEKA.
1. INTRODUCTION
Now a day’s modern educational institutes and organizations start developing and improving their educational system, by which decision makers can make better decisions using data mining methods. The most powerful feature of data mining is analyzing and extraction of hidden patterns and relationships from the data. Data mining is used for preprocessing the data and this data is successfully applied in many areas including the educational environment to obtain useful knowledge from the data. Educational Data Mining (EDM) whose research work with the data mining in which information is generated from educational institutes. This research work continues to grow, and many data mining methods have been applied in this research work. The goal of each research is to convert raw data into a meaningful form to make a better decision. Educational data mining is a most research area which extracts useful and unknown patterns from database for better understanding, increased performance of the student learning process [1].
This paper highlights our current study in which classification method is used to select a best & suitable student for enrollment in a particular stream (MCA). For this purpose tree-based ID3 & J48 classification algorithms are used to analyze the data. The major challenges of higher education institutions are that selection of a best & a suitable student for enrollment in a particular stream. All the enrolled students should be complete their degree by the stipulated time. This study overcomes these challenges.
2. CLASSIFICATION
Classification-First step:-learning, in which training database instances are analyzed by a classification algorithm. Second step:-model is used and tested with a different datasets by which model’s classification accuracy is tested, if model’s accuracy is better, then this model can be use for classification. There are many classification methods such as Naive Bayes and Bayesian Belief Networks, Decision Tree, Neural Network etc. But Decision Tree is the basic and popular technique for classification.
2.1 Decision tree
It is a tree structure like a flow-chart, in which the rectangular boxes are called the node. Each node represents a set of records from the original data set. Internal node is a node that has a child and leaf (terminal) node is a node that don’t have children. Root node is a topmost node. The decision tree is used for finding the best way to distinguish a class from another class. There are five mostly & commonly used algorithms for decision tree: - ID3, CART, CHAID, C4.5 algorithm and J48.
ID3 refers to Iterative Dichotomise 3 algorithm. It was introduced by J. R. Quinlan [2]. ID3 does not guarantee an optimal solution. It uses a greedy method by selecting the best & appropriate attribute to split the dataset on each iteration. In this algorithm the highest information gain value attribute is selected as the root node.
C4.5 developed by Ross Quinlan. It is the ID3 algorithm’s sucessor.This algorithm can handle both discrete and continuous attributes.This algorithm uses Gain ratio [3] as an attribute selection measure.
J48 generates a decision tree using the concept of information entropy from a set of labeled training data.It is an implemented form of C4.5 algorithm.
2.1.1 The id3 decision tree
The ID3 algorithm is precursor of C4.5 algorithm. In 1986, it is invented by Ross Quinlan.ID3 algorithm create the smallest possible decision tree. ID3 choose the splitting attribute using the information gain measure. It accepts only categorical attributes but continuous attribute can be handled by discretizing them. In this algorithm the attribute with the highest information gain value is selected as the root node in building the decision tree. Then all outcome instance’s class is tested to check whether each belongs to the same class or not.
2.1.1.1
Measuring Impurity
38 impurity there are most well known indices such as entropy
measure, classification error and Gini index.
Entropy =
The pure table consists single class and the probability is 1 (log (1) = 0) so the entropy of pure table is zero. When all classes in the table have equal probability then entropy reaches the maximum value.
2.1.1.2
Splitting Criteria
The information Gain measure is used to determine the best & appropriate attribute for a particular node of the tree. The information gain is Gain (S, A) of an attribute A, relative to a collection of examples S, as:
Gain (S, A) =Entropy(S) - ∑v € Values(A)
Entropy(Sv)
where Values(A) is the A’s set of all possible values and Sv
has values of the subset of S.In above equation the first term defines the entropy of the S and the second term in the equation is the expected value of the entropy.This expected entropy is the sum of the entropies of each subset of S, weighted by the fraction of examples .
Split information(S,A)=
Gain ratio(S, A) =
The information gain measure determines the appropriate attribute for a particular node in the tree. For partitioning and selecting the new attribute, the given values will be repeated for each non terminal node. All the given attributes will be appearing once in the tree. So above process will be continued in all leaf nodes till these any one of the conditions is met.
(i) Each attribute is included once in the path of the tree, or
(ii) If each attribute’s entropy value is zero, the given value will be associated with the leaf node.
2.1.2 The j48 decision tree algorithm
In this study, the algorithm that is used by Weka is J48, it is a version of earlier algorithm C4.5, in this algorithm continuous and discrete attributes can be used. It generates a decision tree using a information entropy concept .To making the decision it examines the information gain. In J48 there are many options for tree pruning that give more easily interpreted result. It forms pruned partial decision trees & convert them in to rule.J48 generalize a decision tree with flexibility and accuracy. To use J48 in Weka, click on ‘Choose’ button in the ‘Classifier’ box & select ‘Trees’ and then select ‘J48’ in it.
3. RELATED WORK
Data mining extract hidden patterns from the student database that provides help to university in education. The educational data mining is a recent and popular area, there are many journals,ongoingbooks,workshops[4]. Delavari and Beikzadeh [5] give knowledge to use data mining methods in Higher learning institutions and define how data mining can be applied to the educational data. R. R. Kabra and R. S. Bichkar [6] define that a model can be created using student’s past-academic performance with the help of decision tree algorithm and this model can predict student’s performance in the first year of engineering exam. Oladipupo and oyelade [7]
show their study in which student’s failure patterns are identified using association rule data mining technique. Their study trims down failure rate and improves academic performance.
Zlatko J. Kovacic [8] show a case study for student’s success prediction using educational data mining. For classify successful and unsuccessful students the CHAID and CART algorithm were applied on enrollment data of open polytechnic (New Zealand). Nguyen et al. [9] predict the performance of undergraduate and postgraduate students at two different institutes using decision tree and Bayesian network algorithms. This helps to find and assisting failing students and determines scholarship. In this result, decision tree gives better accuracy than Bayesian network. Hijazi and Naqvi [10] show a case study on student performance. In this study 300 student’s sample is taken from colleges of Punjab university(Pakistan). In this study they found that there is a high correlation between some factor (mother’s education factor and student’s family income factor) and student performance.
T.Miranda Lakshmi, A.Martin, R.Mumtaj Begum and Dr.V.Prasanna Venkatesan [11] conduct a case study on student’s qualitative data using decision tree algorithms to identify the effect of qualitative data in the performance of the student. Mohammed M. Abu Tair, Alaa M. El-Halees [12] conduct a case study on graduate students’ data using data mining techniques to improve performance and extract useful knowledge from this data.
Sunita B.Aher, L.M.R.J. lobo [13] conduct a comparative study to predict course selection using association rule algorithms.
4. PROPOSED WORK
In the proposed work KDD process’s steps are followed. The process starts from data collection and preprocessing followed by classification model and ends with model evaluation.
4.1 Data Collection and Preprocessing
Table 1: Student Related Variable
Type of Data
Attribute Name
Possible Values
Personal Data Category GEN,SC,ST,OBC
School Data XII Grade
Mathematics Grade in XII
O=90%-100%, A=80%-89%, B=70%-79%, C=60%-69%, D=50%-59%, E=40%-49%, F=< 40%
O=90%-100%, A=80%-89%, B=70%-79%, C=60%-69%, D=50%-59%, E=40%-49%,
F=<40%,Not applicable
Under Graduation Data
UG Stream
UG Grade
BCA,BSC(Math),BSC
O=90%-100%, A=80%-89%, B=70%-79%, C=60%-69%, D=50%-59%, E=40%-49%, F=< 40%
Post Graduation Data
PG Grade O=90%-100%, A=80%-89%, B=70%-79%, C=60%-69%, D=50%-59%, E=40%-49%, F=< 40%
The attribute’s values are explained as here follow for the analysis:
Category –Possible values for student categories are : General, OBC, SC and ST.
XII Grade - Students grade in XII exam. These Grades in XII exam are split into: O = 90% - 100%, A = 80% - 89%, B = 70% - 79%, C = 60% - 69%, D = 50% - 59%, E = 40% - 49%, and F =< 40%.
Mathematics Grade in XII – Student Grades in
Mathematics at XII exam. These Grades are split into: O= 90% - 100%, A= 80% - 89%, B =70% - 79%, C =60% - 69%, D=50% - 59%, E =40% - 49%, and F=< 40%.The Not-Applicable is assign to a student that has not the mathematics at XII level.UG Stream – Under graduation Stream. MCA admission is for all stream’s; therefore, under-graduation Stream are BCA, B.Sc. with mathematics and B.Sc. without mathematics.
UG Grade – Grade in Under graduation. These grade values are split into: O= 90% -100%, A= 80% - 89%, B =70% - 79%,
C =60% - 69%, D=50% - 59%, E =40% - 49%, and F=< 40%.
PG Grade – Grade Obtained in MCA (post graduation). It is split into: O= 90% - 100%, A= 80% - 89%, B =70% - 79%, C =60% - 69%, D=50% - 59%, E =40% - 49%, and F=< 40%.
4.2 Model Building
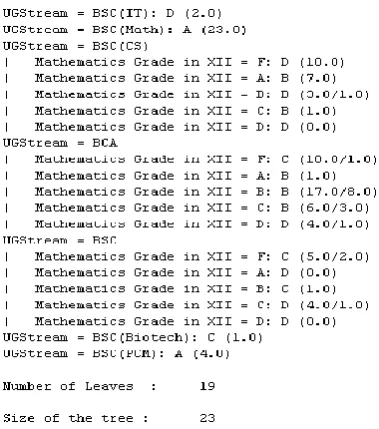
The next step of Knowledge Discovery in Database (KDD) process is to build a classification model, decision tree has been selected as a classifier under the cross validation method. For building a classification model ID3 decision tree has been used, ID3 algorithm use gain ratio for attribute selection measure. For splitting the node, the maximum gain ratio value added attribute is selected. In this study the attribute “UG Stream” is selected as the root node of the decision tree because it has maximum information gain value. The attribute “Mathematics Grade in XII” has the next highest information gain so this node is selected for splitting. This process continues until the complete decision tree is constructed. In this study WEKA toolkit 3.6.9 is used for constructing the decision tree(J48).The decision tree constructed by J48 is shown in fig.1.
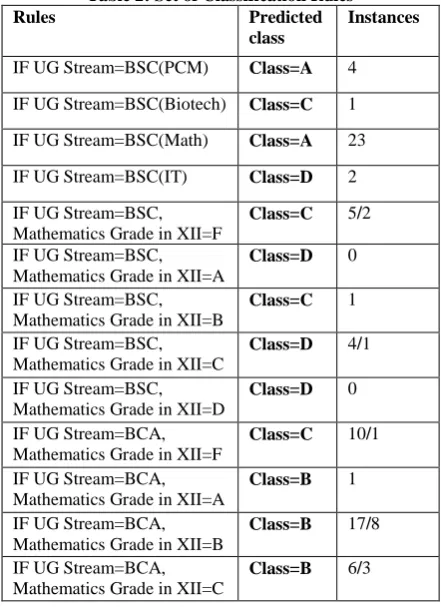
4.2.1 Classification Rules
After the decision tree construction, by tracing the path from the root node to a leaf node in the generated decision tree, classification rules can be extracted. In this paper a set of extracting classification rules shown in Table 2.These rules help to predict the grade of MCA student with their UG Stream. The class label has four class values A,B,C, and D.Table 2 shows the extracted rules, predicted class and number of instances (correctly and incorrectly classified instances) reached to a particular leaf node of the decision tree.
Table 2: Set of Classification Rules
Rules Predicted
class
Instances
IF UG Stream=BSC(PCM) Class=A 4
IF UG Stream=BSC(Biotech) Class=C 1
IF UG Stream=BSC(Math) Class=A 23
IF UG Stream=BSC(IT) Class=D 2
IF UG Stream=BSC, Mathematics Grade in XII=F
Class=C 5/2
IF UG Stream=BSC, Mathematics Grade in XII=A
Class=D 0
IF UG Stream=BSC, Mathematics Grade in XII=B
Class=C 1
IF UG Stream=BSC, Mathematics Grade in XII=C
Class=D 4/1
IF UG Stream=BSC, Mathematics Grade in XII=D
Class=D 0
IF UG Stream=BCA, Mathematics Grade in XII=F
Class=C 10/1
IF UG Stream=BCA, Mathematics Grade in XII=A
Class=B 1
IF UG Stream=BCA, Mathematics Grade in XII=B
Class=B 17/8
IF UG Stream=BCA, Mathematics Grade in XII=C
[image:3.595.318.539.463.767.2]40 IF UG Stream=BCA,
Mathematics Grade in XII=D
Class=D 4/1
IF UG Stream=BSC(CS), Mathematics Grade in XII=F
Class=D 10
IF UG Stream=BSC(CS), Mathematics Grade in XII=A
Class=B 7
IF UG Stream=BSC(CS), Mathematics Grade in XII=B
Class=B 3/1
IF UG Stream=BSC(CS), Mathematics Grade in XII=C
Class=B 1
IF UG Stream=BSC(CS), Mathematics Grade in XII=D
Class=D 0
4.3 Model Evaluation and Interpretation
[image:4.595.236.540.64.732.2]To evaluate the classification model 10-fold cross validation evaluation method is used. In this method all the data has been divided into 10 disjoint sets of equal size. Two decision tree algorithms ID3 and J48 are compared. The results of the comparisons are defined in Table3 for the cross validation method. The highest accuracy is achieved by ID3 decision tree algorithm. The accuracy of model is 69.69%Thismodel correctly classified the grades of 69 students among 100 students. The ranking of attributes is shown in Fig.2, According to a ranking of attributes the most attribute in predicting student’s enrollment is UG Stream. The confusion matrix defines the accuracy of the predicted class. The confusion matrix for ID3 & J48 is shown in Table 4 & Table 6 respectively. The class wise accuracy for ID3 & J48 is also shown in Table 5 & Table 7 respectively.
Fig 1: Decision Tree Construction by J48 in WEKA
Table 3: Using Cross Validation
Decision Tree
Accuracy Time taken to build the tree
correctly classified instances
incorrectl y classified instances
[image:4.595.57.277.71.208.2] [image:4.595.321.537.73.219.2]Id3 69.697% 0.0 second 69 20 J48 67.67% 0.03 second 67 32
Table 4: Confusion Matrix for ID3Algorithm Class
(PG Grade)
Predicted Class % of correct precision
D A B C
Actual Class
D 18 0 1 4 78.26%
A 0 27 7 0 79.41%
B 0 0 18 0 1%
C 6 0 2 6 42.85%
Table 5: Class Wise Accuracy for Four Class Prediction for ID3
PG Grade TP Rate FP Rate
D(50-59) 0.78 0.09
A(80-89) 0.79 0
B(70-79) 1 0.14
[image:4.595.314.550.303.703.2]C(60-69) 0.42 0.05
Table 6. Confusion Matrix for J48 Algorithm Class
(PG Grade)
Predicted Class % of correct precision
D A B C
Actual Class
D 16 0 1 6 69.56 %
A 0 27 7 0 79.41%
B 5 0 16 2 69.56%
C 5 1 5 8 42.10%
Table 7: Class-Wise-Accuracy in J48 PG Grade TP-Rate FP-Rate
D(50-59) 0.69 0.13
A(80-89) 0.79 0.01
B(70-79) 0.69 0.17
C(60-69) 0.42 0.1
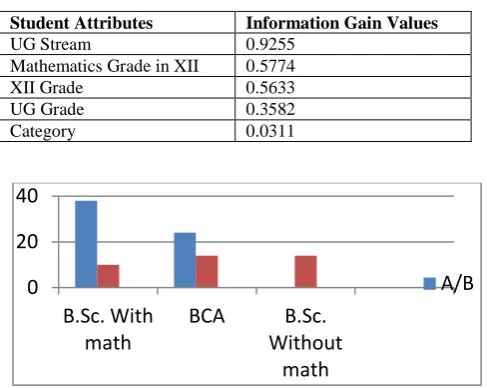
Fig2: Ranking of attributes by information Gain Attribute Evaluation
[image:4.595.64.254.427.642.2]In Fig.2 the graph is plotted with Attributes at ‘X’ axis and Information gain values at ‘Y’ axis. These attributes are ranked by their information gain values.
Table 8: Information gain values of attributes
Student Attributes Information Gain Values
UG Stream 0.9255
Mathematics Grade in XII 0.5774
XII Grade 0.5633
UG Grade 0.3582
Category 0.0311
Fig.3 Student performance in MCA with given UG Stream
[image:5.595.49.281.424.553.2]In Fig.3 the graph is plotted with UG Stream at ‘X’ axis and performance at ‘Y’ axis. The MCA Student performance with UG Stream is represented by number of instances in generated rules.
Table 9: Generated rules for student performance in MCA
Generated Rules Predicted Class
Instances
IF UG Stream=BSC with math (PCM, Math, CS)
A / B
38
IF UG Stream=BSC with math (PCM, Math, CS)
C / D
10
IF UG Stream=BCA A / B
24
IF UG Stream=BCA C / D
14
IF UG Stream=BSC without math A / B
0
IF UG Stream=BSC without math C / D
13
5. CONCLUSION
In this paper,a reasonably accurate model has been built that helps academicians and administrators to predict student’s enrollment in MCA course. This study examines that student’s performance(past academic)can be used to construct a model using classification with a decision tree algorithm (ID3 and J48 decision tree algorithm).The concept of classification with Decision Tree helps to extracting the knowledge from the past academic data. In the confusion matrix of ID3 and J48, it is shown that out of four actual categories, the accuracy of D class is 78.3% and 69.6% respectively that means this model is successfully identifying the which student doesn’t perform better in MCA. So, there is a need for proper counseling for the students that are going to select in MCA course. This study also helps students in selecting the course for admission according to his skills and academics. It results in that B.Sc. students with Mathematics and BCA stream students performed better in MCA but B.Sc. without Mathematics stream students did not perform well.
6. REFERENCES
[1] A.Y.K. Chan, K.O. Chow, and K.S. Cheung.”Online Course Refinement through Association Rule Mining” Journal of Educational Technology Systems Volume 36, Number 4 / 2007-2008, pp 433 – 44, 2008.
[2] J.R. Quinlan, Introduction of Decision Trees. Machine learning, 1: 86-106, 1986.
[3] B.K.Bharadwaj and S. Pal. “Mining Educational Data to Analyze Studentss’ Performance”, International Journal of Advanced Computer Science and Applications (IJACSA), Vol. 2, No. 6, 2011.
[4]C. Romero and S. Ventura, “Educational data mining: A survey from 1995 to 2005”.Expert Systems with Applications 33 (2007) 135-146.
[5] Delavari N, Beikzadeh M.R. “Data Mining Application in Higher Learning Institutions “Informatics in Education, 2008, Vol. 7,No. 1, 31-54.
[6] R. R. Kabra and R. S. Bichkar, “Performance Prediction of Engineering Students using Decision Trees “International Journal of Computer Applications (0975 – 8887) Volume 36- No.11, December 2011.
[7] Oladipupo O.O. and Oyelade O. J., Knowledge Discovery from Student’s Result Repository: Association Rule Mining Approach.International Journal of Computer Science & Security (IJCSS), Volume (4) : Issue (2).
[8] Zlatko J.Kovacic, “Early Prediction of Student Success: Mining Students Enrollment Data”, Proceedings of Informing Science & IT Education Conference (InSITE)2010.
[9] Nguyen Thai Nghe, Paul Janecek, and Peter Haddawy, “A Comparative Analysis of Techniques for Predicting Academic Performance”,In Proceedings of the 37th
ASEE/IEEE Frontiers in Education Conference. Pp. 7-12, 2007.
[10] Syed Tahir Hijazi, and S. M. M. Raza Naqvi, Factors affecting students’ performance: A Case Of Private Colleges. Bangladesh e-Journal of Sociology.Volume3.Number1, January 2006.
[11] T.Miranda Lakshmi, A.Martin, R.Mumtaj Begum and Dr.V.Prasanna Venkatesan,An Analysis on Performance of Decision Tree Algorithms using Student’s Qualitative Data. I.J.Modern Education and Computer Science, 2013, 5, 18-27.
[12] Mohammed M. Abu Tair, Alaa M. El-Halees, Mining Educational Data to Improve Students’ Performance: A Case Study.International Journal of Information and Communication Technology Research.Volume 2 No. 2, February 2012.
[13] Sunita B.Aher, L.M.R.J. lobo, “A Comparative study of classification algorithms”,International Journal of Information Technology and Knowledge Management, July-December 2012, Volume 5, N0.2, pp 239-243