Emotion Recognition in Music Signal using AANN
and SVM
N.J. Nalini
Assistant Professor,
Department of Computer Science & Engineering, Annamalai University, Tamilnadu, India.
S. Palanivel
Professor,
Department of Computer Science & Engineering, Annamalai University, Tamilnadu, India.
ABSTRACT
The main objective of this work is to develop a music emotion recognition technique using Mel frequency cepstral coefficient (MFCC), Auto associative neural network (AANN) and support vector machine (SVM). The emotions taken are anger, happy, sad, fear, and neutral. Music database is collected at 44.1 KHz with 16 bits per sample from various movies and websites related to music. For each emotion 15 music signals are recorded and each one is by 15sec duration. The proposed technique of music emotion recognition (MER) is done in two phases such, i) Feature extraction, and ii) Classification. Initially, music signal is given to feature extraction phase to extract MFCC features. Second the extracted features are given to Auto associative neural networks (AANN) and support vector machine (SVM) classifiers to categorize the emotions and finally their performance are compared. The experimental results show that MFCC with AANN classifier achieves a recognition rate of about 94.4% and with SVM classifier of about 85.0% thus outperforms SVM classifier.
Key words—Mel frequency cepstral coefficients, Auto associative neural networks, Support vector machine, Music emotion recognition
1. INTRODUCTION
Music plays an important role in human history and almost all music is created to convey emotion. Music organization and retrieval by emotion is a meaningful way for accessing music information. Many issues for music emotion recognition have been addressed by different disciplines such as psychology, physiology, musicology and cognitive science [1]-[3]. Emotion recognition from music signal is a difficult task due to the following reasons - First, emotion observation is basically subjective and people can recognize different emotions for the same song. Second, it is not easy to express emotion in a worldwide way because the adjectives used to describe emotions may be unclear, and the use of adjectives for the same emotion can vary from person to person. Third, it is still hard to know how music evokes emotion.
Music expressed as a language of emotions. The emotions are divided into three categories: expressed emotion, perceived emotion and evoked emotion [4]. The first refers that the performers communicate with listeners and the later two, responses of the listeners. Music emotion recognition (MER) system recognizes the perceived emotion, become relatively invariant to the context (environment, model) of listening. MER fall under two categories namely categorical approach and dimensional approach. The former divides emotion into a handful of classes and trains a classifier to predict the emotion of a song and the latter describes emotion with arousal and valance plane as the dimensions. Many of the researches employ any one of the system.
An important step in MER is feature extraction and classification. The importance in determination of feature extraction from audio signals is in the sense that they represent the music well and computation can be carried out efficiently. Much of work on extraction of features from music devoted to timberal texture features. MFCC is the well known timberal texture feature which is the highest performing individual feature used in speech recognition, can be examined for modeling of music. MER useful in many applications like music information retrieval, neurobiology and in music understanding.
The goal of this paper is to propose an efficient system for recognizing the five emotions of music content. First step is to analyze the musical feature MFCC and mapped them into five categories of sad, happy neutral, angry and fear. Secondly auto associative neural network is adopted as a classifier to train and test for recognition the five emotions and compared with the support vector machine. This paper is organized as follows: A review of literature on music emotion recognition is given in Section 2. Section 3 explains the MFCC feature extraction process from the input music signal. Section 4 gives the details of AANN model for emotion recognition. Section 5 explains the SVM model for emotion recognition. Experiments and results of the proposed work are discussed in Section 6. Summary of the paper and the future directions for the present work are provided in the last section of the paper.
2. RELATED RESEARCHERS:
A REVIEW
Many works have been carried out in the literature regarding emotion recognition using music and some of them are described in this section. The researches [5] - [9] categorized emotions into a various number of emotion classes and discussed the relationship between the music and emotion.
Yongjin Wang et al [10] used MFCC and formant frequency feature and reported 82.14% with the multiclassifier. Chuan-Yu Chang et al [11] used sequential floating forward selection to find the features in the music signal and SVM as a classifier achieved 73.08% performance. Bin Zhu et al [12] used neural network and genetic algorithm (GA-BP) for eight emotions and get the highest classification rate of 83.33%. Byeong-jun Han et al [13] used MFCC feature extraction and regression technique and achieved 87.0% recognition. Marius Kaminskas and Francesco Ricci[14] usedMFCC and SVM classifier for classifying six emotions and achieved 50% performance. Tao Li and MitsunoriOgihara [15] used MFCC for their content based music similarity search and emotion detection based on SVM classifier and achieved the performance about 70.0%.
for music emotion recognition and some other researchers used hidden markov model (HMM), vector quantizer (VQ), linear prediction cepstral coefficient (LPCC). The AANN classifier is not much explored for music emotion recognition. Hence this work compares the performance of AANN classifier with the most used SVM classifier for recognizing the emotion present in the music signal.
3. FEATURE EXTRACTION
3.1. Mel Frequency Cepstral Coefficients (MFCC)
[image:2.595.318.537.193.310.2]The MFCC – the dominant features used for speech recognition is examined for modeling music. MFCC is based on acoustic feature of content-based audio analysis [16]. MFCC is a short-term spectral-based feature contains much information. This section describes the process of extracting MFCC from the given input music signal. The procedure of MFCC computation is shown in Figure 1 and steps are described as follows [17]:
Fig 1. Extraction of MFCC from music signal.
Pre-emphasis: Pre-emphasis refers to a systematic process designed to increase the magnitude of higher frequencies with respect to the magnitude of the lower frequencies. This process will increase the energy of the signal at higher frequency, as they are weak in music signal. The output of the
pre-emphasis
sˆ
(n) is related to the input s(n) by the difference equation as stated in equation (1):1)
-s(n
s(n)
(n)
sˆ
(1) [image:2.595.60.268.297.413.2]The most common value for is around 0.95. The frequency of signals before pre-emphasis and after pre-emphasis is shown in Figure 2. Here x label denotes frequency and y label denotes energy.
Fig 2: Pre-emphasis of music signal.
Frame blocking: Framing enables the non-stationary music signal to be segmented into quasi-stationary frames. It is because, music signal is known to exhibit quasi-stationary behavior within the short period of time. In this step the
pre-emphasized music signal, s(n) is blocked into frames of N samples, with adjacent frames being separated by M samples. As stated in (2) the lth frame music is denoted by x(n), and there are L frames within the entire music signal,
1
1
0
1
1
0
ˆ
1
(n)
s
(Ml
n),
n
,
, ... ,N-
,
l
,
, ...
,L-x
(2) [image:2.595.322.524.444.533.2]Where each frame (as denoted by A in Figure 3) is 20ms in duration with an overlap of 10ms (as denoted by B in Figure 3) between adjacent frames. Here x label denotes samples and y label denotes amplitude.
Fig 3: Framing of a music signal.
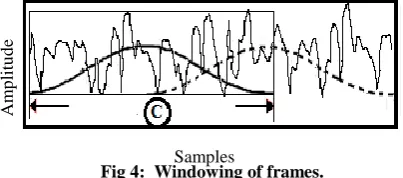
Windowing: The concept of windowing is to minimize the signal discontinuities at the beginning and the end of the frame. The window is defined as w(n), 0 n N – 1, where Hamming window is used in this work:
1
0
,
1
2
cos
56
.
0
54
.
0
)
(
n
N
N
n
n
w
(3)
By using the equation (3) the windowing (as denoted by C) of a frame is shown in Figure 4.
Fig 4: Windowing of frames.
FFT: FFT converts each frame of N samples from the time domain into the frequency domain. The FFT is used to convert the convolution of the glottal pulse U[n] and the vocal tract impulse response H[n]. In equation (4), s(w), H(w) and
(n)
sˆ
are the FFT of s(t), H(t) andsˆ
(t)
represented in the time domain.)
(
*
)
(
)]
(
*
)
(
[
(n)
sˆ
FFT
H
t
s
t
H
w
s
w
(4)Computing mel spectral coefficients: The bank of filters according to Mel scale as shown in Figure 5. This figure shows a mel filter bank consists of overlapping triangular filters with the cutoff frequencies determined by the center frequencies of the two adjacent filters. Then, each filter output is the sum of its filtered spectral components. The following equation (5) is used to compute the Mel for given frequency f in HZ:
700
1
log
2595
)
(
f
10f
Mel
(5)Am
p
li
tu
d
e
Samples
B A
En
erg
y
Before After
Frequency Frequency
En
erg
y
Am
p
li
tu
d
e
[image:2.595.57.270.606.691.2]Fig 5: Mel-scale filter bank
Log: Logarithm compresses the dynamic range of values and makes frequency estimates less sensitive. Compute the logarithm of the square magnitude of the output of the Mel - filter bank.
Discrete Cosine Transform: This is the process to convert the log Mel spectrum into the time domain.
Delta energy and delta spectrum: The music signal and the frame changes, such as the slope of a formant at its transitions. Therefore, there is a need to add features related to the change in cepstral features over time. 13 delta or velocity features (12 cepstral features Therefore, there is a need to add features related to the change in cepstral features over time. plus energy), and 39 features a double delta or acceleration feature are added. The energy in a frame for a signal s(t) in a window from time sample t1 to time sample t2, is represented
by:
]
[
2t
s
Energy
(6) Each of the 13 delta features represents the change between frames in the equation (6) corresponding cepstral or energy feature, while each of the 39 double delta features represents the change between frames in the corresponding delta features.4. AANN MODEL FOR MUSIC
EMOTION RECOGNITION
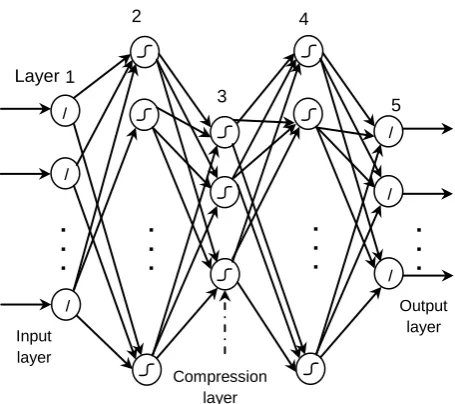
AANN models are basically feed forward neural network (FFNN) models which try to map an input vector onto itself [18], [19]. It consists of an input layer, an output layer and one or more hidden layers.
The number of units in the input and output layers are equal to the size of the input vectors. The number of units in the hidden layer is less than the number of units in the input or output layers. The middle layer is also the dimension compression layer. The activation function of the units in the input and output layers are linear, whereas the activation function of the units in hidden layer can be either linear or nonlinear.
[image:3.595.74.270.79.187.2]
Fig 6: Five layer auto associative neural network.
A three layer AANN model clusters the input data in the linear subspace, whereas a five layer AANN model captures the nonlinear subspace passing through the distribution of the input data. Studies on three layer AANN models show that the nonlinear activation function of the hidden units clusters the input data in a linear subspace [20]. The weights of the network will produce small errors only for a set of points around the training data. When the constraints of the network are relaxed in terms of layers, the network is able to cluster the input data in the nonlinear subspace. Hence a five layer AANN model as shown in Figure 6 is used to capture the distribution of the feature vectors in our study.
The performance of AANN models can be interpreted in different ways, depending on the problem and the input data. If the data is a set of feature vectors in the feature space, then the performance of AANN models can be interpreted either as linear and nonlinear principal component analysis (PCA) or distribution capturing of the input data [21], [22].
During AANN training, the weights of the network are adjusted to minimize the mean square error obtained for each feature vector. If the adjustment of weights is done for all feature vectors once, then the network is said to be trained for one epoch. During the testing phase, the features extracted from the test data are given to the trained AANN model to find its match.
5. SVM MODEL FOR MUSIC EMOTION
RECOGNITION
Support vector machine (SVM) is based on the statistical learning theory of Vapnik [23] and quadratic programming. The aim of SVM classifier is to devise a computationally efficient way of learning ‘good’ separating hyperplanes between different classes in a high dimensional feature space. SVM is used to identify a set of linearly separable hyperplanes which are linear functions of the high dimensional feature space.
The basic idea is to transform input vectors into a high dimensional feature space using a nonlinear transformation, and a linear separation in feature space.
To construct a nonlinear support vector classifier, the inner product (x, y) is replaced by a kernel function K (x, y):
/
/
/
/
/
/ 1
2
3
4
5 Layer
Input layer
Compression layer
Output layer
)
)
,
(
sgn(
)
(
x
y
K
x
z
b
f
i j i
(7)
The SVM has two layers. During the learning process, the first layer selects the basis K(xi; x), i =1; 2; . . . ;N from the
[image:4.595.57.287.197.421.2]given set of bases defined by the kernel; the second layer constructs a linear function in this space. The SVM algorithm can construct a variety of learning machines by use of different kernel functions [24]. Some of the most frequently used kernel functions are shown in Table 1.
Table 1. Different Types of Kernels and Kernel Functions
SVM kernels and kernel functions
where the parameters K and µ are the gain and shift.
Let {xi, yi} for i = 1, 2,., N denote the training data set
where yi is the target output for training data xi. SVM training
can be posed as the constrained optimization problem which maximizes the width of the margin and minimizes the structural risk (described by w) and it is given by:
N
i Tw C w b w 1 1 2 1 min
,
(8)subject to:
yi
(
W
Tφ
(
xi)
b
)
1
ξi
(9)
i
0,
ξi
where b is the bias, C is the trade-off parameter and ξi is the
slack variable and (.) is the feature vector in the expanded feature space.
The solution to (8) can be reduced to a QP optimization problem [25]:
N i N i N i jHij i i 1 1 1 2 1 max
(10)subject to
,
,
0
x
i
C
i
N i i iy
1,
0
where N_SV is the number of support vectors, ysv
where H is a N X N matrix, with (i, j)th element given by:
(
(
i)
(
j)
T j i
ij
y
y
x
x
H
(11)There is a Lagrange multiplier αi for each training sample xi.
Those samples whose αi’s are nonzero are called support
vectors (SV) and a portion of training samples become SVs. Solving the QP problem yields:
N i i ii
y
x
w
1
)
(
(12)and (12) can be rewritten in terms of support vectors as:
N SVsv
sv sv
sv
y
x
w
_1
)
(
(13) {1, +1} is the target value of learning pattern xsv and asv is
the Lagrange multiplier value of the support vectors.
The basic form of a SVM classifier can be expressed as:
b
z
w
z
Y
(
)
T
(
)
(14)where z is the test input vector, w is a vector normal to the
hyperplane and b is the bias. The feature space is produced from the feature mapping function (.).
From (13) and (14), the SVM classifier equation for the test data z can be expressed as [26]:
N SVsv sv sv sv SV N sv sv T sv
sv
y
z
b
y
K
z
b
z
Y
_ 1 , _ 1,
)
(
)
(
)
(
(
)
(
(15)where K(xsv, z) = (T (xsv) (z)) is a kernel function that maps
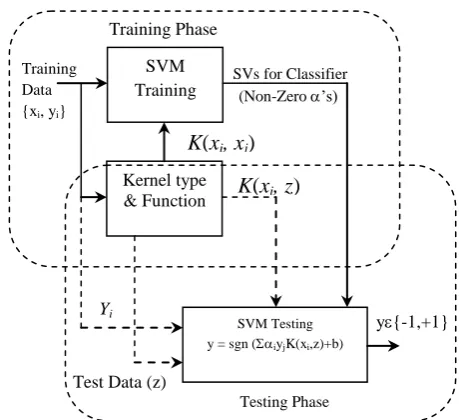
the input into higher dimensional feature space. Figure 7 shows the block diagram for the SVM classifier.
Fig 7: Block diagram of SVM classifier.
Kernel Kernel function
Linear i T i
z
x
z
x
K
(
,
)
Polynom
ial
(
,
)
(
)
,
d i T
i
z
y
x
z
x
K
where d is the degree of polynomial
RBF
)
(
exp
)
,
(
x
z
y
x
iz
i 2K
Sigmoid
(
,
)
tanh
(
1
)
i T i
z
yx
z
x
K
Wavelet,
)
,
(
1
a
z
x
h
z
x
K
N i ii
)
75
.
1
cos(
)
(
where
h
x
x
is
and
2
exp
2a
x
the dilation parameter
SVM Training Kernel type & Function SVM Testing y = sgn (iyjK(xi,z)+b)
y{-1,+1}
Testing Phase Test Data (z)
Yi
K
(
xi, z
)
K
(
xi, xj
)
SVs for Classifier (Non-Zero ’s) Training Phase
[image:4.595.312.542.533.743.2]6. RESULTS AND DISCUSSION
6.1 Music Database
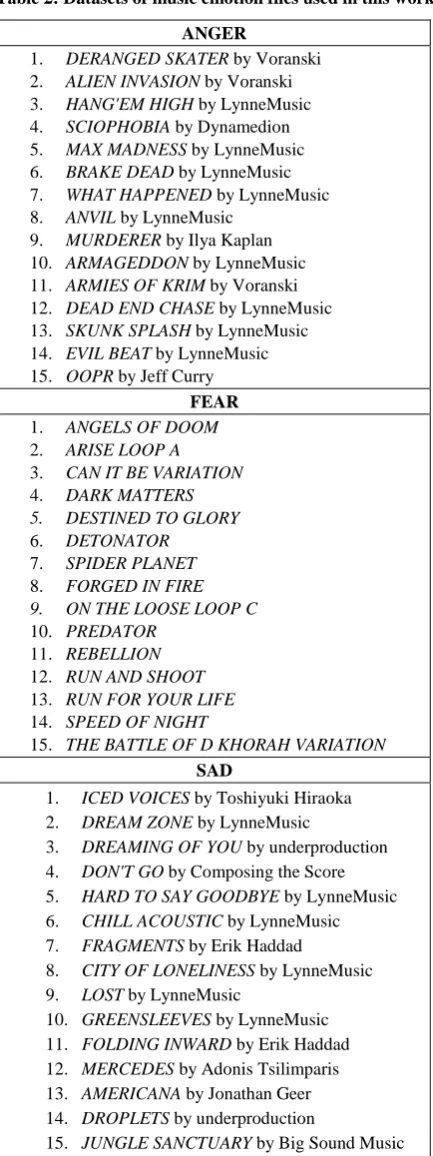
[image:5.595.59.276.185.764.2]The five basic emotions taken for the study are; fear, happy, angry, sad and neutral(shown in Figure 8) For each emotion 15 music files are collected with 15s duration, 44.1 kHz sampling frequency, mono and 16 bit rate. The music file is collected in the mp3 format and converted into wav format using Praat software.
Table 2: Datasets of music emotion files used in this work
ANGER
1. DERANGED SKATER by Voranski 2. ALIEN INVASION by Voranski 3. HANG'EM HIGH by LynneMusic 4. SCIOPHOBIA by Dynamedion 5. MAX MADNESS by LynneMusic 6. BRAKE DEAD by LynneMusic 7. WHAT HAPPENED by LynneMusic 8. ANVIL by LynneMusic
9. MURDERER by Ilya Kaplan 10. ARMAGEDDON by LynneMusic 11. ARMIES OF KRIM by Voranski 12. DEAD END CHASE by LynneMusic 13. SKUNK SPLASH by LynneMusic 14. EVIL BEAT by LynneMusic 15. OOPR by Jeff Curry
FEAR
1. ANGELS OF DOOM 2. ARISE LOOP A 3. CAN IT BE VARIATION 4. DARK MATTERS 5. DESTINED TO GLORY 6. DETONATOR
7. SPIDER PLANET 8. FORGED IN FIRE 9. ON THE LOOSE LOOP C 10. PREDATOR
11. REBELLION 12. RUN AND SHOOT 13. RUN FOR YOUR LIFE 14. SPEED OF NIGHT
15. THE BATTLE OF D KHORAH VARIATION
SAD
1. ICED VOICES by Toshiyuki Hiraoka 2. DREAM ZONE by LynneMusic
3. DREAMING OF YOU by underproduction 4. DON'T GO by Composing the Score 5. HARD TO SAY GOODBYE by LynneMusic 6. CHILL ACOUSTIC by LynneMusic 7. FRAGMENTS by Erik Haddad
8. CITY OF LONELINESS by LynneMusic 9. LOST by LynneMusic
10. GREENSLEEVES by LynneMusic 11. FOLDING INWARD by Erik Haddad 12. MERCEDES by Adonis Tsilimparis 13. AMERICANA by Jonathan Geer 14. DROPLETS by underproduction
15. JUNGLE SANCTUARY by Big Sound Music
NEUTRAL
1. ELYSIAN FIELDS by Chill Purpose 2. CHEAT THE HANGMAN by LynneMusic 3. SUNSET AVENUE by Chill Purpose 4. CHILLED HOUSE by LynneMusic 5. ALTITUDE by Julio Kladniew 6. CASCADE by Chill Purpose 7. THE JOURNEY by LynneMusic
8. UNDER THE BARD'S TREE by LynneMusic 9. CHILLIN-DA'HOUSE by Henry Gorman 10. HOLLYWOOD by Lynne Music
11. EVENING IN A SMALL VILLAGE ON THE BANKS OF LARGE RIVER by Dmitriy Lukyanov
12. STARFIELD by LynneMusic 13. BREAK DOWN by LynneMusic 14. IN MOTION by LynneMusic 15. RIVER ADVENTURE by LynneMusic
HAPPY
1. WILD AT HEART 2. SUNSHINE STATES 3. CARIBBEAN PARTY 4. FILL THE FLOOR LOOP 5. STREETNIGHTS 6. THERE IS NO END 7. THE TRUTH IN YOU LOOP 8. KNOWBODYS FOOL 9. BELLA ROSA 10. DANCE YE MERRY
11. ALL TOGETHER NOW by LynneMusic 12. BOULANGERIE by LynneMusic 13. DRIVING FORCE by LynneMusic 14. TOP OF THE WORLD by David Flavin 15. TORNADO ALLEY (by Notepad Music) 16. ATTENTION SHOPPERS by Jonathan Geer 17. C' EST CHAUD by LynneMusic
18. COMING HOME TO YOU by LynneMusic 19. MORNINGTON CRESCENT by LynneMusic 20. RED CAT by Dynamedion
21. ROLLIN' BLUES by LynneMusic 22. SLAP-STICK-DUCK by Notepad Music 23. SOME DAY by Voranski
24. TAKE OUT by LynneMusic 25. O'CLOCK HOP (by LynneMusic)
Fig 8: Types of music emotion files
From the following datasets 80% used for training and 20% used for testing.
6.2. Emotion Recognition using MFCC
The input music data are first pre-emphasized using a first-order digital filter and separated into 20ms frame with an overlap of 10ms between adjacent frames using Hamming window as described in the Section 3. The MFCC feature vectors are extracted for all input music signals and given to the AANN and SVM models for training and testing. The MFCC output for the fear emotion and sad emotion music input shown in Figure 9(a) and 9(b). The difference in the output of emotions may be noted in the Mel-Cepstrum coefficients.
Fig 9(a): MFCC output of music signal (fear emotion).
Fig9(b): MFCC output of music signal (sad emotion)
6.3. Recognizing Emotion using AANN Model
In this emotion recognition (ER) work, five AANN models are created for representing the five emotions: Anger (A), Fear (F), Happy (H), Neutral (N) and Sad (S) using the MFCC feature vectors.
The block diagram of the emotion recognition system using AANN models is shown in Figure 10. For evaluating the performance of the ER system, the feature vectors derived from the input music signal are given as input to five AANN models. The output of each model is compared with the input to compute the normalized squared error.
The normalized squared error (e) for the feature vector y is given by, ,
2 2
y o -y
e where othe output vector is given by
the model. The error e is transformed into a confidence score (s) using s=exp (-e). The average confidence score is calculated for each model. The category of the emotion is decided based on the highest confidence score.
[image:6.595.318.541.80.225.2]The training and testing of emotional speech data were done using the AANN structure 39L 50N 16N 50N 39L. The confusion matrix for five emotions using this structure is shown in the Table 3. Each column indicates the trained model and each row indicates the percentage of test utterances recognized by AANN model. The diagonal entries show the correct emotion recognition performance and other entries indicate percentage of misclassification. The average recognition performance for the five emotions using MFCC features with AANN model (39L 50N 16N 50N 39L) is about 94.4%. This indicates that the MFCC with AANN classifier captures emotion specific information in the music signal effectively.
Table 3. Emotion Recognition using MFCC Features and AANN Classifier
Emotion recognition performance ( in %) Anger Fear Happy Neutral Sad Anger 96.0 1.5 0.0 2.5 0.0
Fear 0.0 100.0 0.0 0.0 0.0
Happy 2.5 0.5 94.0 3.0 0.0
Neutral 0.0 0.0 0.0 100.0 0.0
Sad 0.5 1.5 12.0 4.0 82.0
[image:6.595.74.254.557.712.2] [image:6.595.322.544.642.755.2]6.4. Recognizing Emotion using SVM Model
In evaluation of emotions using SVM model five models are created for representing the emotions: Anger (A), Fear (F), Happy (H), Neutral (N) and Sad (S) using the MFCC feature vectors.
[image:7.595.49.284.133.328.2]
Fig 10. Recognition of emotion using AANN and SVM models.
The block diagram of the emotion recognition system using SVM models is shown in Figure 10. For evaluating the performance of the ER system testing feature vectors are given for each model. The training and testing is performed on each model to recognize the music emotion.
6.4.1. Training
Training is the process to learn from training samples by adaptively updating their values. MFCC features are given as input to the SVM. The SVM is trained in multi class mode, where the class labels 0, 1, 2, 3 and 4 represents anger, happy, sad, fear and neutral respectively
The combined format of the trained data is summarized and shown in matrix form in Figure 11.
[image:7.595.314.545.200.360.2]
Fig 11: SVM Training matrix.
Where n is the number of feature vectors, d is dimension of each feature vector (Number of features), last column denotes category of emotion.
6.4.2. Testing
For testing, MFCC features which are not trained are given as input to the SVM model. The SVM model produces the category for each music file and the majority rule is used to
decide the category of the emotions.
The confusion matrix for five emotions is shown in the Table 4. Each column indicates the trained model and each row indicates the test utterances recognized by different models. The diagonal entries show the correct emotion recognition performance and other entries indicate percentage of misclassification. The average recognition performance for the five emotions using MFCC features and SVM is about 85.0%.
Table 4. Emotion Recognition using MFCC Features and SVM Classifier
Performance of emotion recognition (in %)
Anger Fear Happy Neutral Sad
Anger 80.0 0.0 20.0 0.0 0.0
Fear 10.5 78.0 0.0 7.0 14.5
Happy 0.0 0.0 100.0 0.0 0.0
Neutral 3.5 1.5 0.5 87.0 7.5
Sad 9.7 2.0 0.0 8.3 80.0
Overall performance of SVM =85.0%
6.5. Comparison of Models
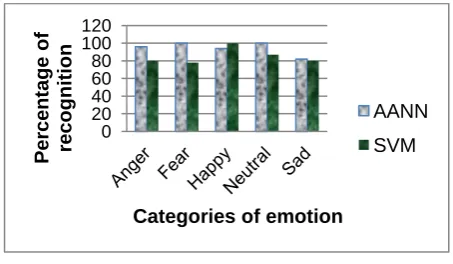
[image:7.595.93.240.521.671.2]The AANN and SVM models are compared to music emotion recognition. The feature vectors are extracted from the music signals using MFCC. The extracted features are recognized using AANN and SVM model. The training and testing are performed separately for each model. The performance of recognition for each emotion using AANN and SVM model is shown in Fig. 12. The percentage of recognition from the Figure 13, shows that AANN model recognizes the emotions anger, fear, neutral and sad better than the SVM model. With the AANN model the average recognition performance is about 94.4% and with the SVM model average recognition performance is about 85.0%. Experimental results show that music emotion recognition can be achieved using MFCC and AANN and outperforms SVM.
Fig 12: Comparison of models for music emotion recognition.
7. SUMMARY AND CONCLUSIONS
In this paper, the basic five emotions angry, happy, sad, fear and neutral were considered. The music signal database for this work was collected at 44.1 KHz with 16 bits per sample, collected from various websites. MFCC features are extracted from the music signal. The AANN and SVM classifiers were used to recognize the emotion. The training and testing
0 20 40 60 80 100 120
P
er
ce
n
tage
o
f
rec
o
g
n
it
ion
Categories of emotion
AANN
SVM
n (d+1) a11 a12 a13 a14…...a1d 0
an1 an2 an3 an4…….and 0
b11 b12 b13 b14…...b1d 1
bn1 bn2 bn3 bn4…….bnd 1
c11 c12 c13 a14…...c1d 2
cn1 cn2 cn3 cn4……..cnd 2
d11 d12 d13 d14…....d1d 3
dn1 dn2 dn3 dn4……dnd 3
e11 e12 e13 e14…...e1d 4
en1 en2 en3 en4……..end 4
Recognized
Emotion
D
e
c
is
ion
r
u
le
Feature Vector (MFCC)
Input Music signal
AANN/ SVM Anger
AANN/ SVM Fear
AANN/ SVM Happy
AANN/ SVM Neutral
[image:7.595.315.542.529.661.2]14 performed separately for each model. 80.0% of data was used
for training and 20.0% for testing. With the AANN model the average recognition performance is about 94.4% and with the SVM model average recognition performance is about 85.0%. The experimental result shows that the performance of the AANN model is better than the SVM model. The future work is to improve the performance of emotion recognition system by combining with the other methods.
8. REFERENCES
[1] Yi-Hsuan Yang. Homer H.Chen. 2010. Music Emotion Recognition. CRC Press.
[2] Yi-Hsuan Yang, Yu-Ching Lin and Homer H. Chen, 2007. A Regression Approach to Music Emotion Recognition, IEEE.
[3] Thayer, R.E. 1989. The Biopsychology of Mood and Arousal, New York, Oxford University Press.
[4] Lin, Y.-C. Yang, Y.-H. and Chen, H.-H. 2009. Exploiting genre for music emotion classification, Proc. IEEE Int. Conf. Multimedia Expo., 618-621. [5] Y.-H. Yang, H. H. Chen, 2009, Music emotion
ranking, In Proc. IEEE Int. Conf. of Acoust., Speech, Signal Process., 1657-1660.
[6] Eerola,T. Lartillot,O. Toiviainen,P. 2009. Prediction of multidimensional emotional ratings in music from audio using multivariate regression models, In Proc. Int. Conf. Music Inf. Retrieval, 621-626.
[7] Law, E. West, K. Mandel, M. Bay, M. and Downie, J. S. 2009. Evaluation of algorithms using games: The case of music annotation, , In Proc. Int. Conf. Music Inf. Retrieval, 387-392.
[8] F. Pachet and P. Roy, 2009, Improving multilabel analysis of music titles: A large-scale validation of the correction approach, IEEE Trans.on Audio, Speech, Lang. Processing., 17(2), 335-343.
[9] Bokyung Sung, Myung-Bum Jung,Ilju Ko, 2008. A featured based Music content Recognition method using Simplified MFCC, Int. Journal of Principles and Applications of Information Science and Technology,2(1).
[10] Yongjin Wang, Ling Guan, 2008. Recognizing Human Emotional State from Audiovisual Signals, IEEE Transactions on Multimedia, 10(5), 936-946.
[11] Chuan-Yu Chang, Keng Wu, Chun-Yen Lo, Chi-Jane Wang, Pau-Choo Chung, 2011. Music Emotion Recognition with Consideration of Personal Preference, IEEE transactions on Multimedia.
[12] Bin Zhu, 2010. Music emotion recognition system based on improved GA-BP, IEEE transaction on Computer Design and Applications, Vol.2, 409- 412.
[13] Byeong-jun Han, Seungmin Rho Roger,B Dannenberg, Eenjun Hwang, 2009. SMERS: Music Emotion Recognition Using Support Vector Regression, 10th International Society for Music Information Retrieval Conference (ISMIR 2009), 651-656.
[14] Marius Kaminskas, Francesco Ricci, 2012. Contextual music information retrieval and recommendation: State of the art and challenges, Computer science review6 (2012), 89 -11.
[15] Tao Li, MitsunoriOgihara, 2004. Content-Based Music Similarity Search and Emotion Detection”, International conference on Acoustics, Speech and Signal Processing (ICASSP 2004), 705- 708.
[16] Youngmoo E. Kim, Erik M. Schmidt, Raymond Migneco, Brandon G. Morton Music Emotion Recognition: A State of The Art Review.
[17] Patil, K. J. Zope, P. H. Suralkar, S. R. 2012. Emotion detection from speech using MFCC and GMM.
[18] Deshuang Huang, 1999. The bottleneck behaviours in linear feed forward neural network classifiers and their breakthrough, Computer Science and Technology, 14(1): 34-43.
[19] Palanivel, S. 2004. Person authentication using speech, face and visual speech, Ph.D. Thesis. Department of Computer Science and Engineering. Indian Institute of Technology, Madras.
[20] Bianchini, M. Frasconi, P. Gori, M. 1995. Learning in multilayered networks used as autoassociators, IEEE Transaction on neural networks, 6, 512-515.
[21] Kishore, S.P. Yegnanarayana, B. 2001. Online text independent speaker verification system using autoassociative neural network models. In proc. International joint conference on neural networks, Washington, DC. USA.
[22] Yegnanarayana, B. Kishore, S.P. 2002. AANN: an alternative to GMM for pattern recognition. Neural networks, 15, 459-569.
[23] Vapnik, V. 1998. Statistical learning theory. New York: John Wiley and Sons.
[24] Xu, C. Maddage,N.C. & Shao, X. 2005. Automatic music classification and summarization. IEEE Transactions on Speech and Audio Processing, 13(3), 441–450.
[25] Dhanalakshmi, P. Palanivel, S. Ramalingam, V. 2009. Classification of audio signals using SVM and RBFNN, Expert systems with applications, 36 (3.part 2), 6069-6075.
[26] Yashpalsing Chavhan, Dhore, M.L. Pallavi Yesaware, 2010. Speech Emotion Recognition Using Support Vector Machine, International Journal of Computer Applications, vol. 1, 6-9.